Ridge yield as a function of multiplicity. The black points correspond to the measurement presented in this Letter, while data from CMS are drawn as green and blue markers. Vertical bars denote statistical uncertainties while systematic uncertainty is shown as shaded area. For both results, at low multiplicity where the lower uncertainty reaches zero, an upper limit is reported, which is drawn as a bar and arrow-down. Such points are given at 95\% CL for the results from this Letter and at 67\% for the results from CMS. The ``MB'' arrow indicates the multiplicity averaged over the entire considered multiplicity range. Ridge yield as a function of multiplicity, compared to the upper limits on the ridge yield in \ee collisions. Vertical bars denote statistical uncertainties while systematic uncertainty is shown as shaded area. The orange limits represent the measurement in the thrust-axis reference frame with ALEPH . The horizontal bars in the ALEPH points represent the uncertainty related to the multiplicity conversion from the ALEPH to the ALICE acceptance (see text). All limits are given at 95\% CL. | 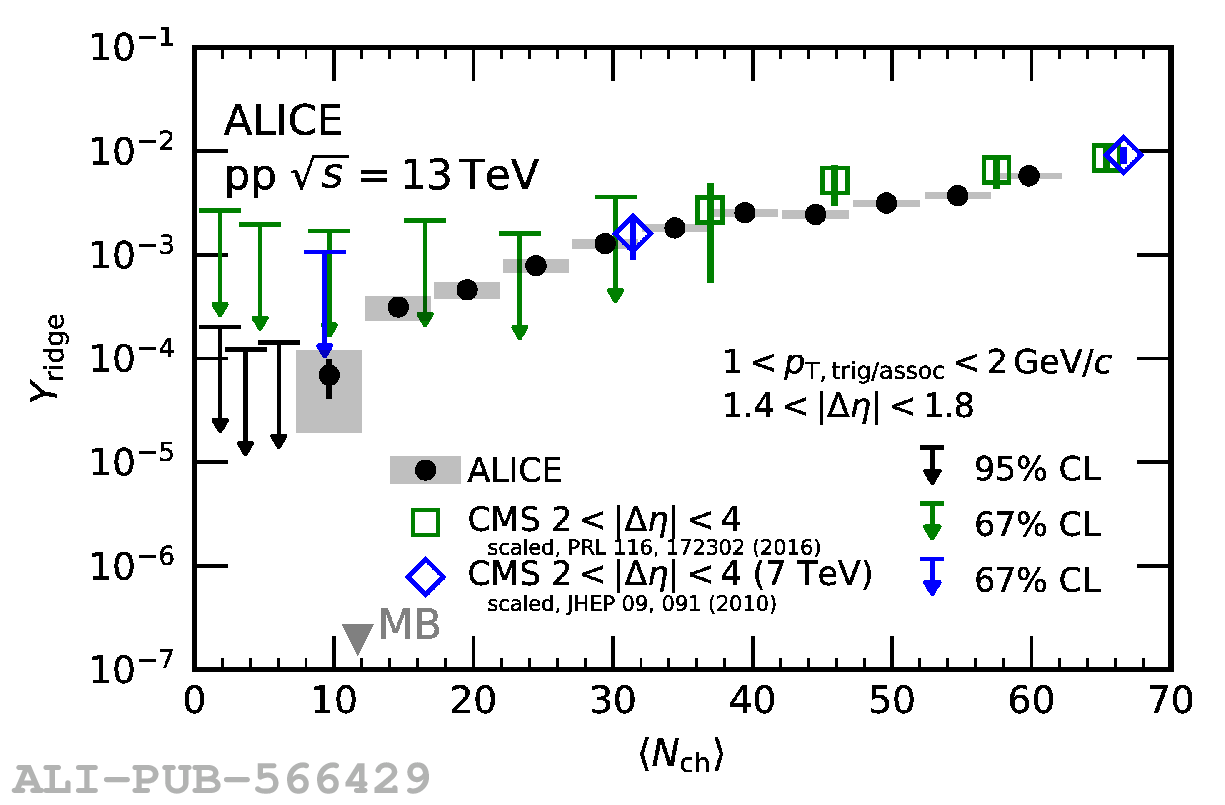 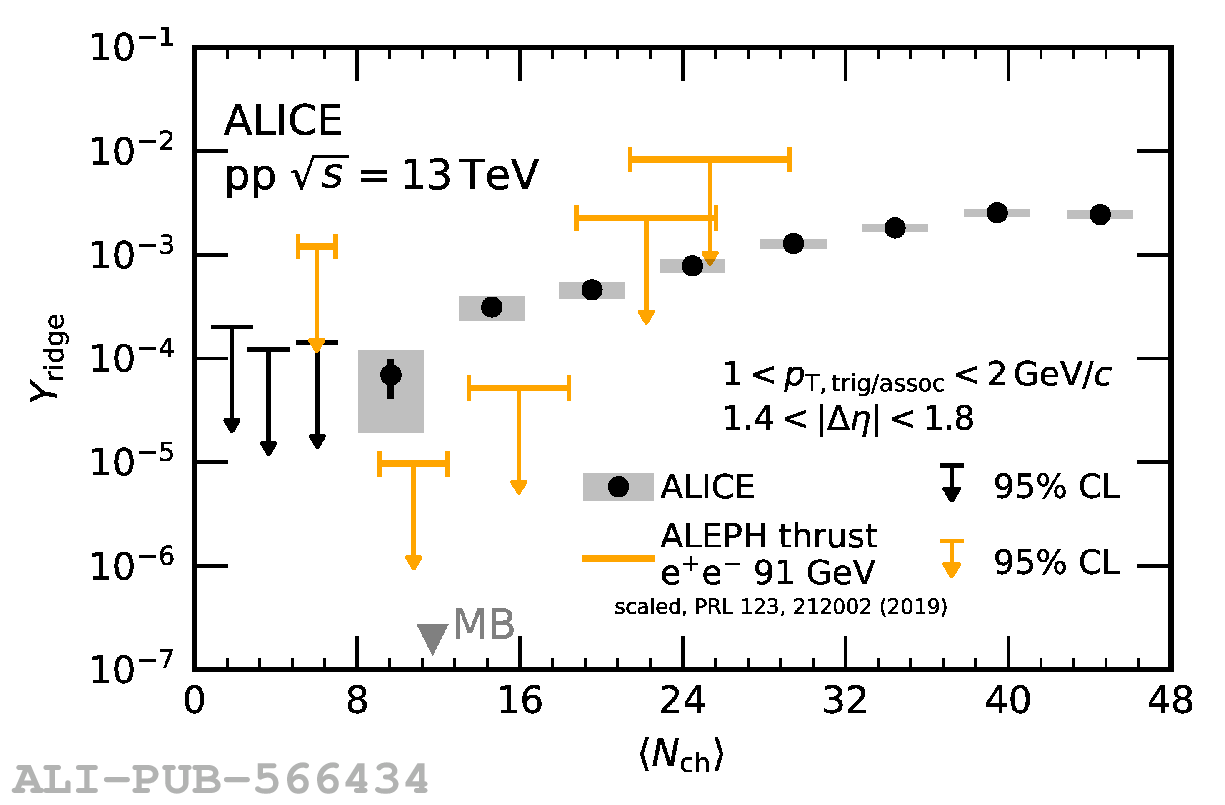 |