Measured transverse momentum distributions of ${}^{4}$He and ${}^{4}\overline{{\rm He}}$ (upper panel). The vertical lines indicate the statistical uncertainties, while boxes represent the systematic ones. In the case that the statistical uncertainties would overlap the ${}^{4}$He points are a bit shifted on the x-axis. The lower panel shows the ratio between ${}^{4}\overline{{\rm He}}$ and ${}^{4}$He with statistical and uncorrelated systematic uncertainties as the correlated systematic uncertainties cancel. | 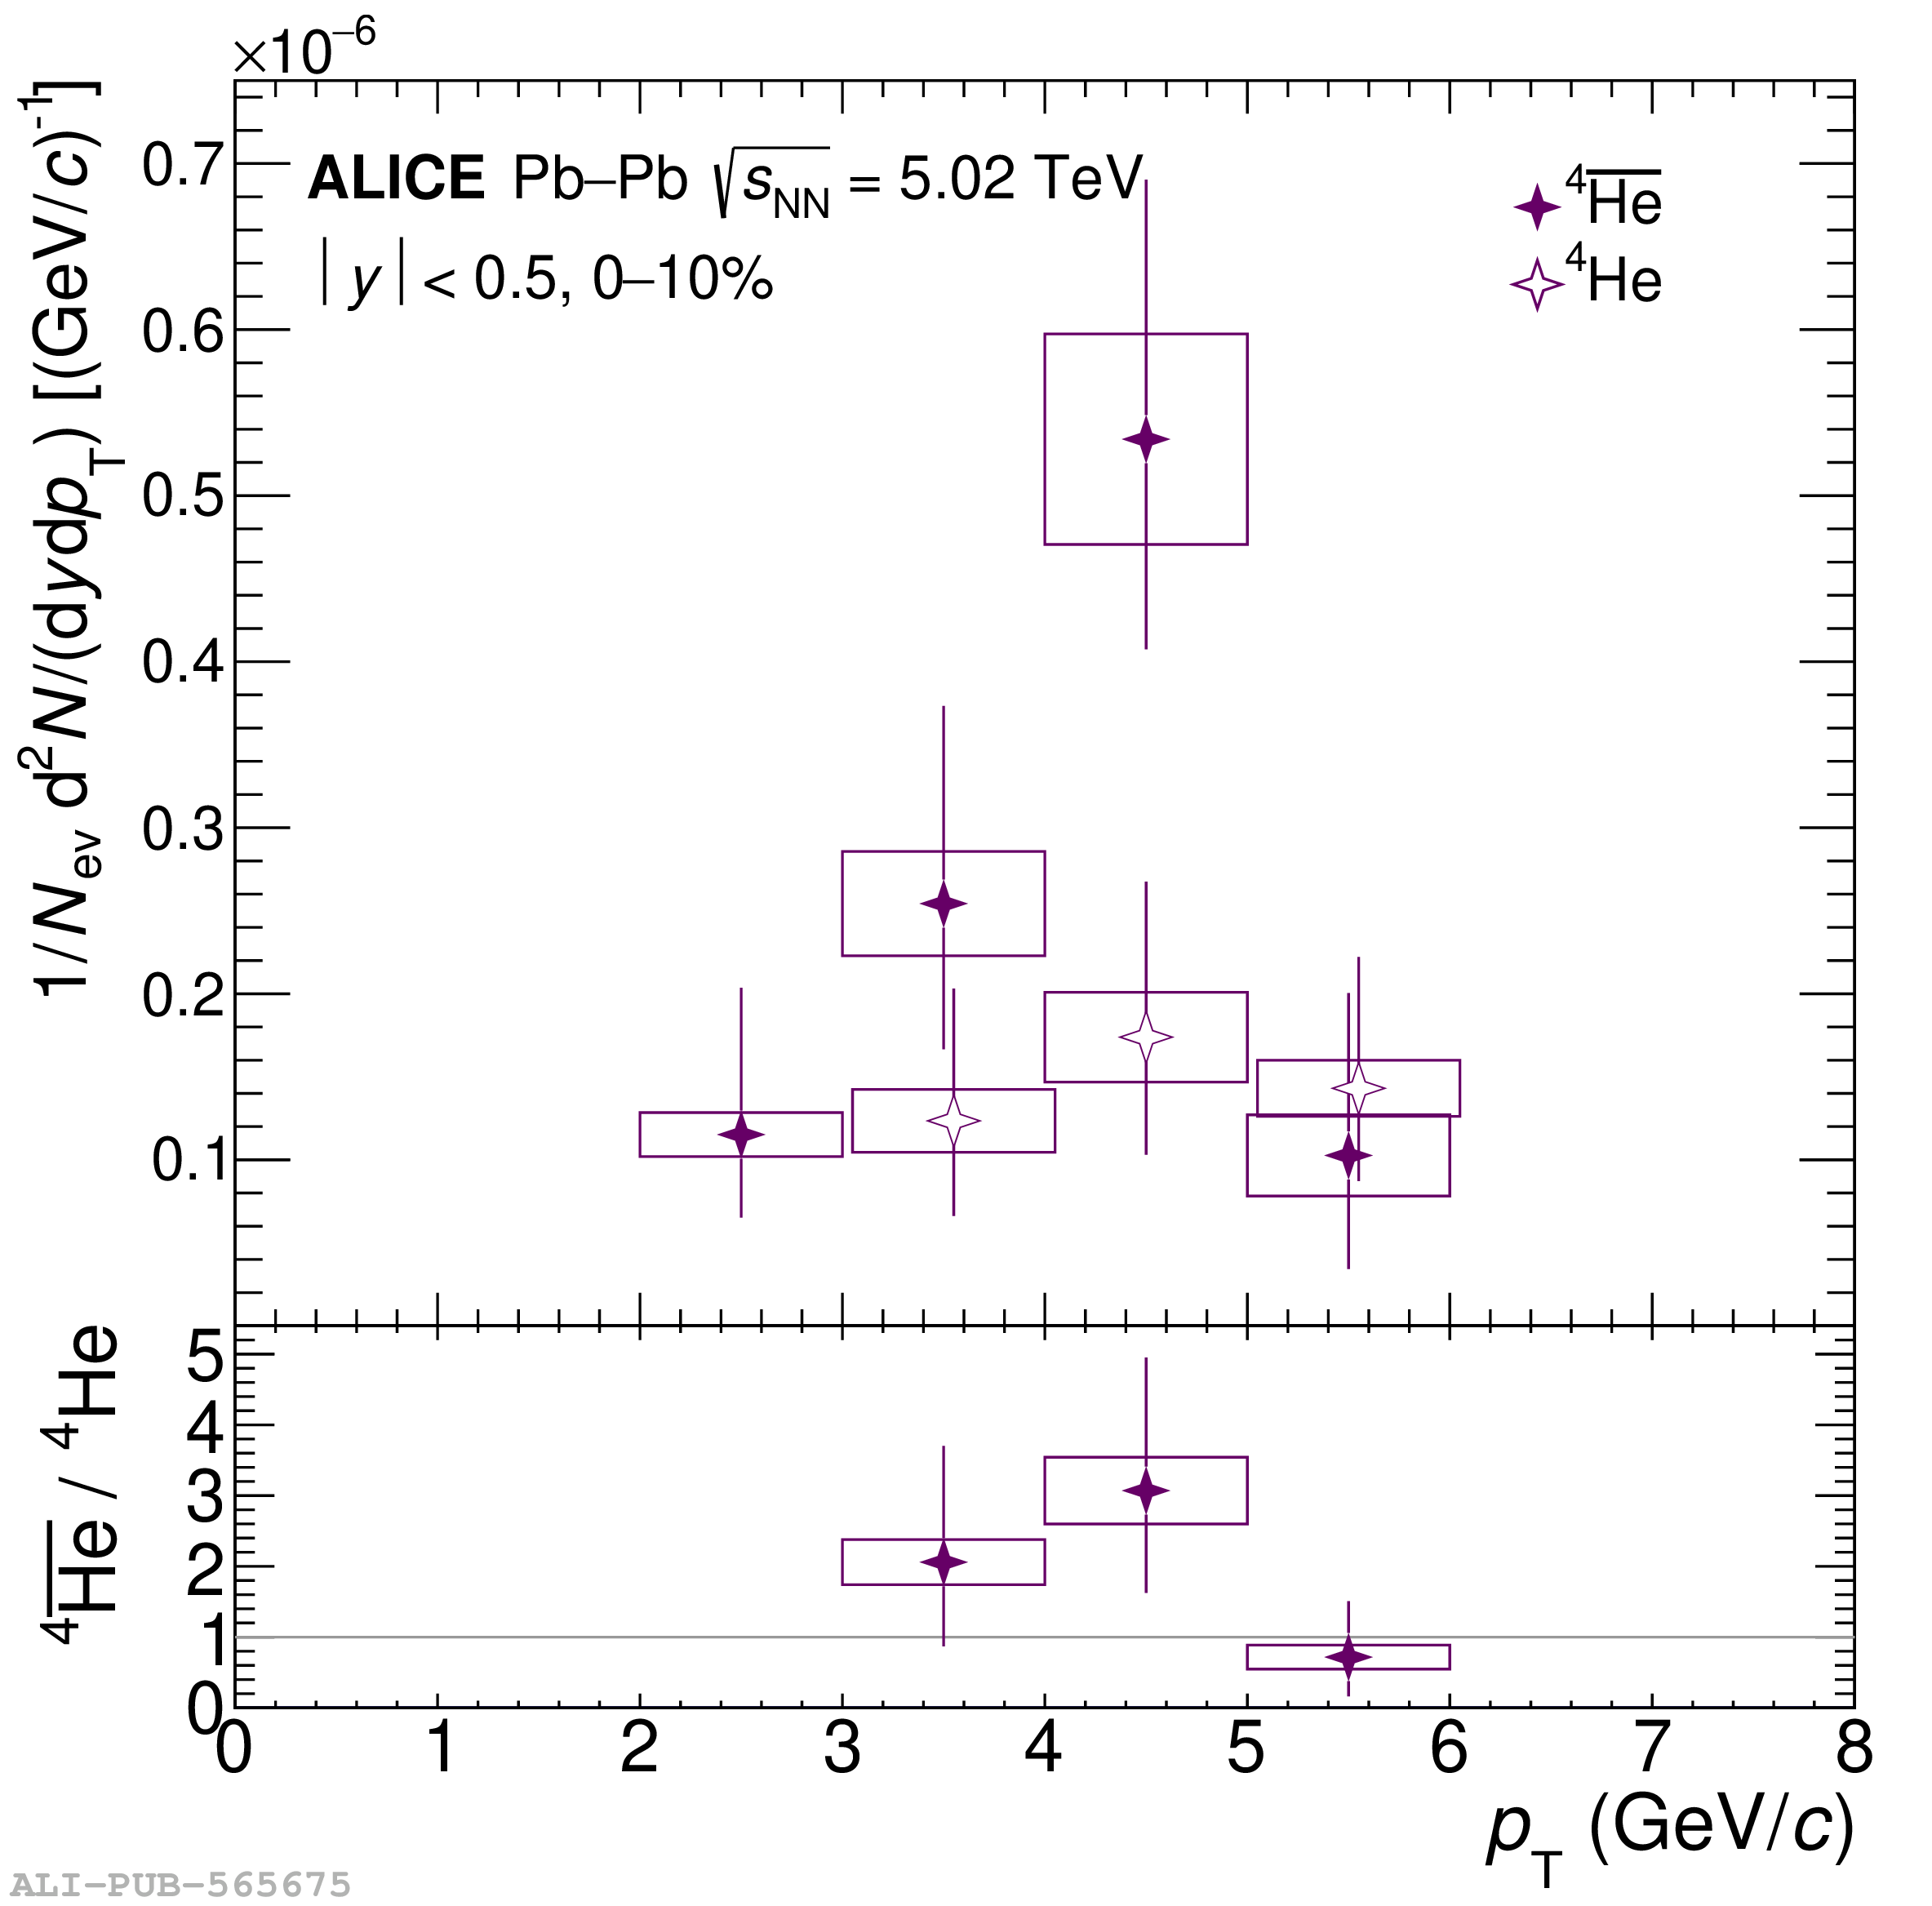 |