$m^2/z^2$ distribution for ${}^{4}\overline{{\rm He}}$ candidates (green). The background (magenta) is constructed by selecting all candidates outside the ${}^{4}\overline{{\rm He}}$ TPC window of 3$\sigma$ around the alpha mass hypothesis ($|n\sigma_{\rm TPC}({}^{4}\overline{{\rm He}})| > 3$) and in addition outside the 3$\sigma$ window around the deuteron mass hypothesis ($|n\sigma_{\rm TPC}(\overline{{\rm d}})| > 3$). The blue line is an exponential fit to the rise at lower masses originating from ${}^{3}\overline{{\rm He}}$ candidates. | 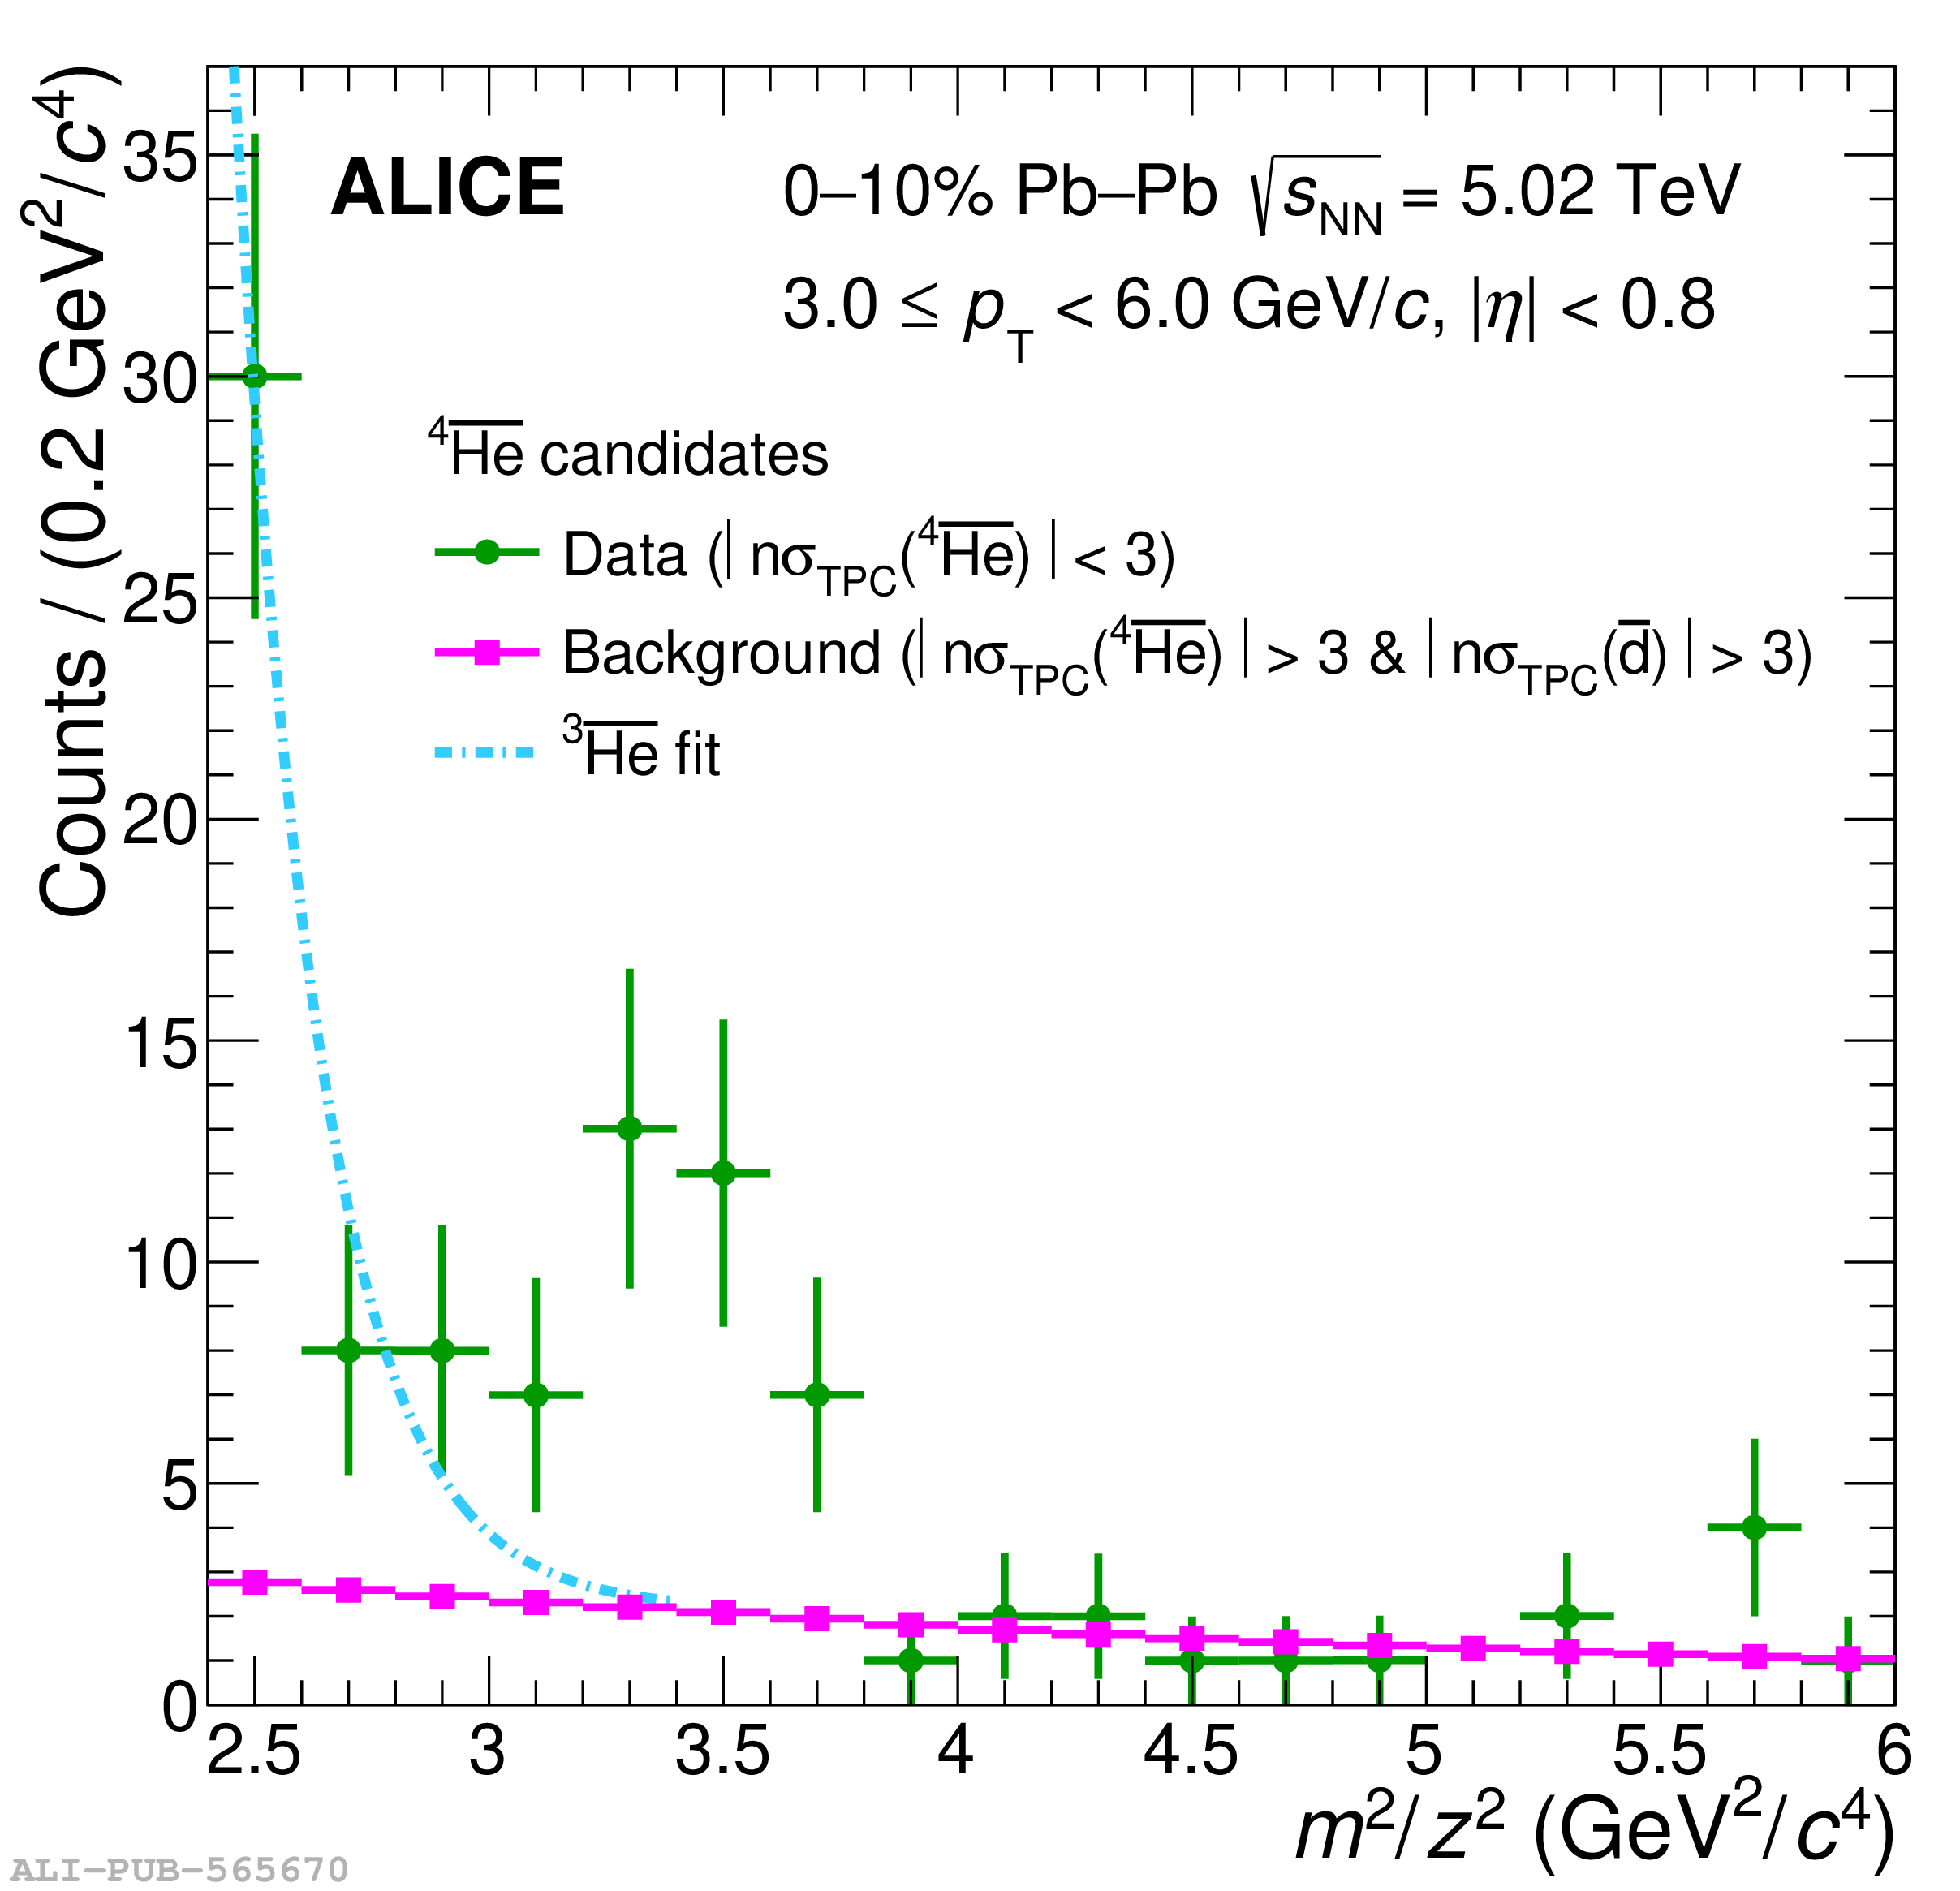 |