Invariant-mass distribution of opposite-sign muon pairs in (a) forward p-Pb, (b) backward p-Pb, and (c) pp data, integrated in multiplicity. Superimposed is a typical fit function, shown as a solid blue line (see text on details regarding the fit components). The J$/\psi$ and $\psi$(2S) contributions are shown as red and yellow shaded areas, respectively. Finally the background is depicted as a dashed gray line. The inset shows the region of the $\psi$(2S) mass. |  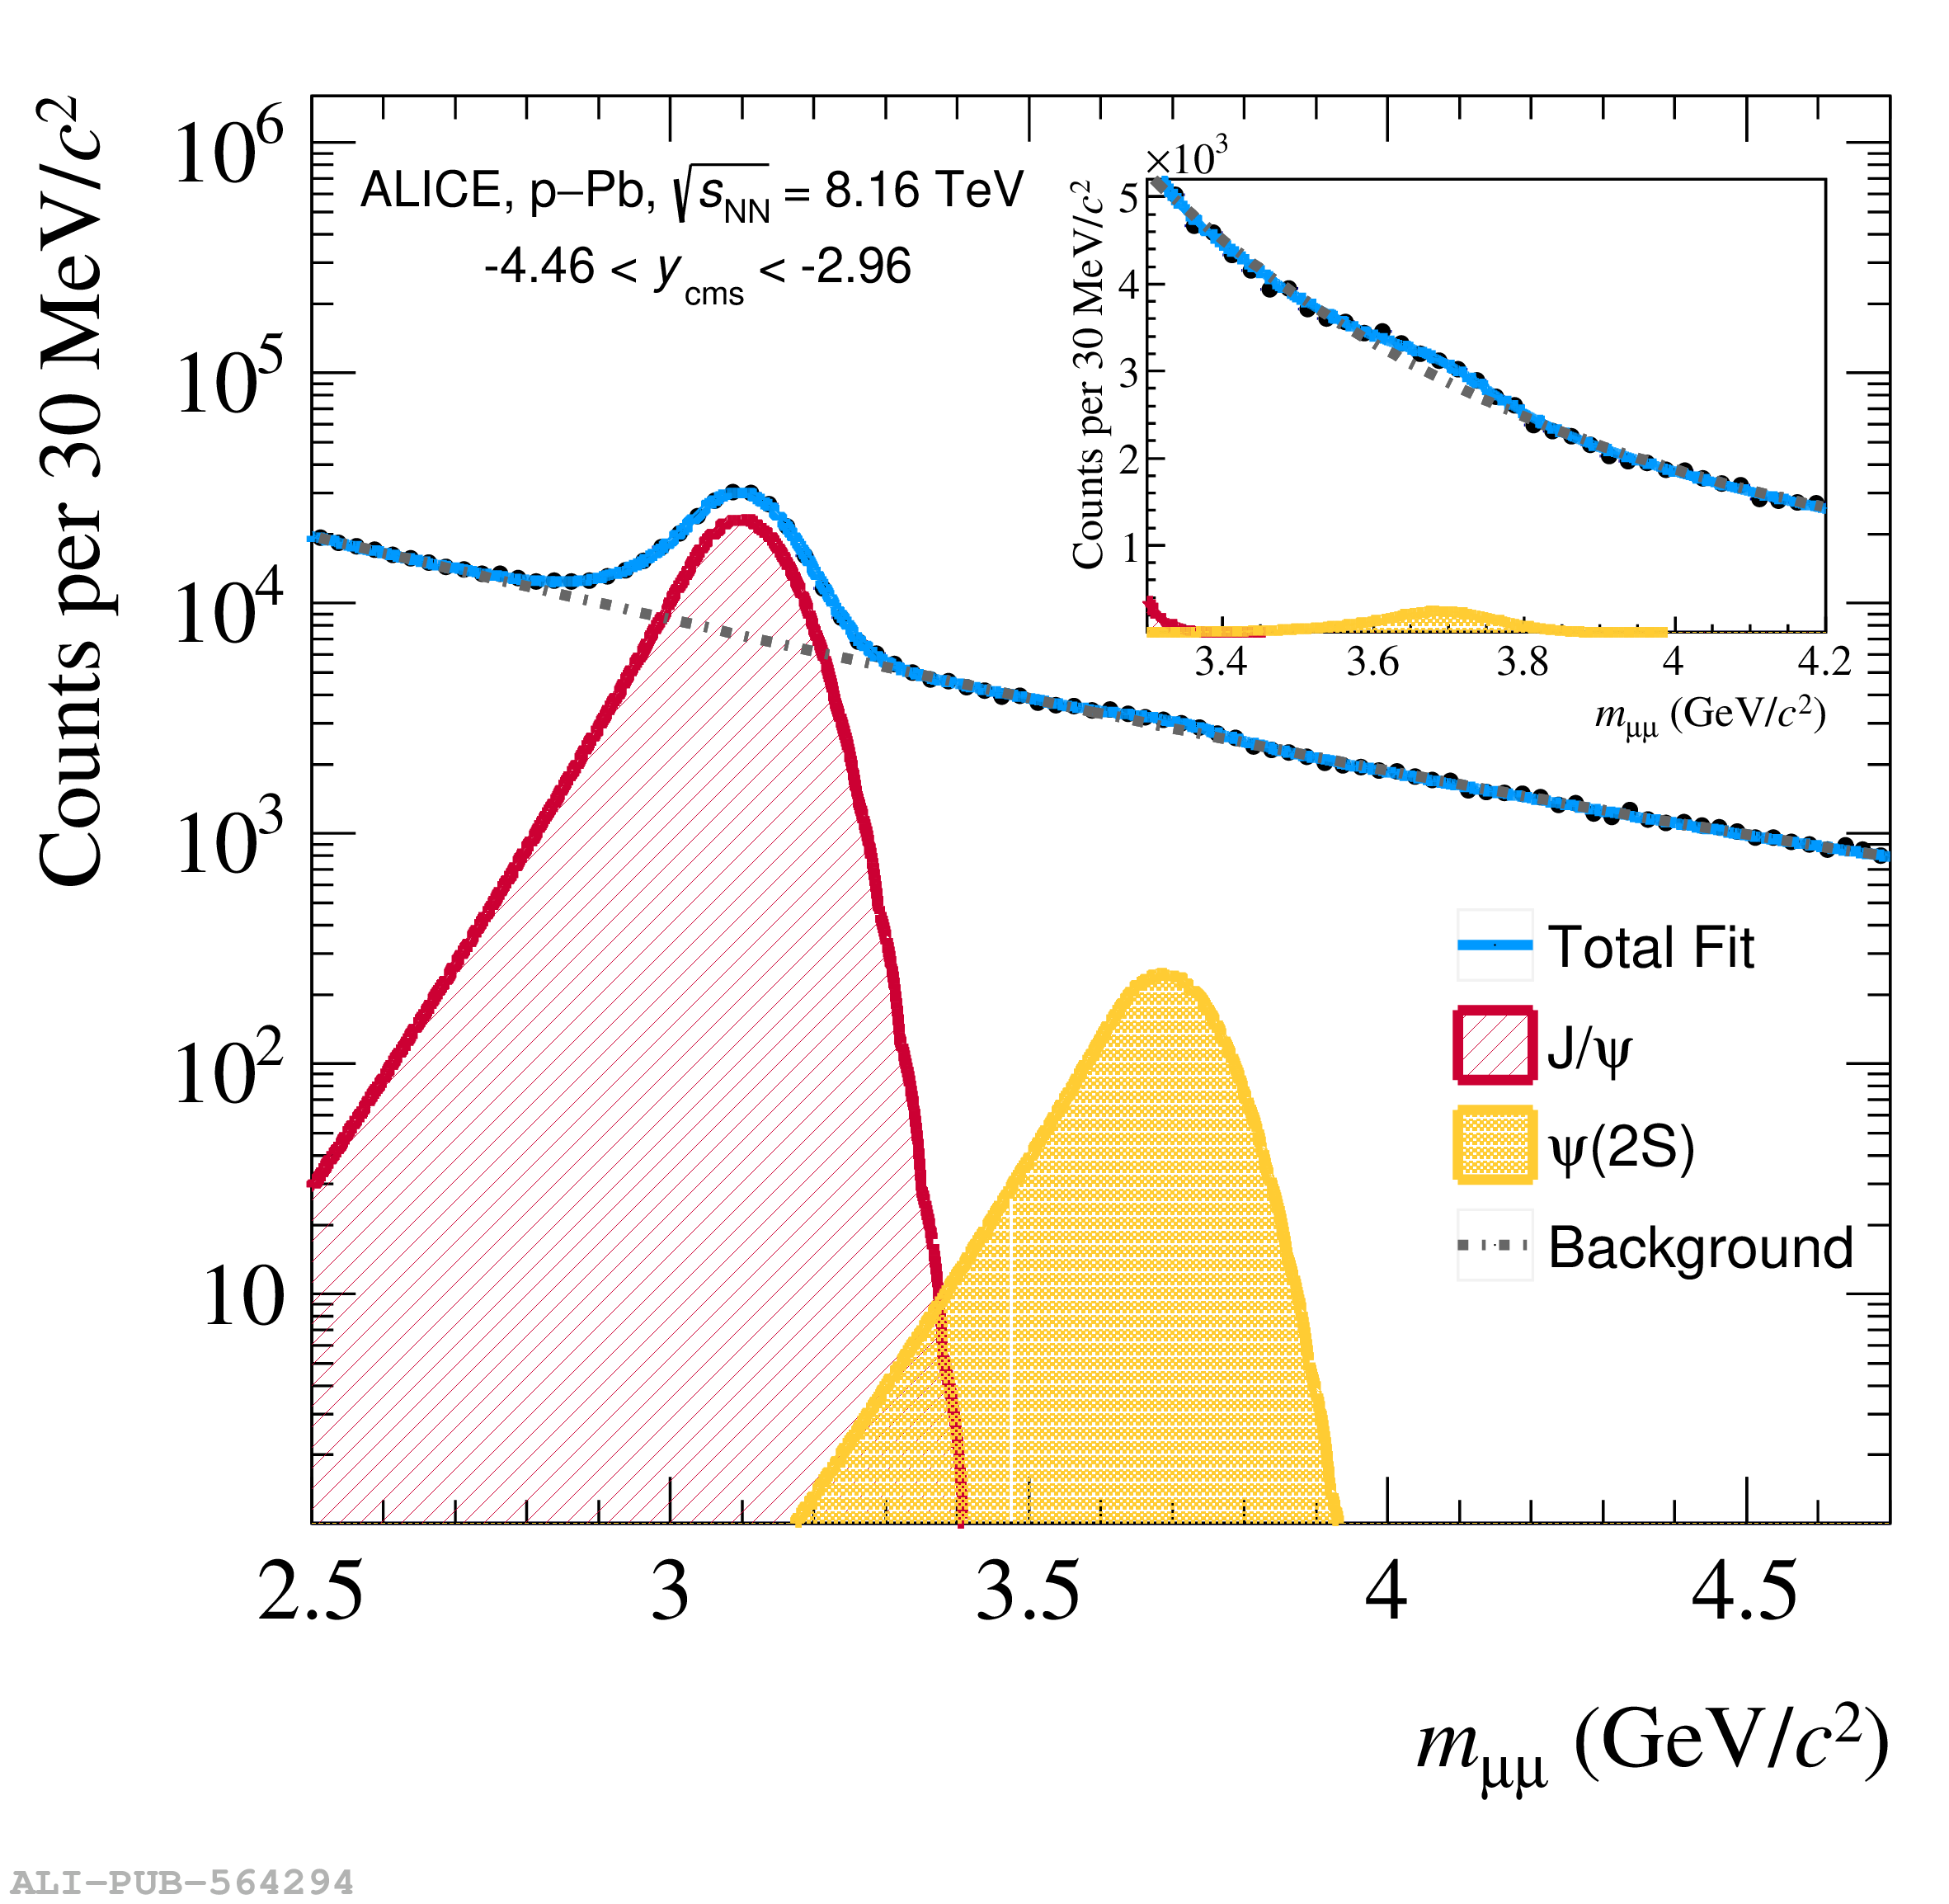 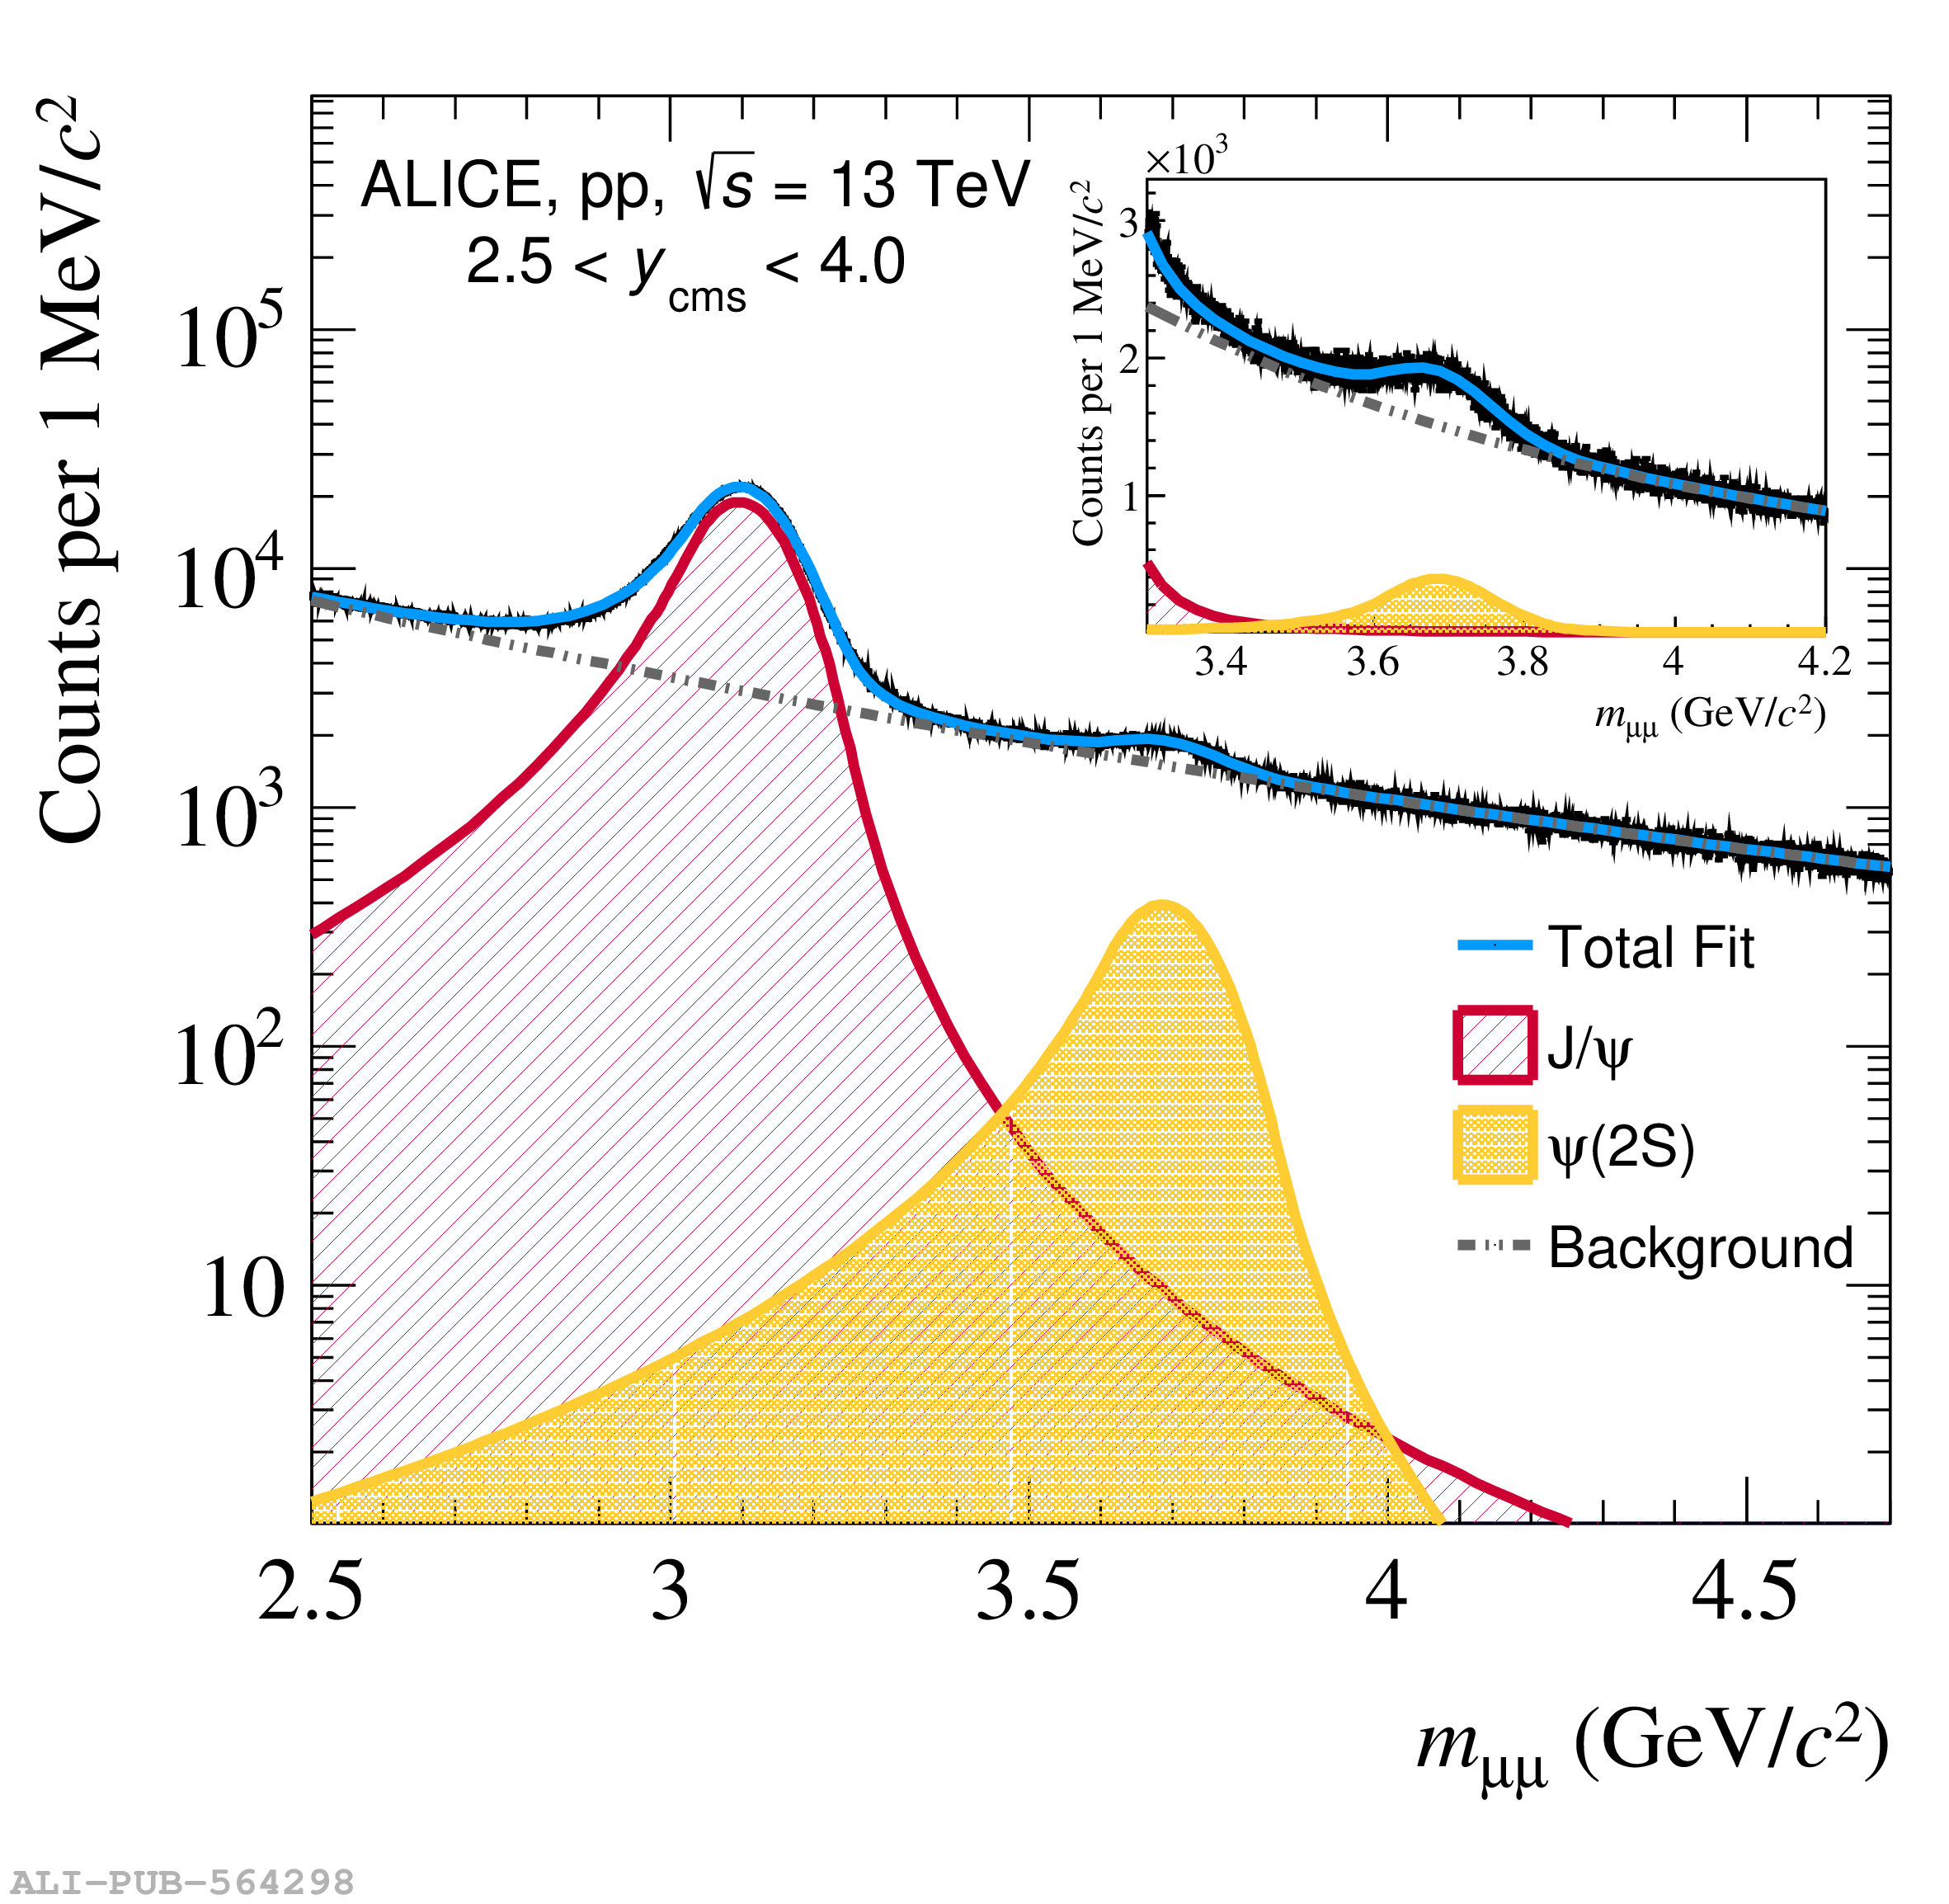 |