The pion raw experimental distribution of the azimuthal angle difference $\Delta\varphi$ between the trigger and the associated particles for $S_{\rm T}> 0.7$ (red circles), $S_{\rm T}< 0.3$ (blue squares) and $S_{\rm T}$ (0,1) (green stars) compared with MC PYTHIA 8 calculations shown with the corresponding open markers. The calculations include particle transport through the ALICE detector using the GEANT 3 transport package. The statistical uncertainties are smaller than the marker size. | 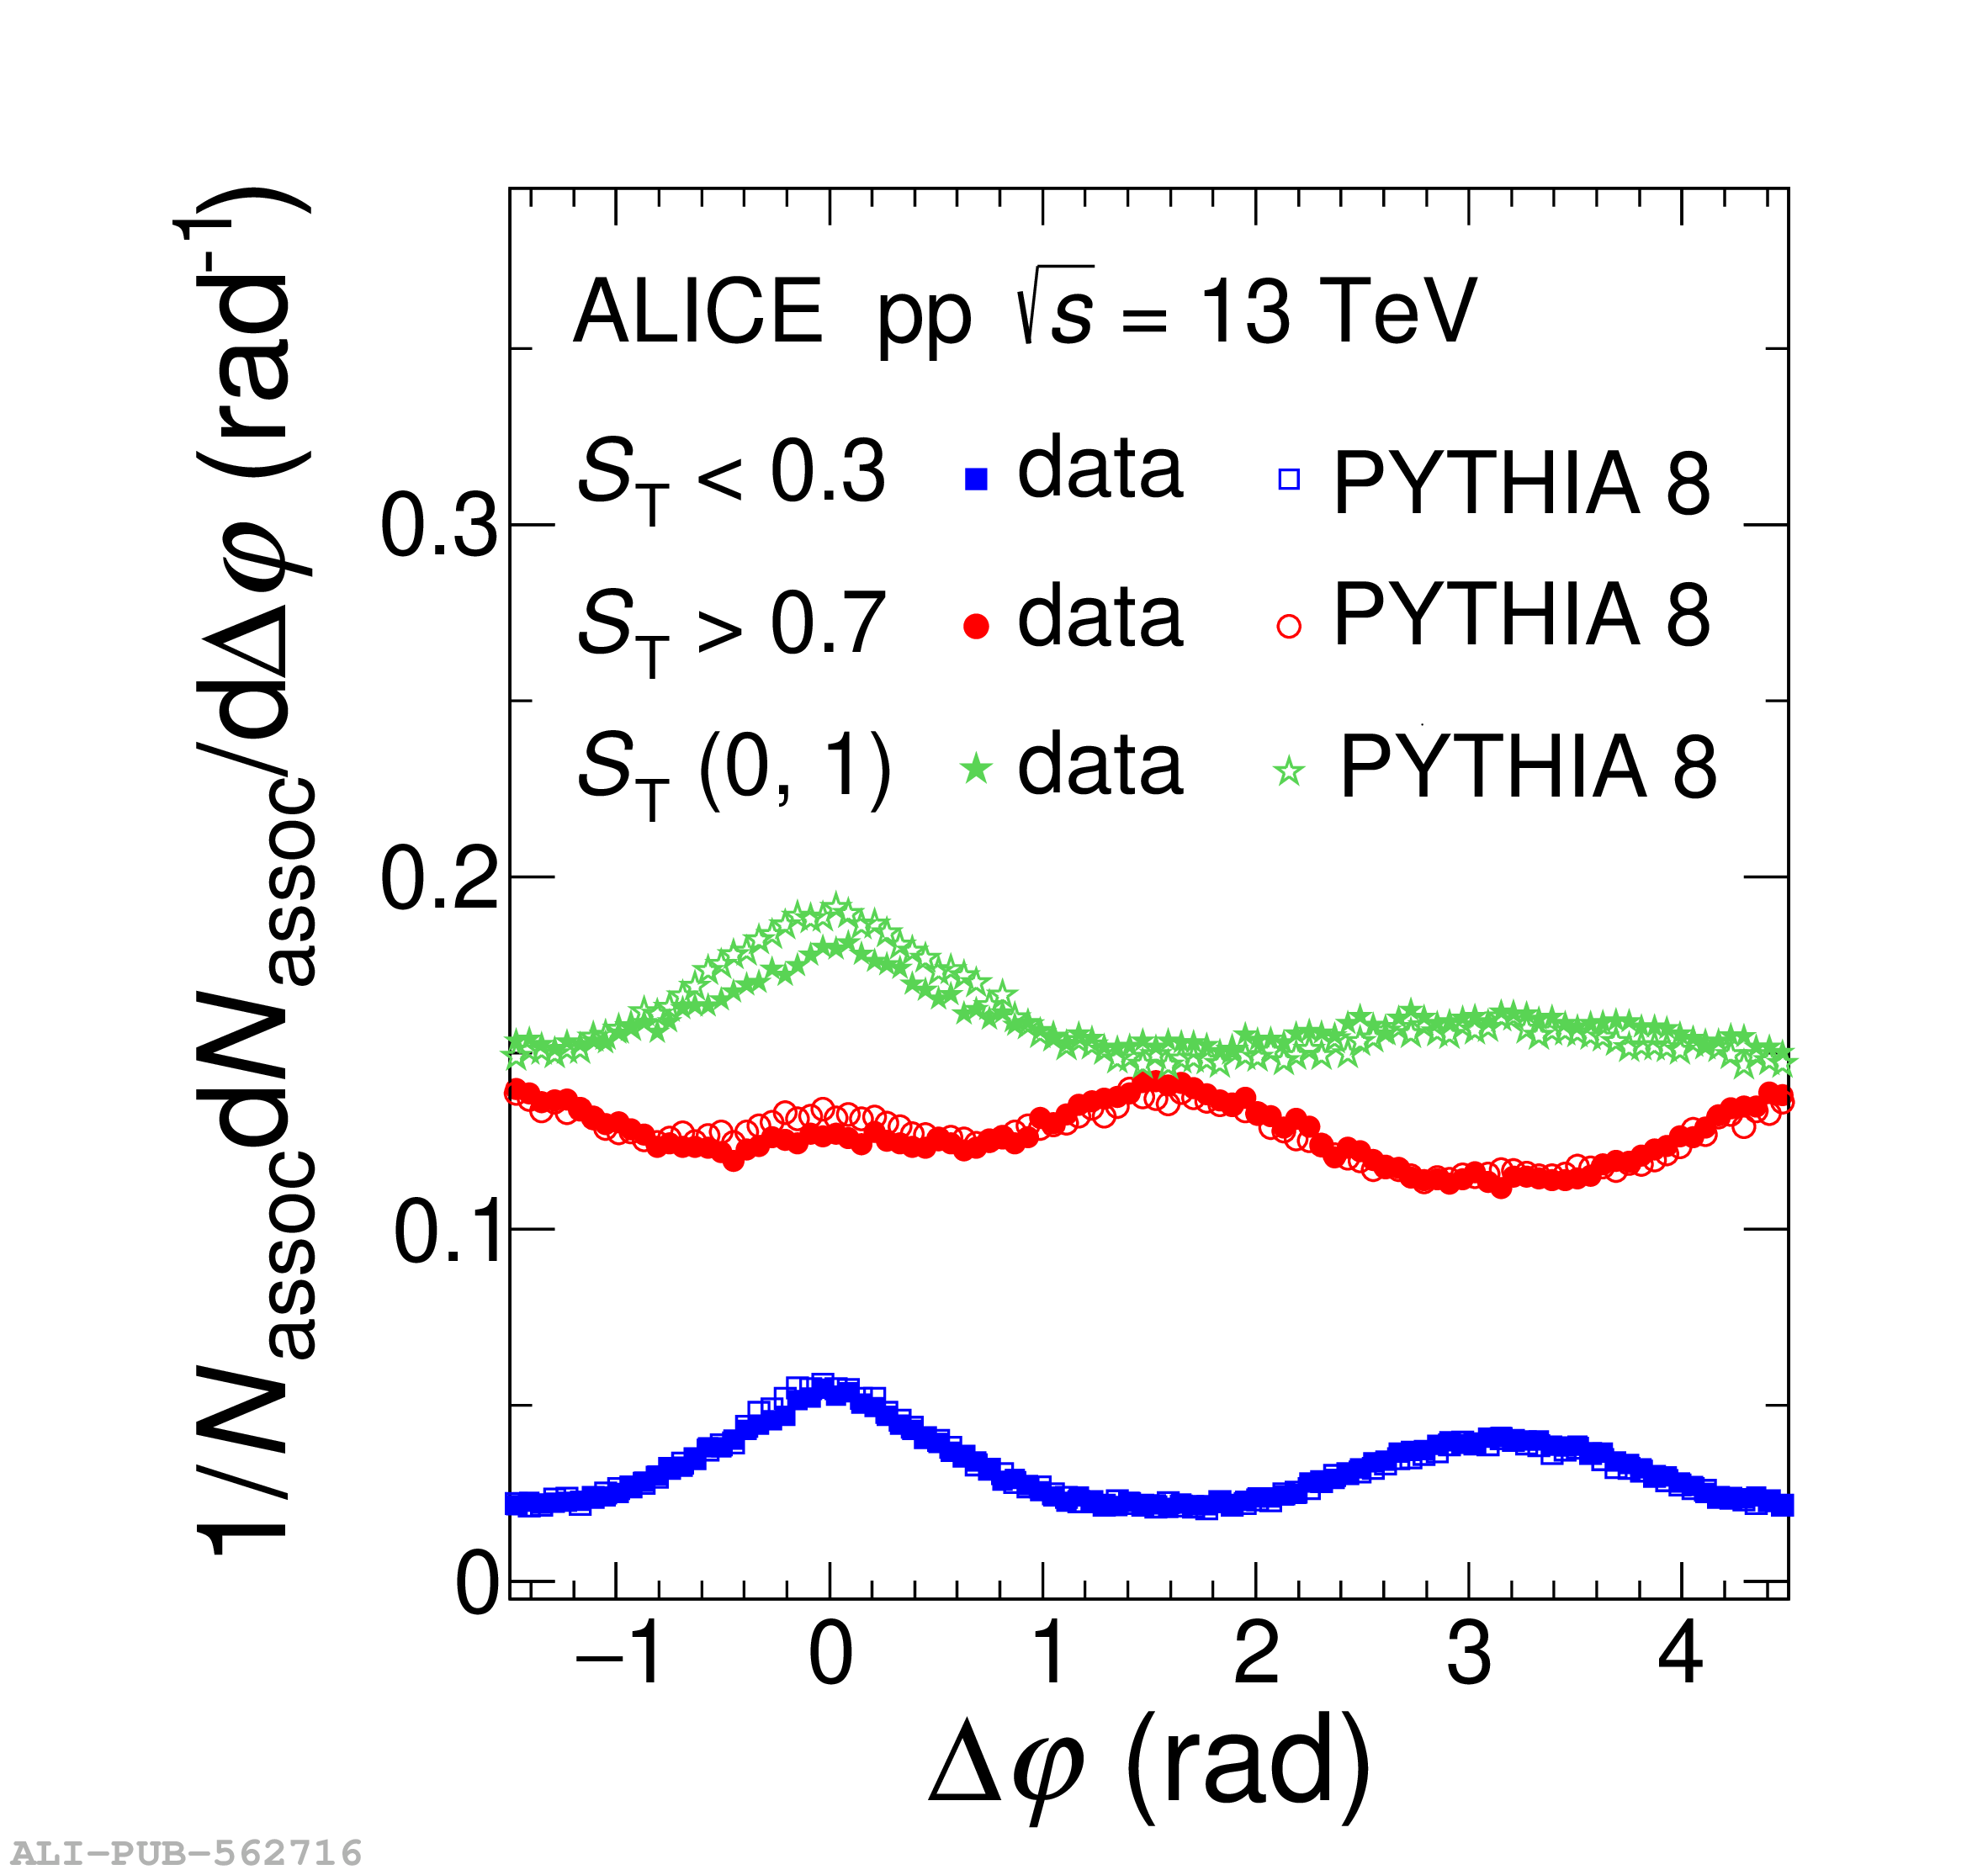 |