Experimental \LXi\ correlation function with statistical (vertical black lines) and systematic (gray boxes) uncertainties. The square brackets show the bin width of the measurement and the horizontal black lines represent the statistical uncertainty in the determination of the mean \kstar\ for each bin. Left panel: Comparison to LO and NLO \chEFT\ and NSC97a potentials evaluated with the Lednický--Lyuboshits model . In the $\chi$EFT models the darker and light bands correspond to the version with the lower and higher cut-off value, respectively. Right panel: Comparison with Lattice QCD calculations by the HAL QCD Collaboration using an effective potential including the coupling to $\Sigma$--$\Xi$ (orange) and the \LXi\ elastic potential alone (red). The width of the bands in both panels correspond to the systematic uncertainties of the fit as described in the text. The dotted black line represents the result of the baseline fit assuming no \LXi\ strong interaction. | 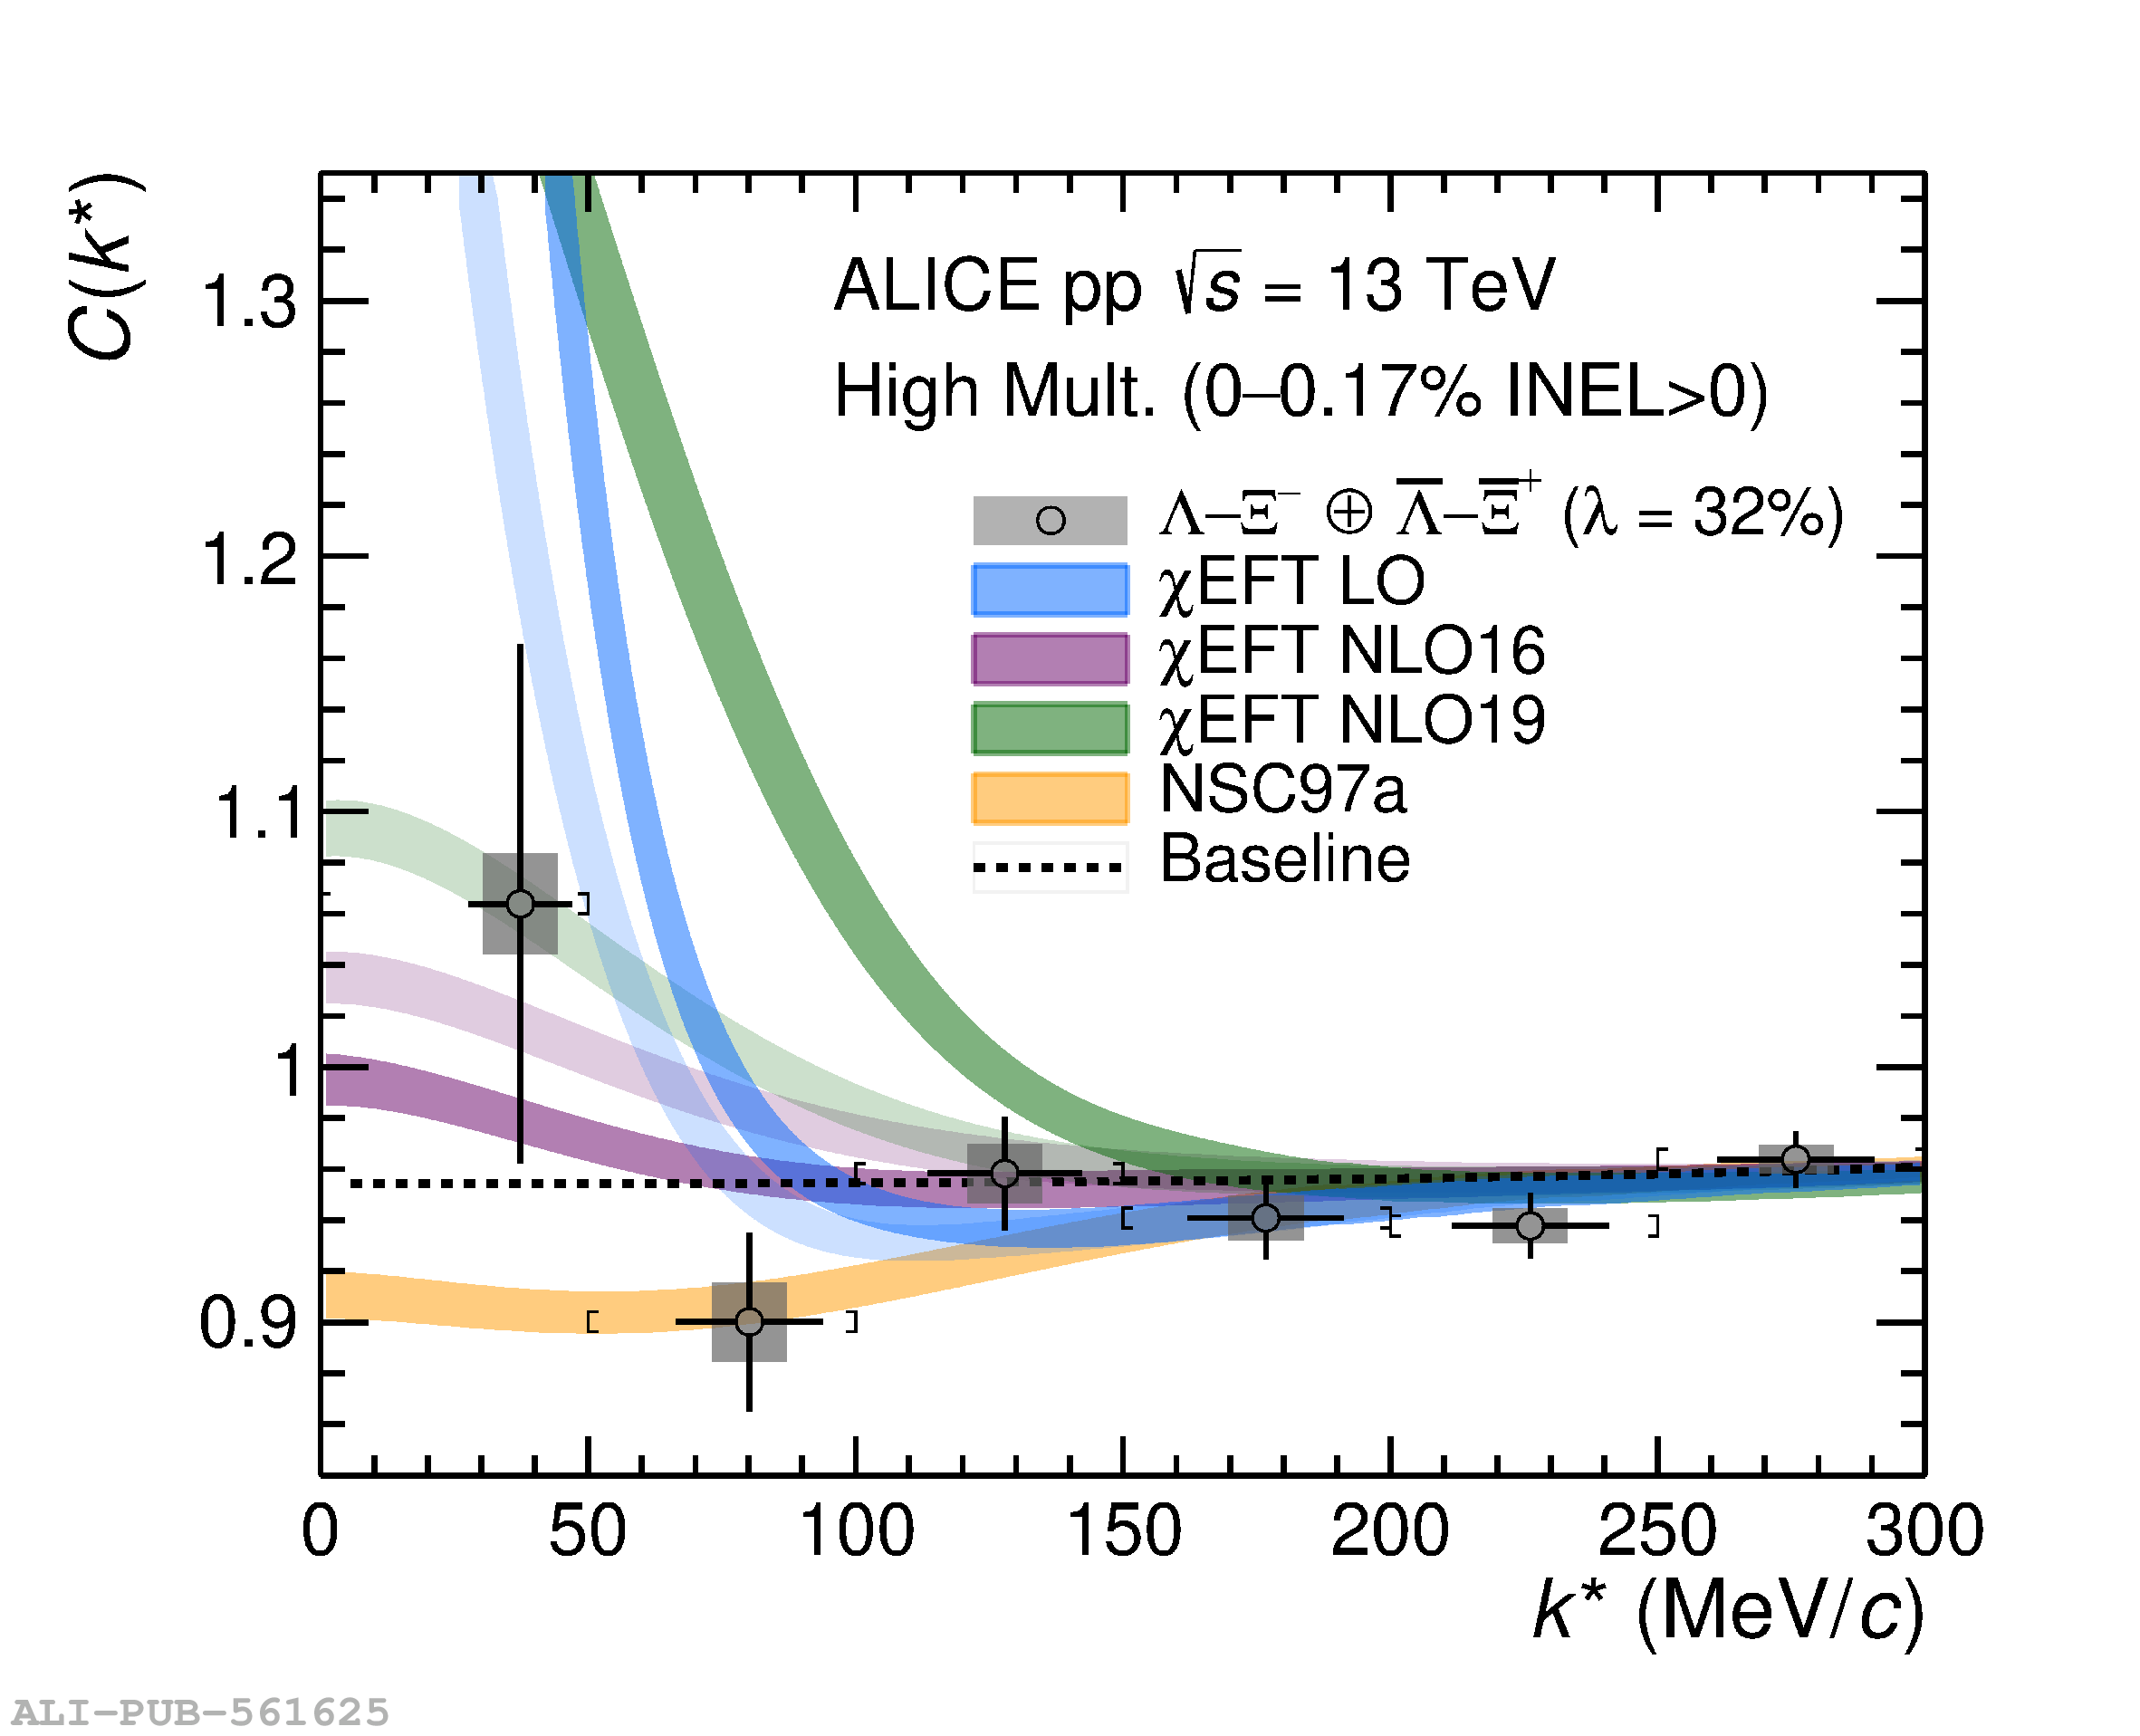 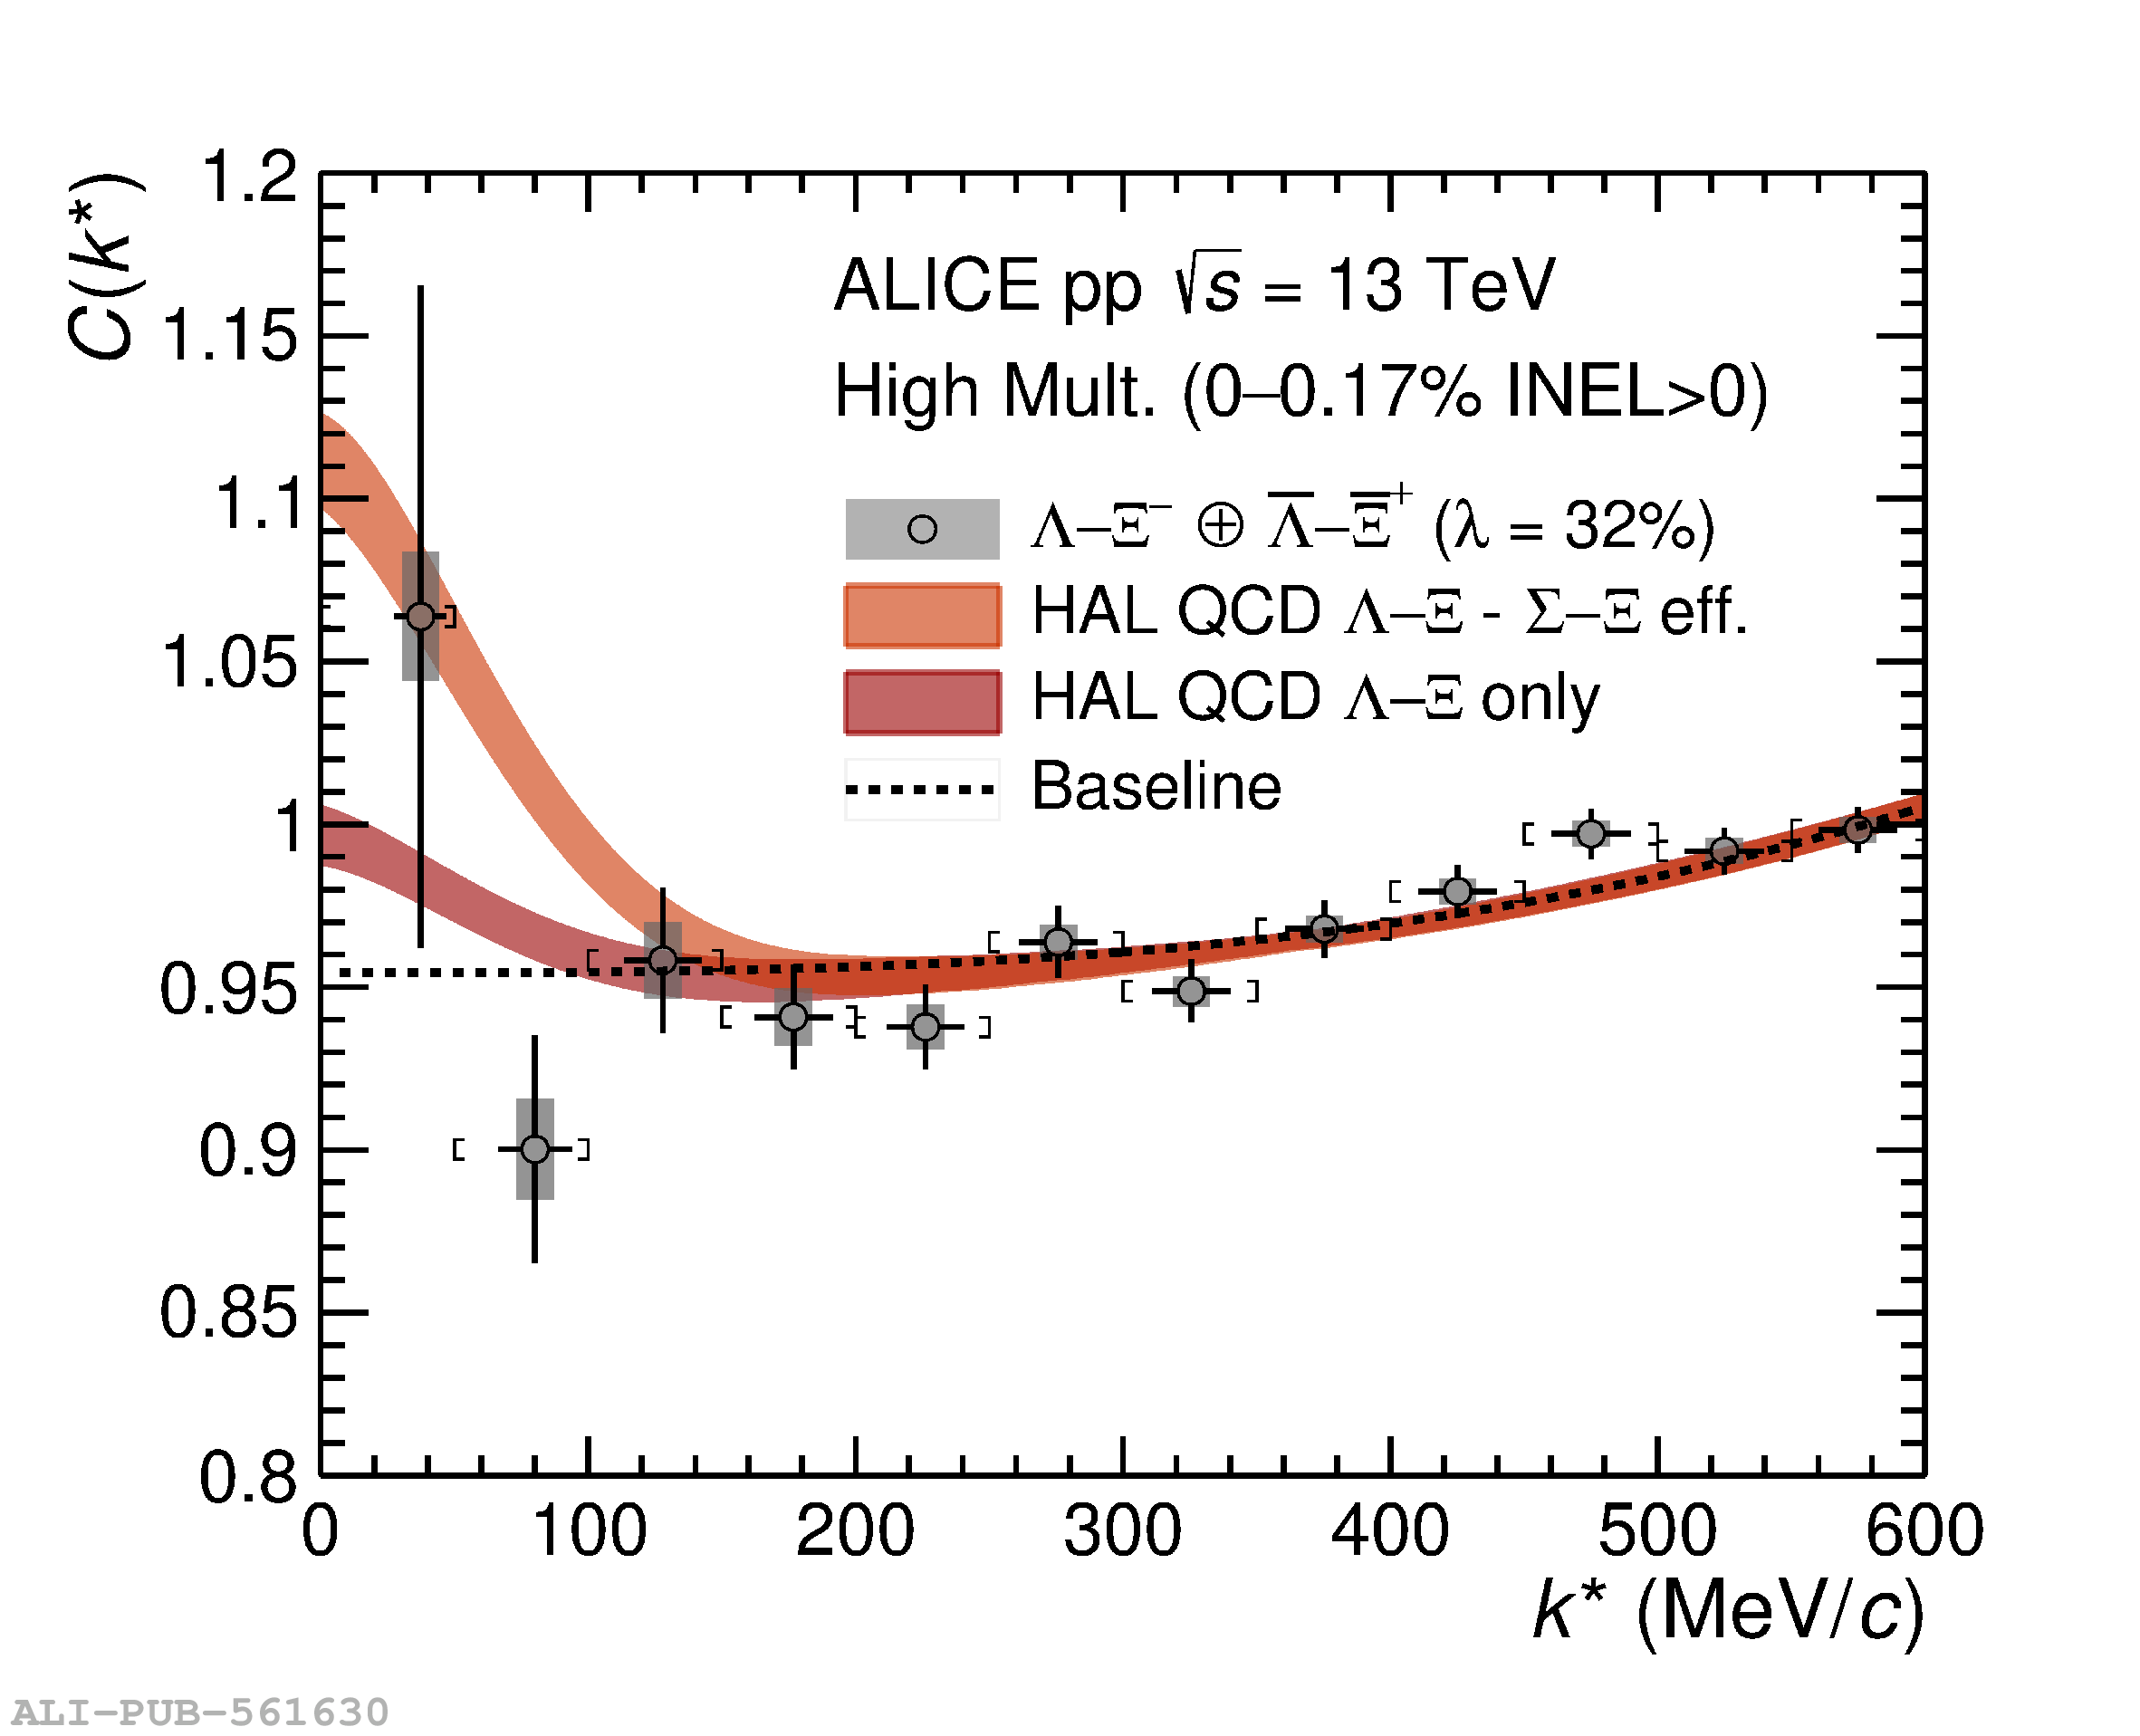 |