Left: Radial distance from the \gls{IP} of photon conversions in the detector material for different detector configurations in 2010, 2012 and 2015-2018. The distributions are obtained for \gls{PYTHIA}8 simulations and only for photons whose conversion products were reconstructed as clusters in \gls{EMCal} and formed, when paired with another cluster, a signal in the $\pi^0$ invariant mass window. For 2011 the same number of super modules was installed as in 2012 - 2013, but two fewer modules had the \gls{TRD} installed in front of them Right: Neutral pion invariant mass peak position as a function of \pT\ for different magnetic field configurations for \pp\ collisions at \sthirteen. Invariant mass distribution of reconstructed $\pi^0$ mesons in \gls{MC} simulations. Contributions from pure photon pairs as well as from clusters which contain converted photon contributions are shown separately for $B = 0.5$ T (left), $B = 0.2$ T (middle) and $B = 0$ T (right) for pp collisions at \sthirteen. | 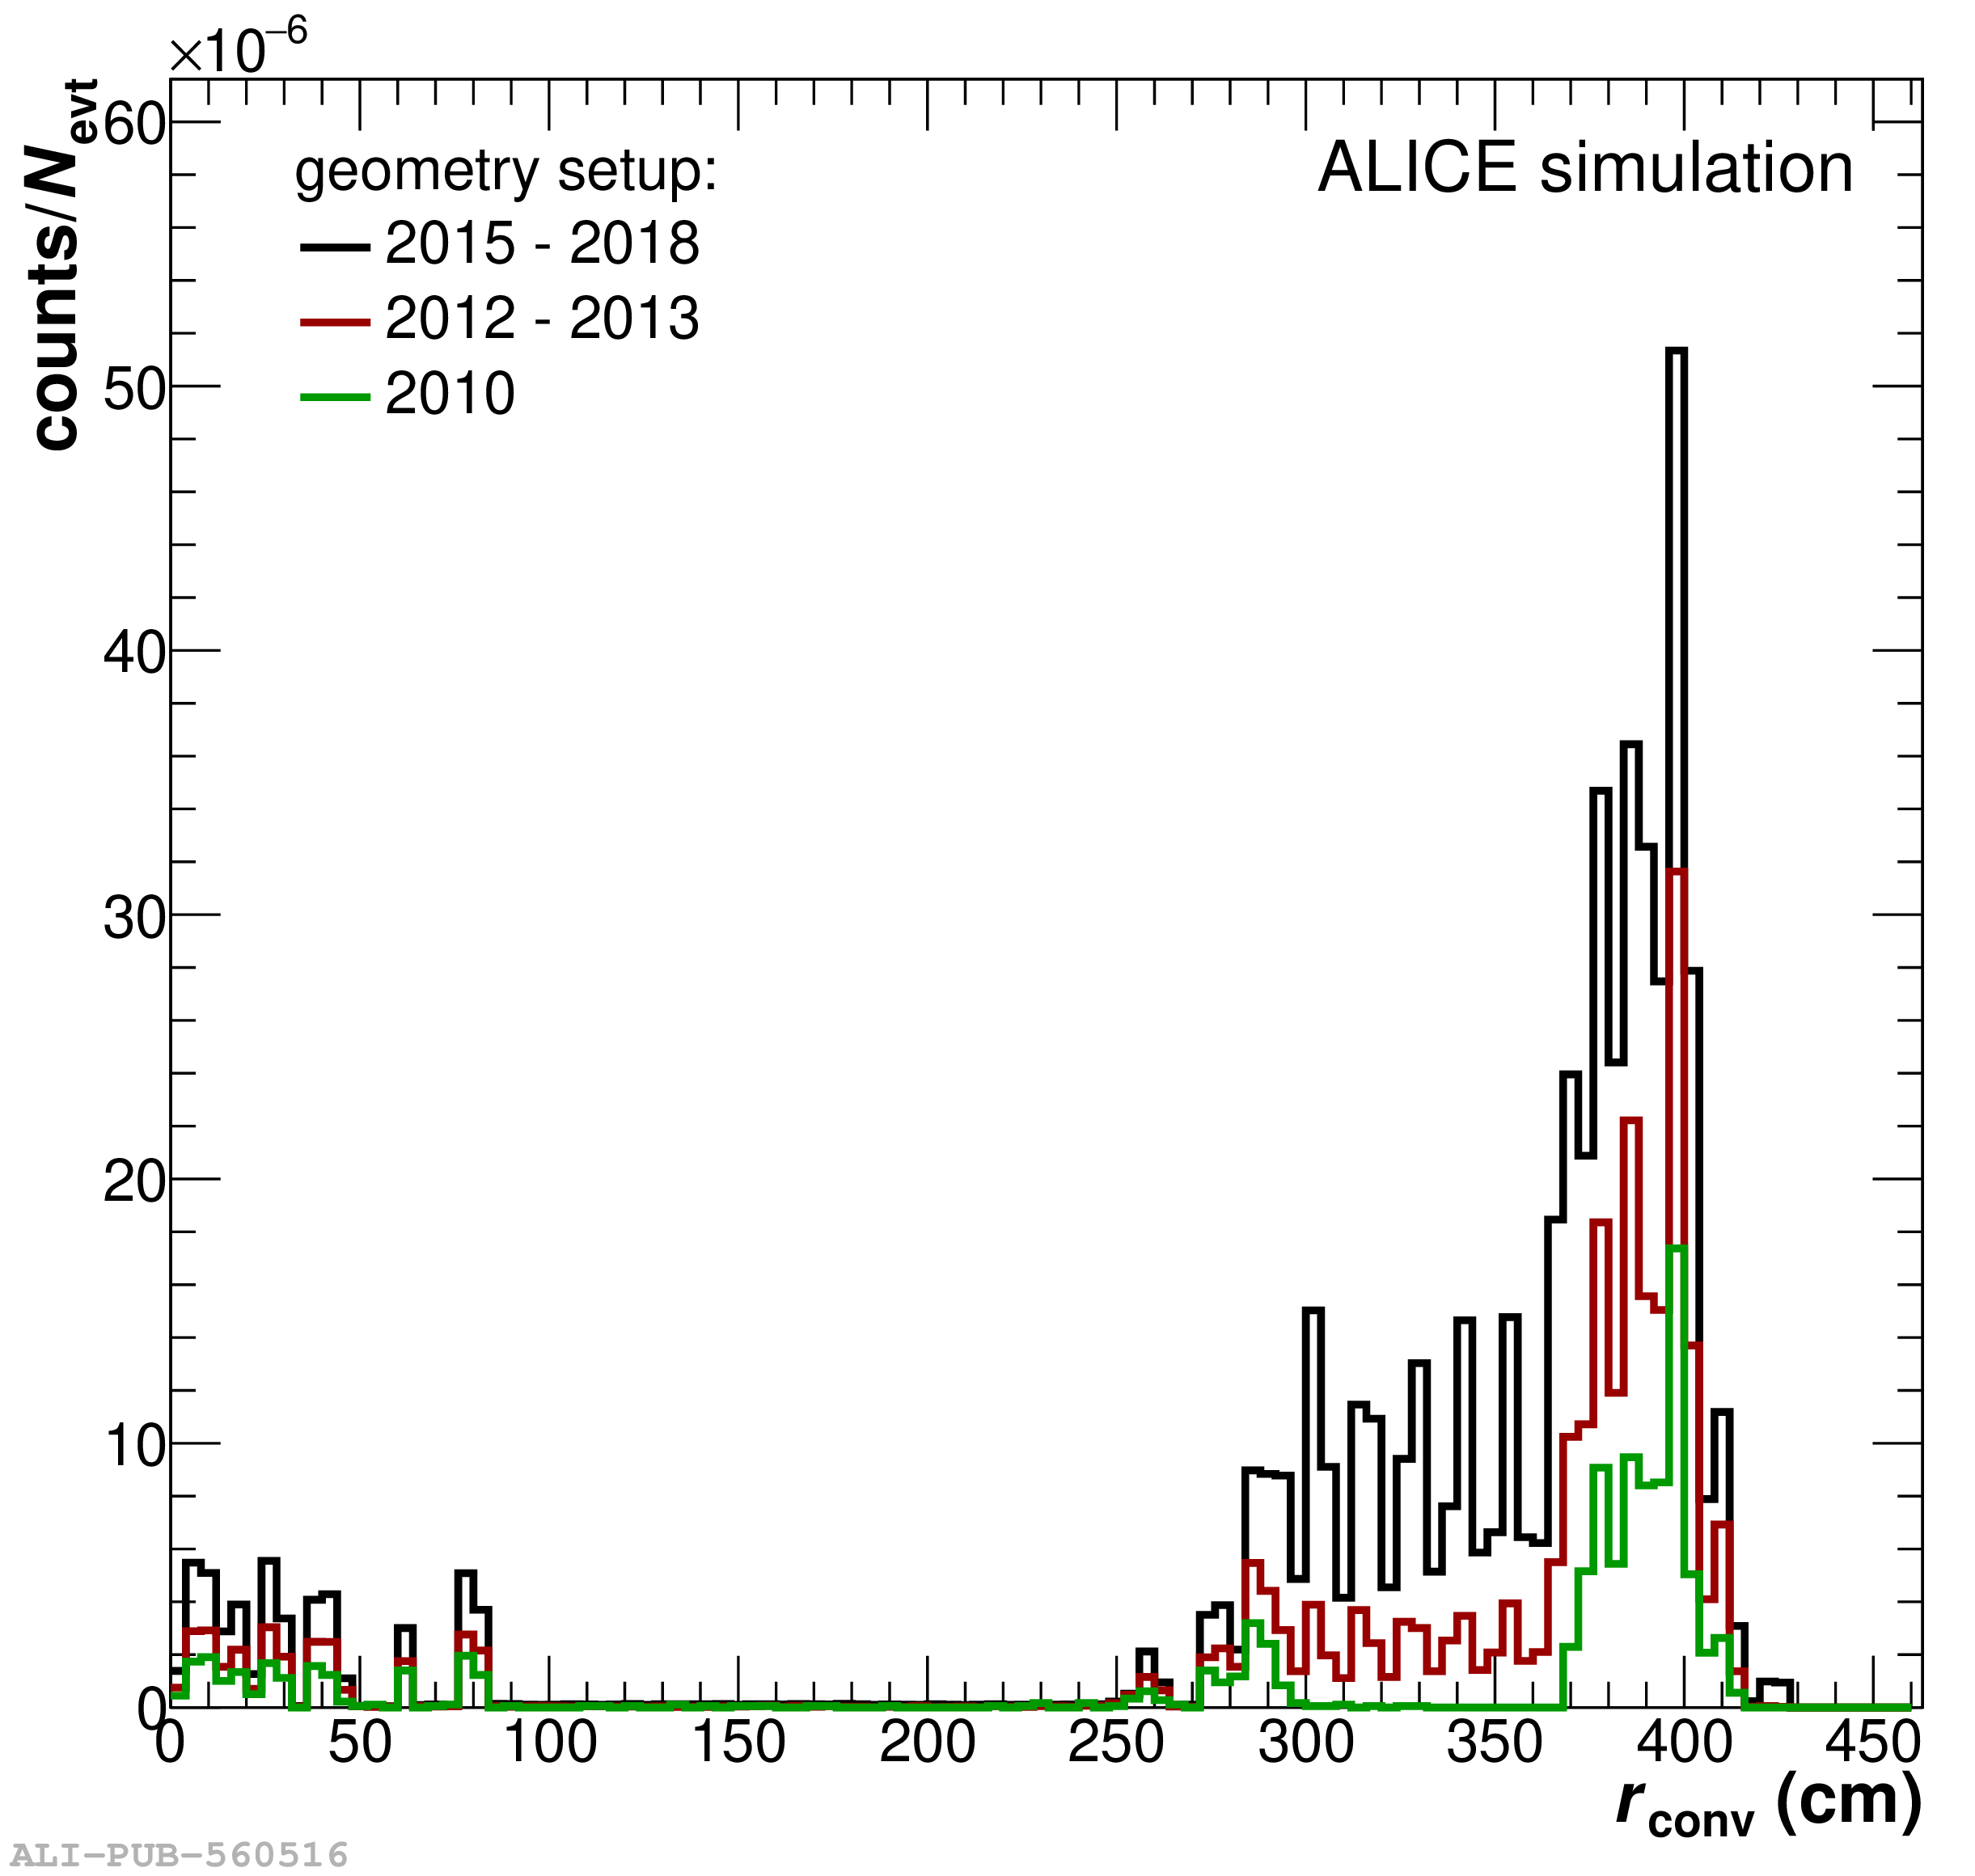 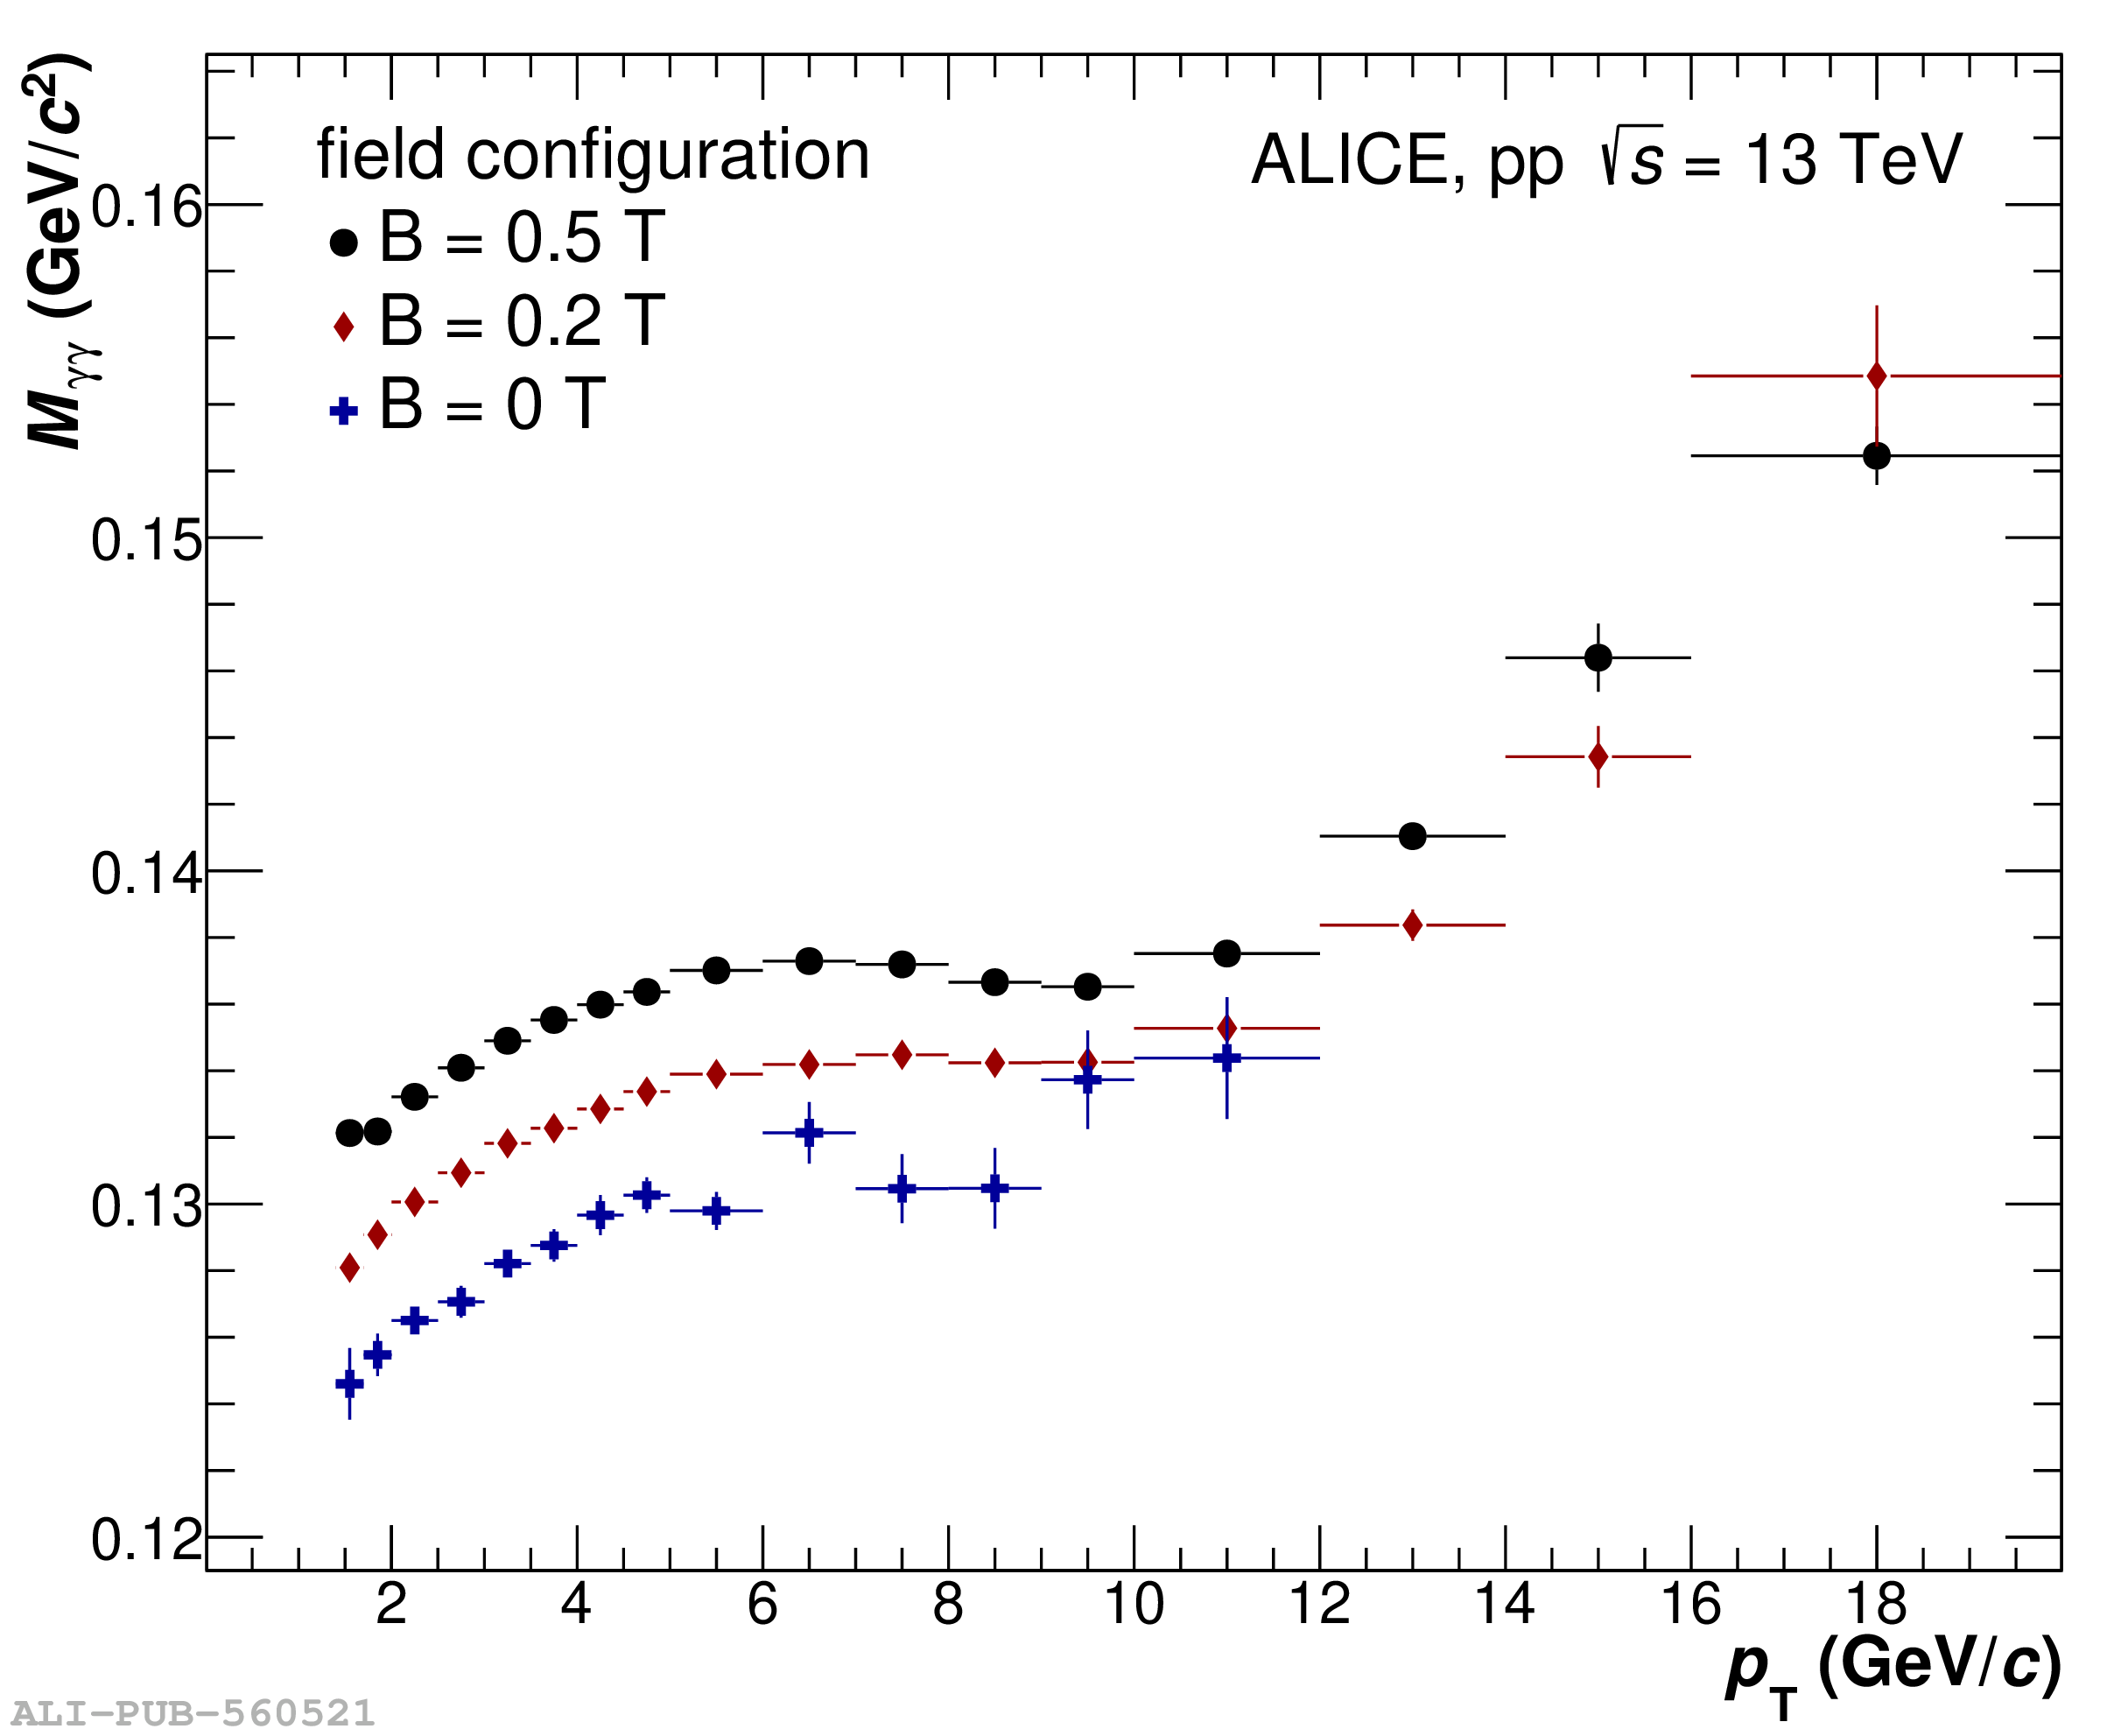 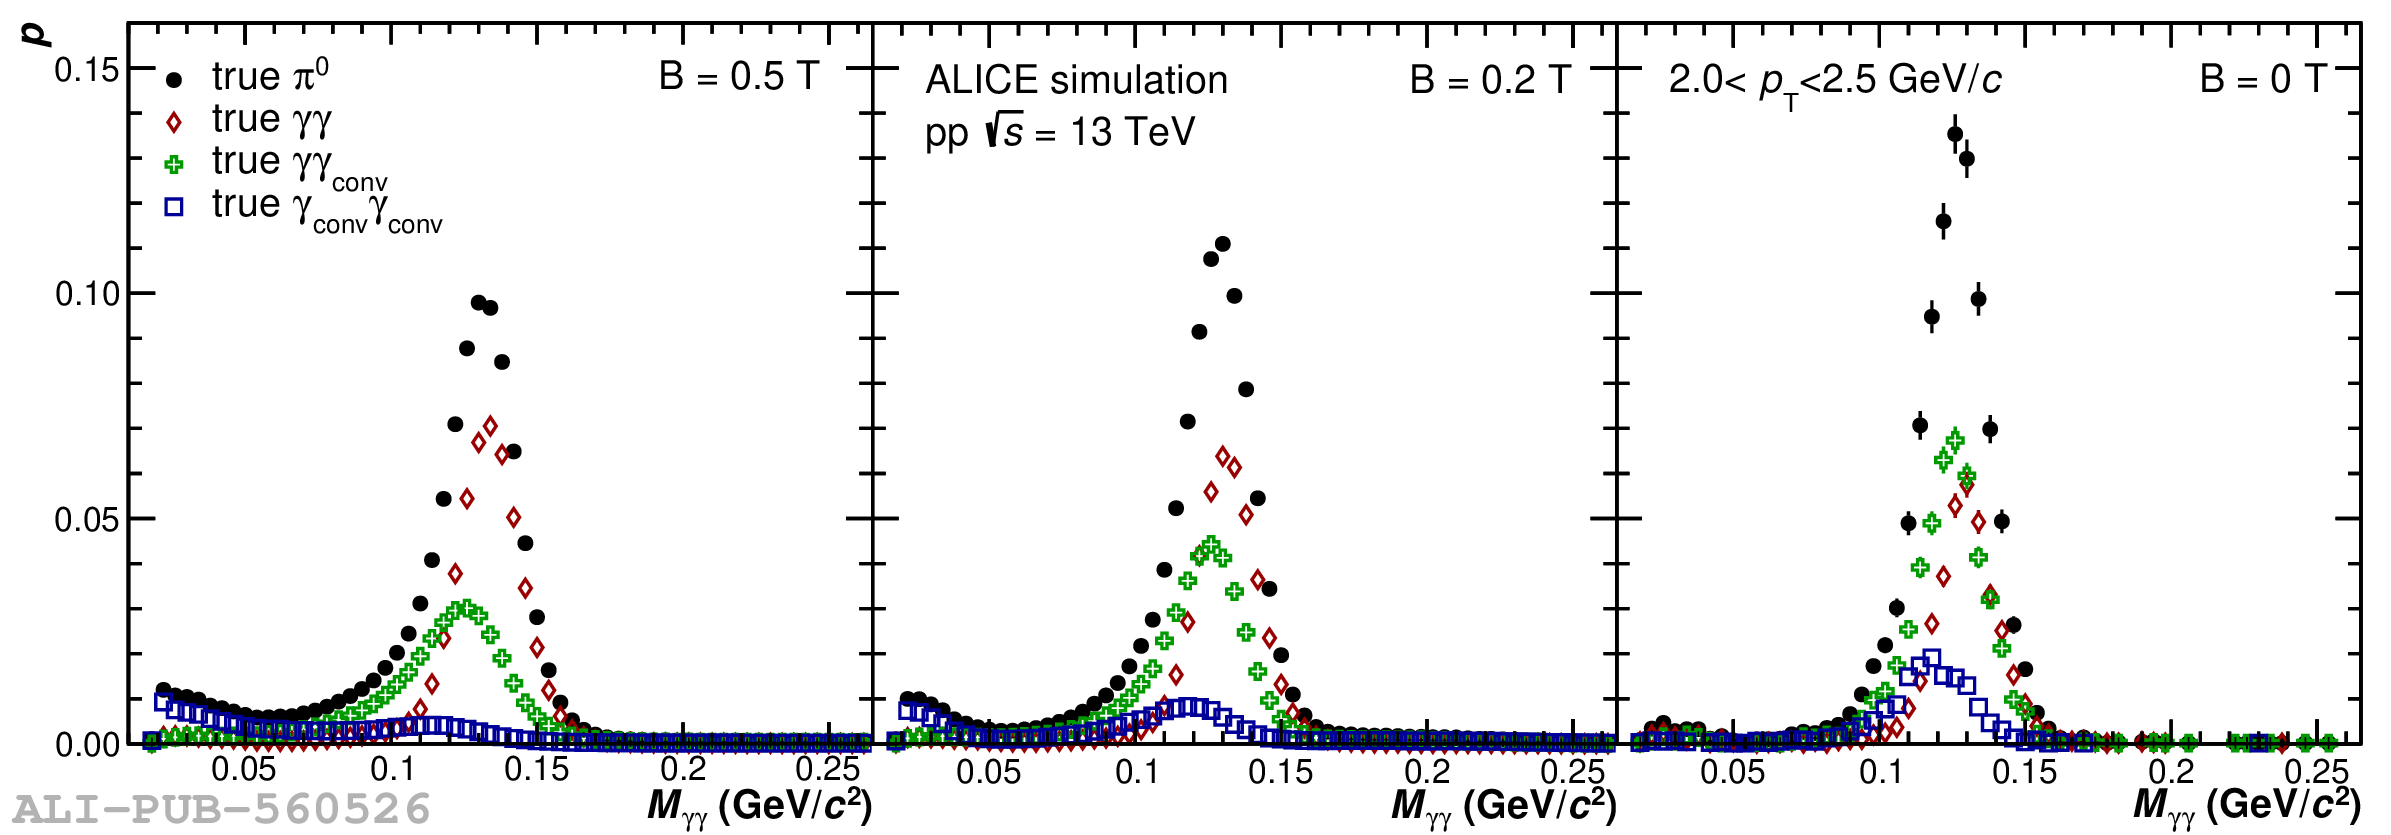 |