Left: Distribution of the number of \piz\ mesons collected in an ideal calorimeter (black). The respective contributions of the 10 \gls{EMCal}, 6 2/3-sized \gls{DCal} and 4 1/3-sized \glspl{SM} are displayed in different colors (see \Sec{sec:hardware-supermoduledesign}) Right: Distributions of the smeared \piz\ meson masses normalized by $M_{\piz}^{\rm PDG}$, when only the statistical uncertainty is applied (closed symbols), and when also the uncertainty due to the fit range is applied (opened symbols). |  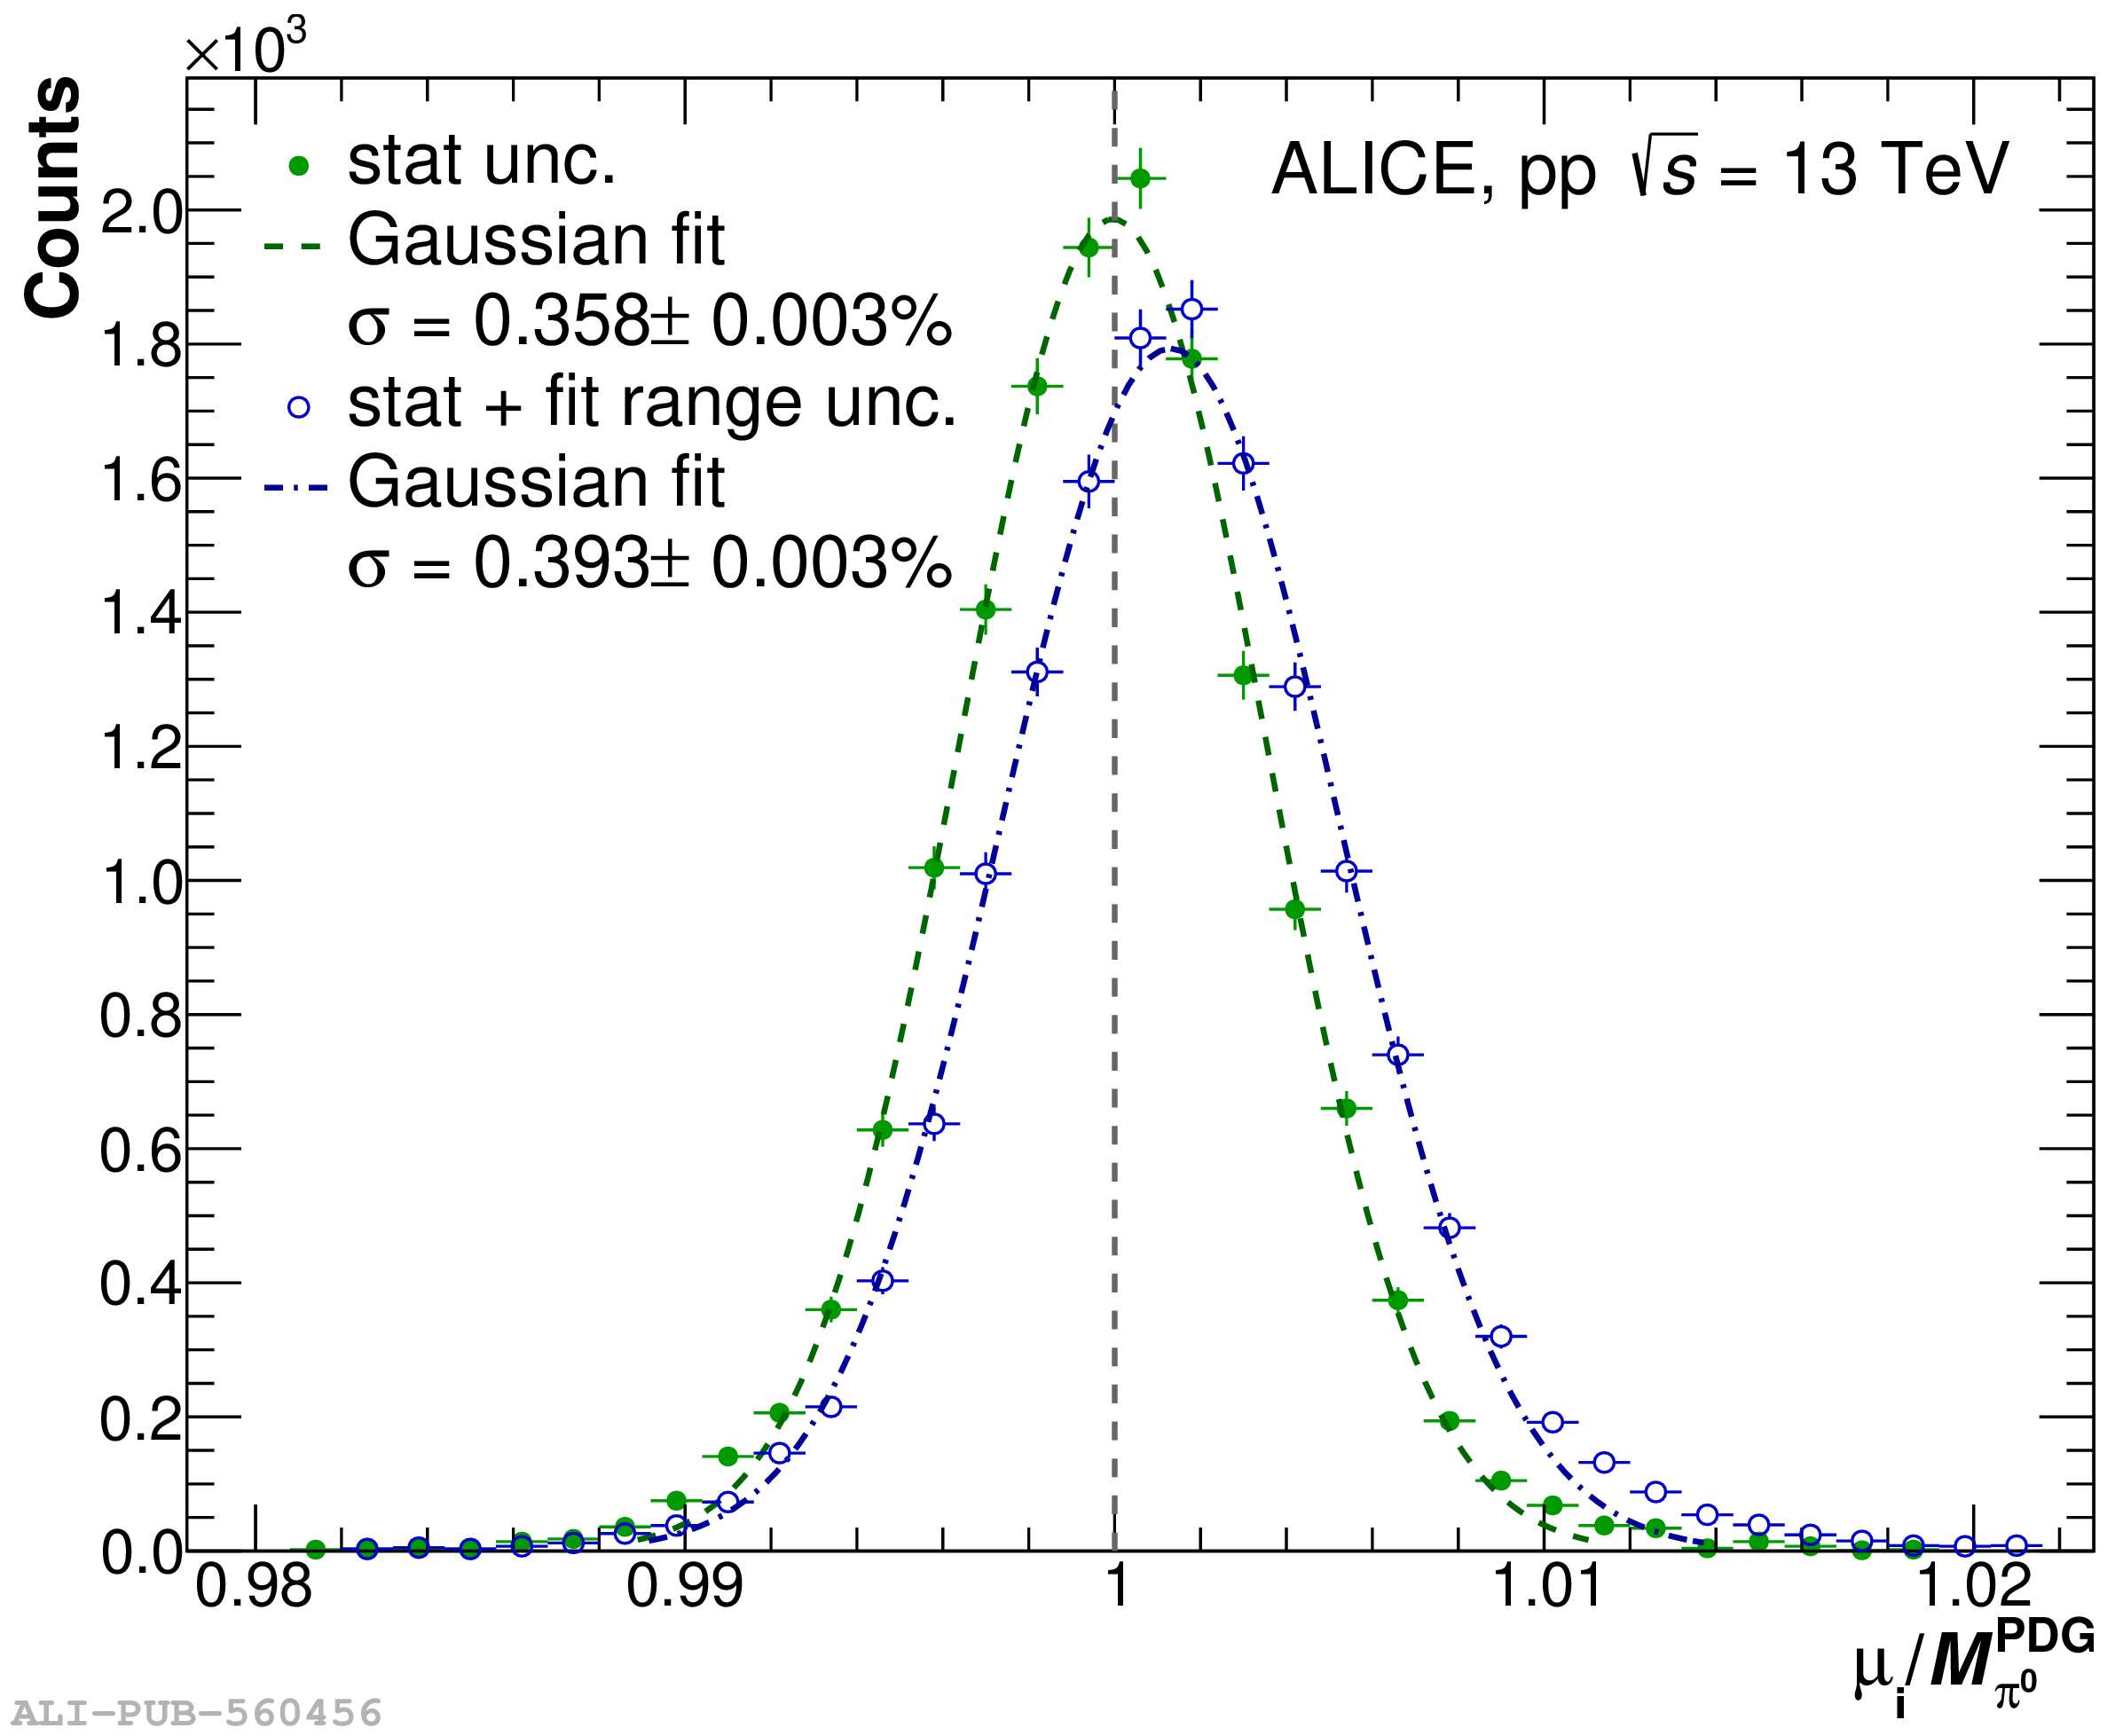 |