Mean number of clusters per event as a function of the run index for \pp{} collisions at \sthirteen{}. Example runs with similar data taking conditions are displayed Only clusters with energy above 0.5 GeV were used for the mean estimation. The gray vertical lines correspond to the start of different data-taking years. Mean number of cells per cluster (left) and mean cluster energy (right) for a selection of \glspl{SM} as a function of the run index in \pp{} collisions at \sthirteen{}. Example runs with similar data taking conditions are displayed. Only clusters with energy above 0.5 GeV were used for the mean estimation. The vertical red line indicates the run at which the 2 last \gls{DCal} \glspl{SM} were inserted into the readout. The vertical gray lines correspond to the start of different data-taking years. | 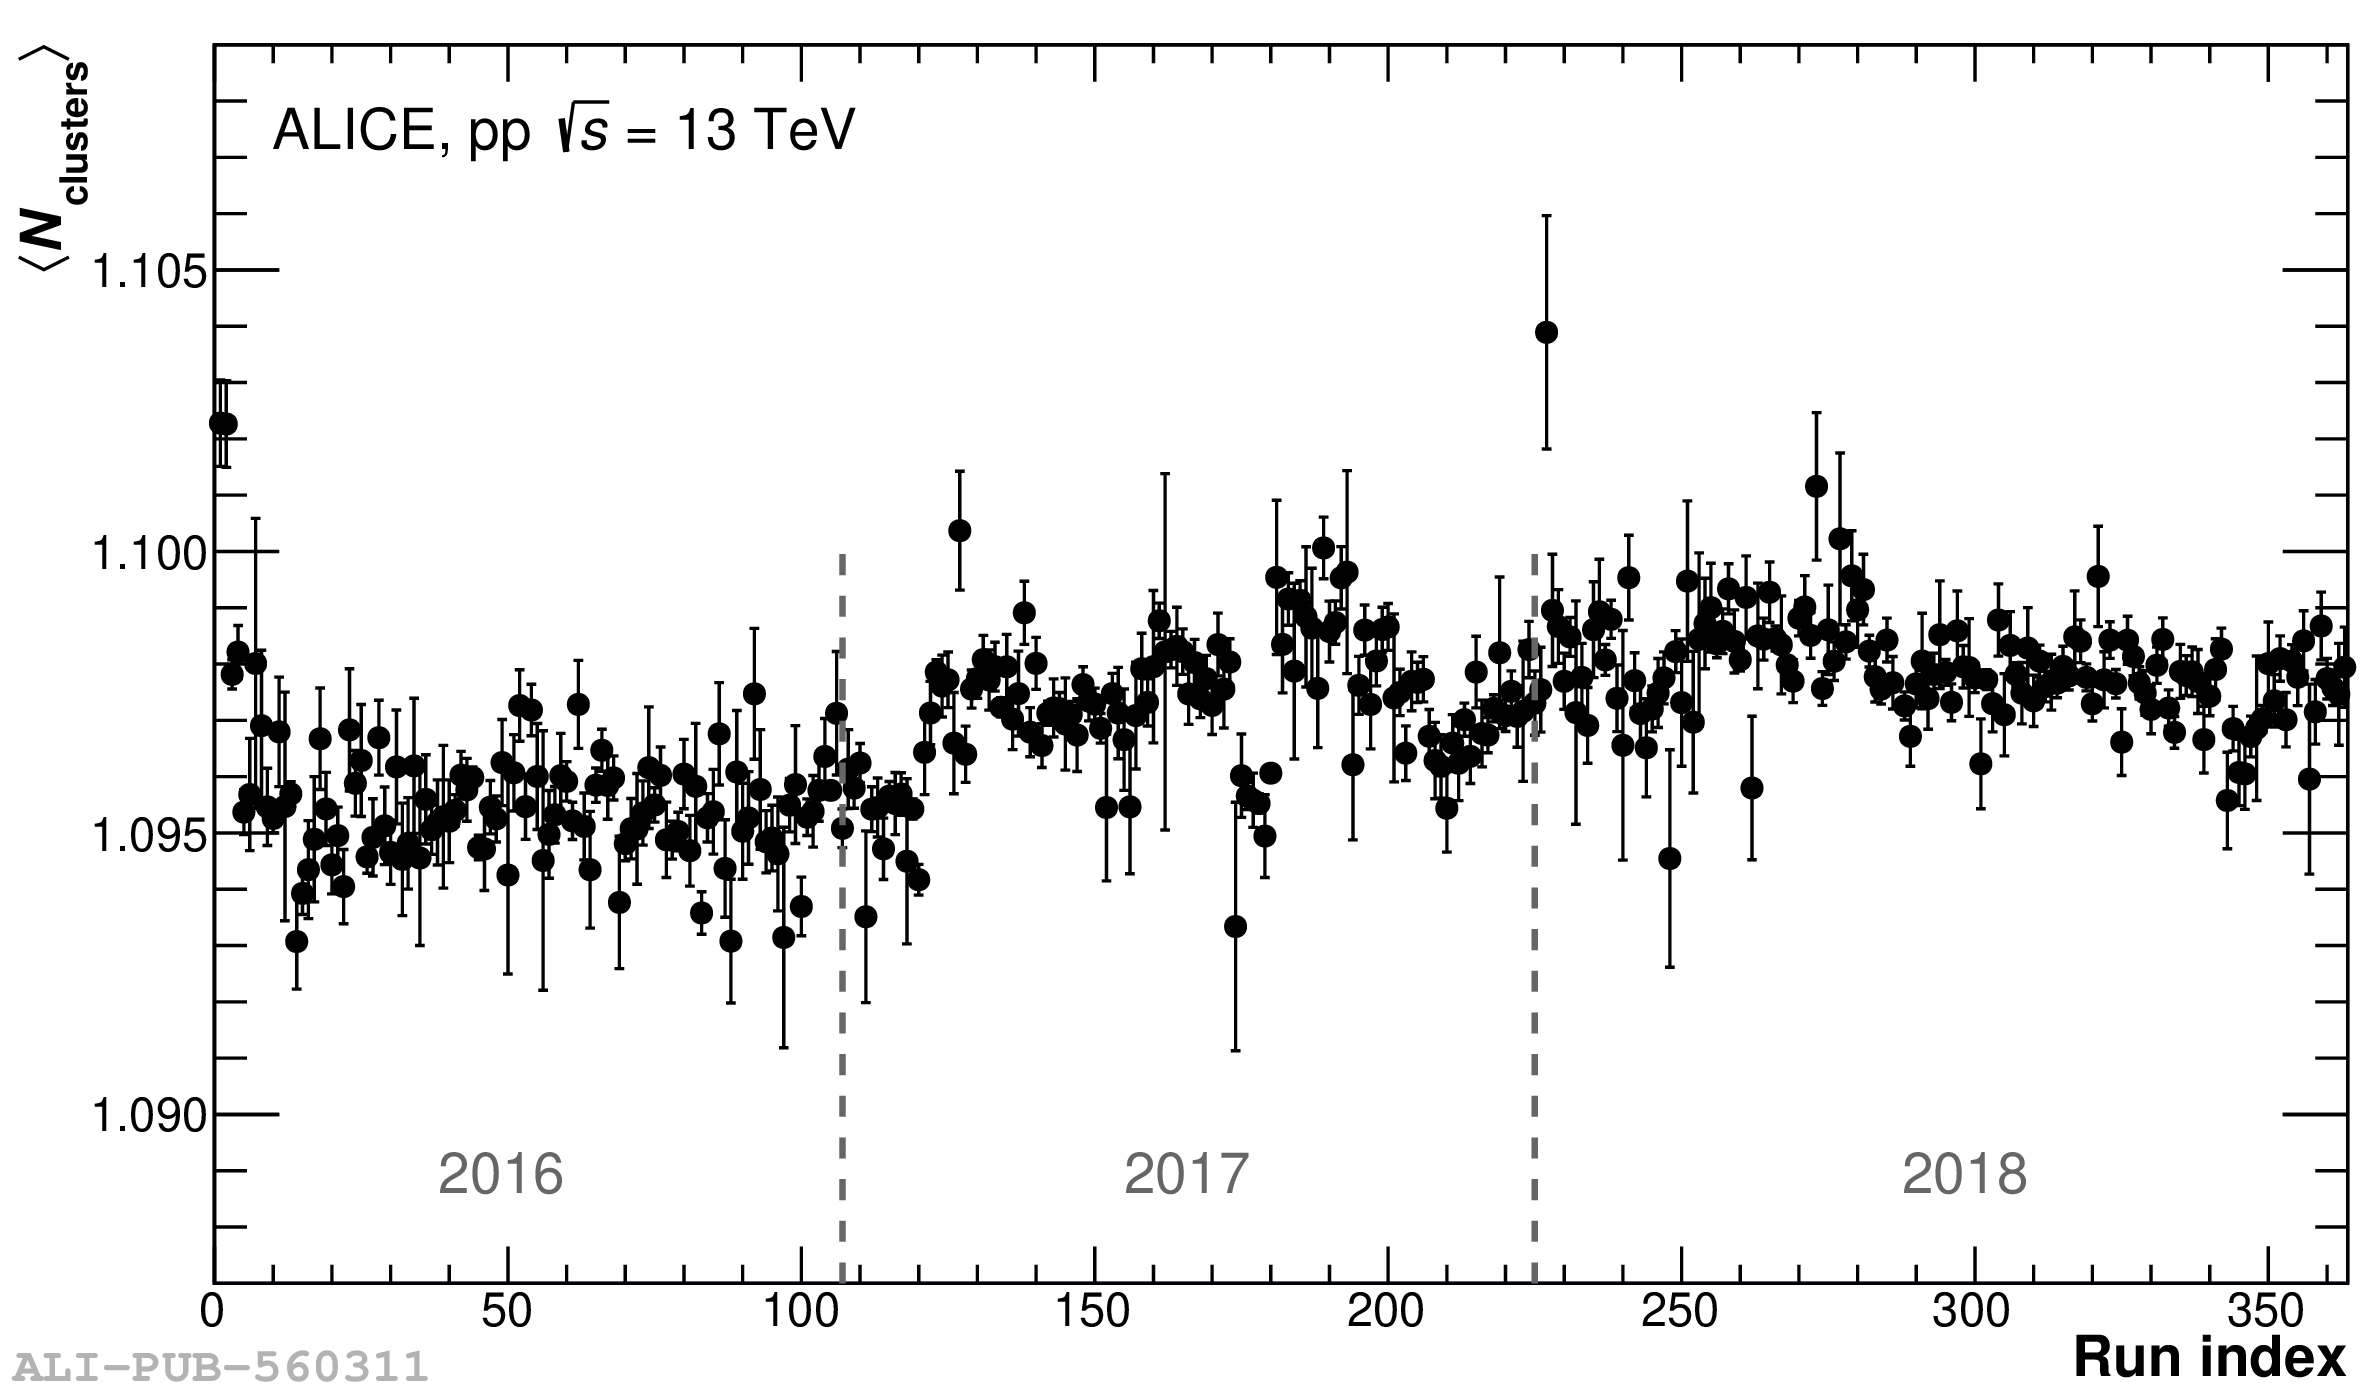   |