Measurement of inclusive charged-particle jet production in pp and p-Pb collisions at $\sqrt{s_{\rm NN}}=5.02$ TeV

Measurements of inclusive charged-particle jet production in pp and p-Pb collisions at center-of-mass energy per nucleon-nucleon collision $\sqrt{s_{\rm NN}} = 5.02$ TeV and the corresponding nuclear modification factor $R_{\rm pPb}^{\rm ch\,jet}$ are presented, using data collected with the ALICE detector at the LHC. Jets are reconstructed in the central rapidity region $|\eta_{\rm jet}| <~ 0.5$ from charged particles using the anti-$k_{\rm T}$ algorithm with resolution parameters $R = 0.2$, 0.3, and 0.4. The $p_{\rm T}$-differential inclusive production cross section of charged-particle jets, as well as the corresponding cross section ratios, are reported for pp and p-Pb collisions in the transverse momentum range $10 <~ p^{\rm ch}_{\rm T,jet} <~ 140$ GeV/$c$ and $10 <~ p^{\rm ch}_{\rm T,jet} <~ 160$ GeV/$c$, respectively, together with the nuclear modification factor $R_{\rm pPb}^{\rm ch\,jet}$ in the range $10 <~ p^{\rm ch}_{\rm T,jet} <~ 140$ GeV/$c$. The analysis extends the $p_{\rm T}$ range of the previously-reported charged-particle jet measurements by the ALICE Collaboration. The nuclear modification factor is found to be consistent with one and independent of the jet resolution parameter with the improved precision of this study, indicating that the possible influence of cold nuclear matter effects on the production cross section of charged-particle jets in p-Pb collisions at $\sqrt{s_{\rm NN}} = 5.02$ TeV is smaller than the current precision. The obtained results are in agreement with other minimum bias jet measurements available for RHIC and LHC energies, and are well reproduced by the NLO perturbative QCD POWHEG calculations with parton shower provided by PYTHIA8 as well as by JETSCAPE simulations.


JHEP 05 (2024) 041
HEP Data
e-Print: arXiv:2307.10860 | PDF | inSPIRE
CERN-EP-2023-131
Figure group

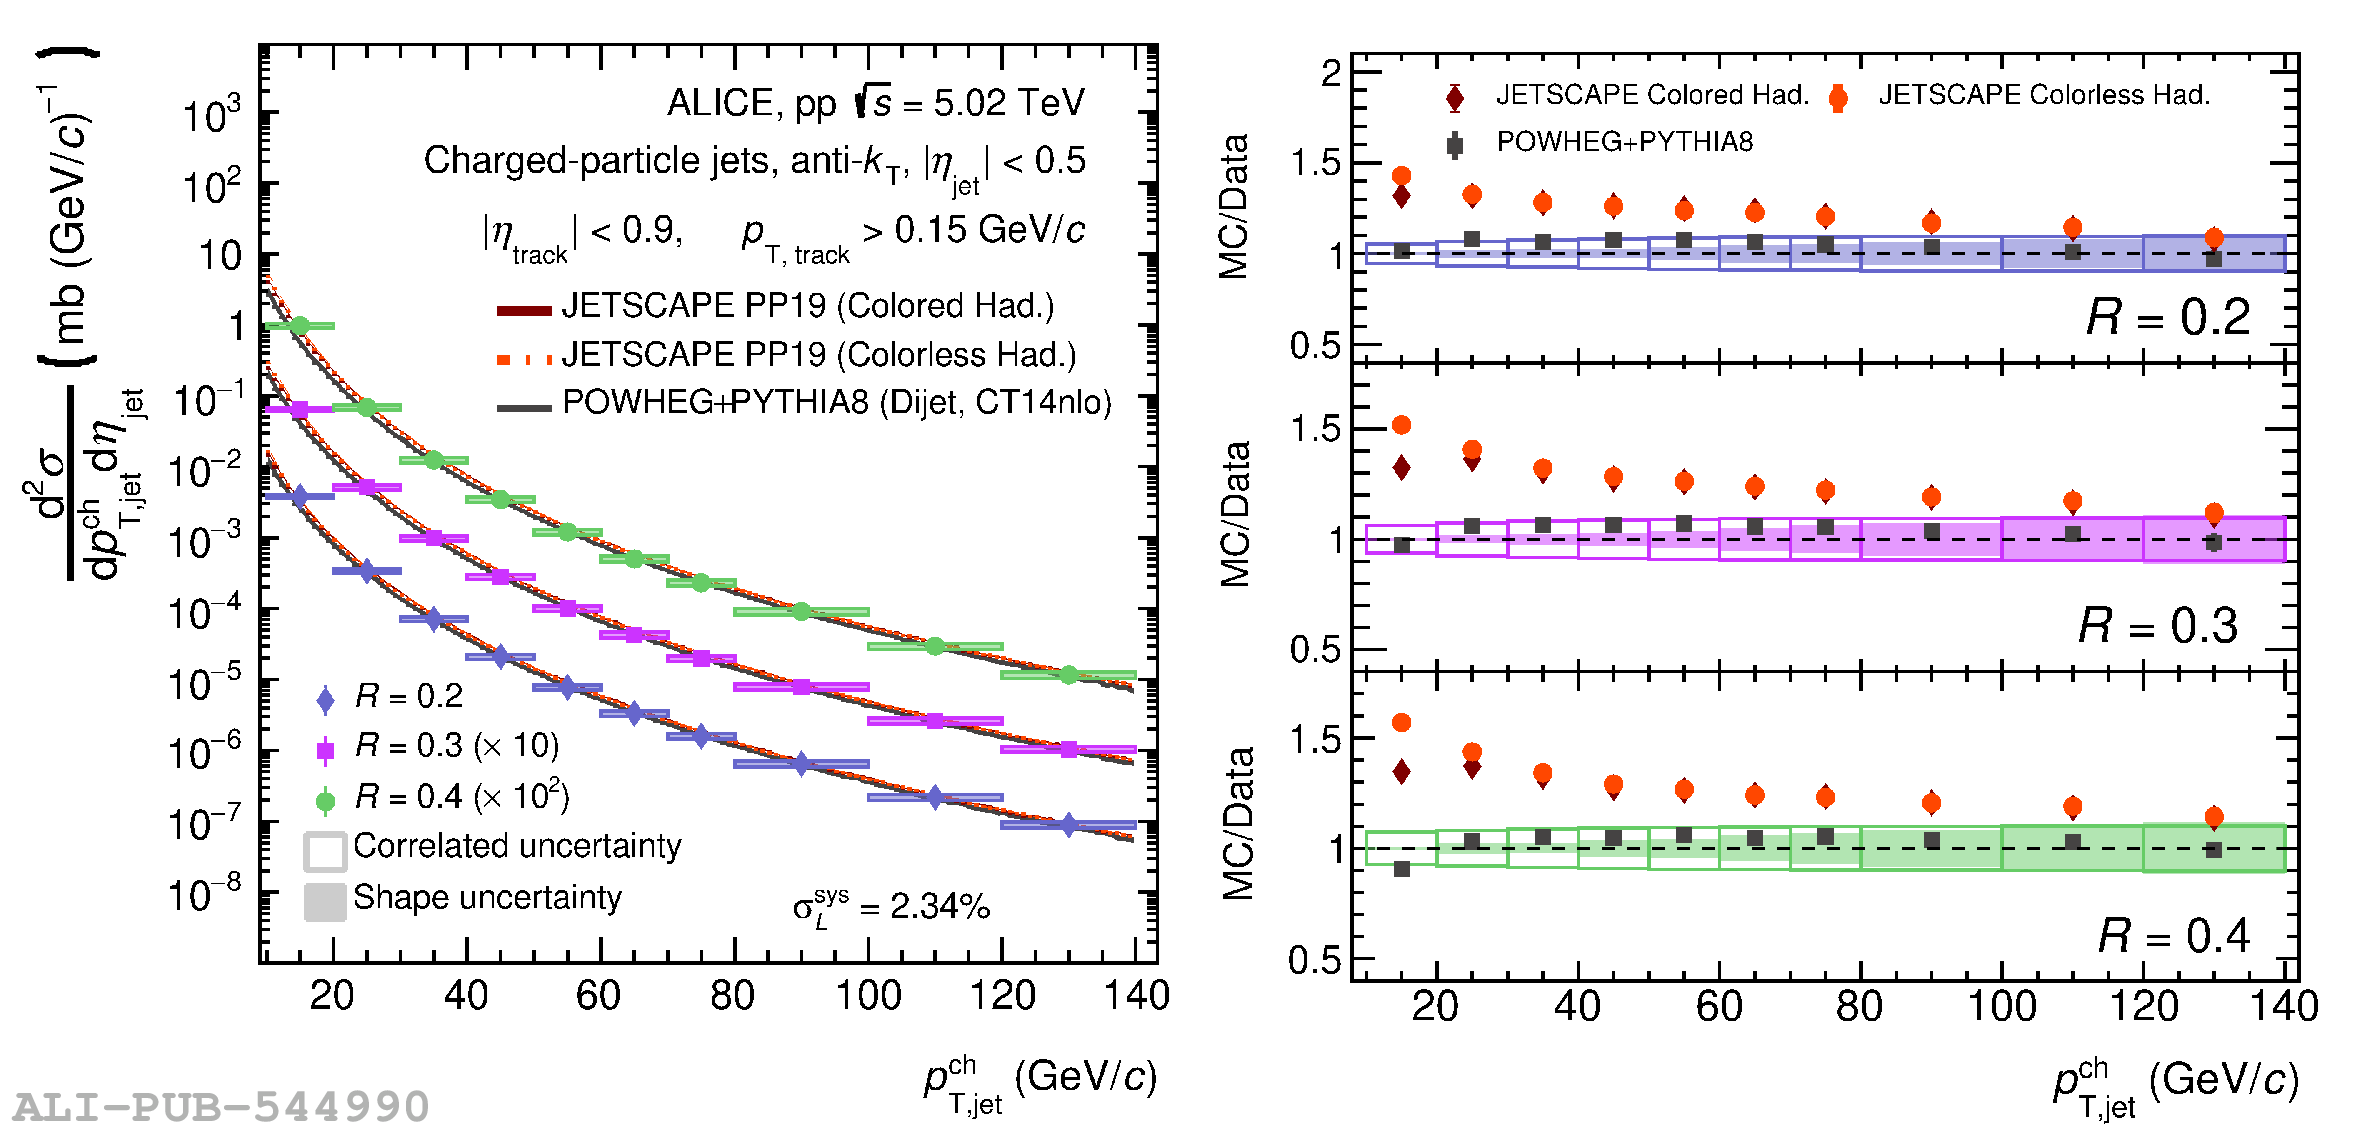
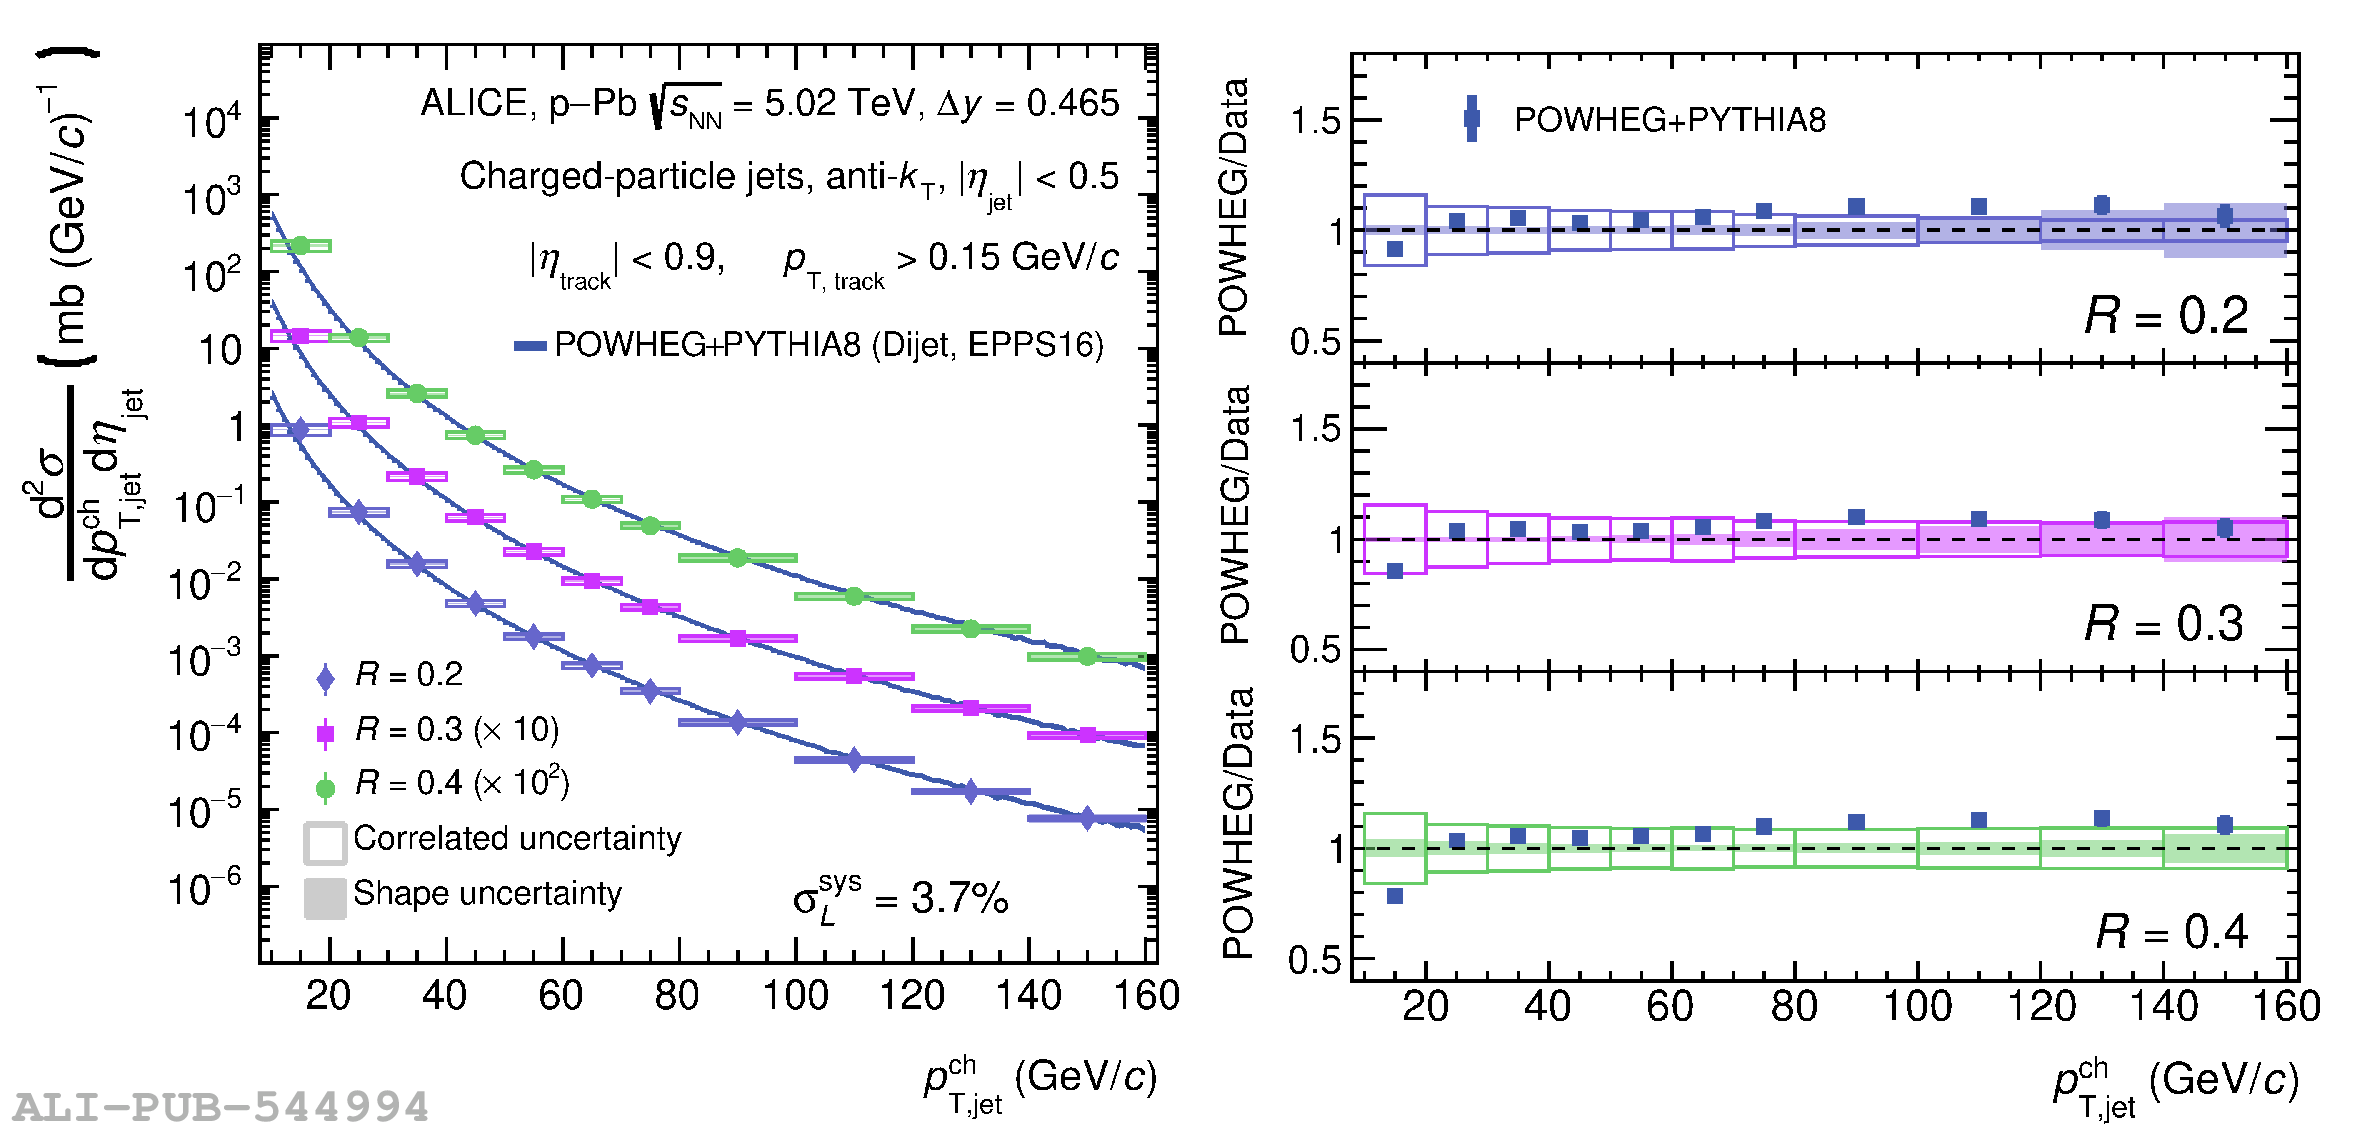
Figure 1

Left panel: Fully corrected charged-particle jet cross section in pp collisions at $\sqrt{s}$ = 5.02 TeV for $R=0.2$, $0.3$, and $0.4$ (scale factors as indicated are used for better visibility) Statistical uncertainties are shown as vertical bars and are typically smaller than the marker size for all points Boxes indicate systematic uncertainties The additional normalization uncertainty due to luminosity is quoted separately as $\sigma_{L}^{\rm sys}$ The data are compared to the predictions by POWHEG +PYTHIA8 and JETSCAPE. Right panels: Ratio of the theory predictions to the measured data The correlated and shape systematic uncertainties on the ratio account for the data uncertainties and do not show the normalization uncertainty.

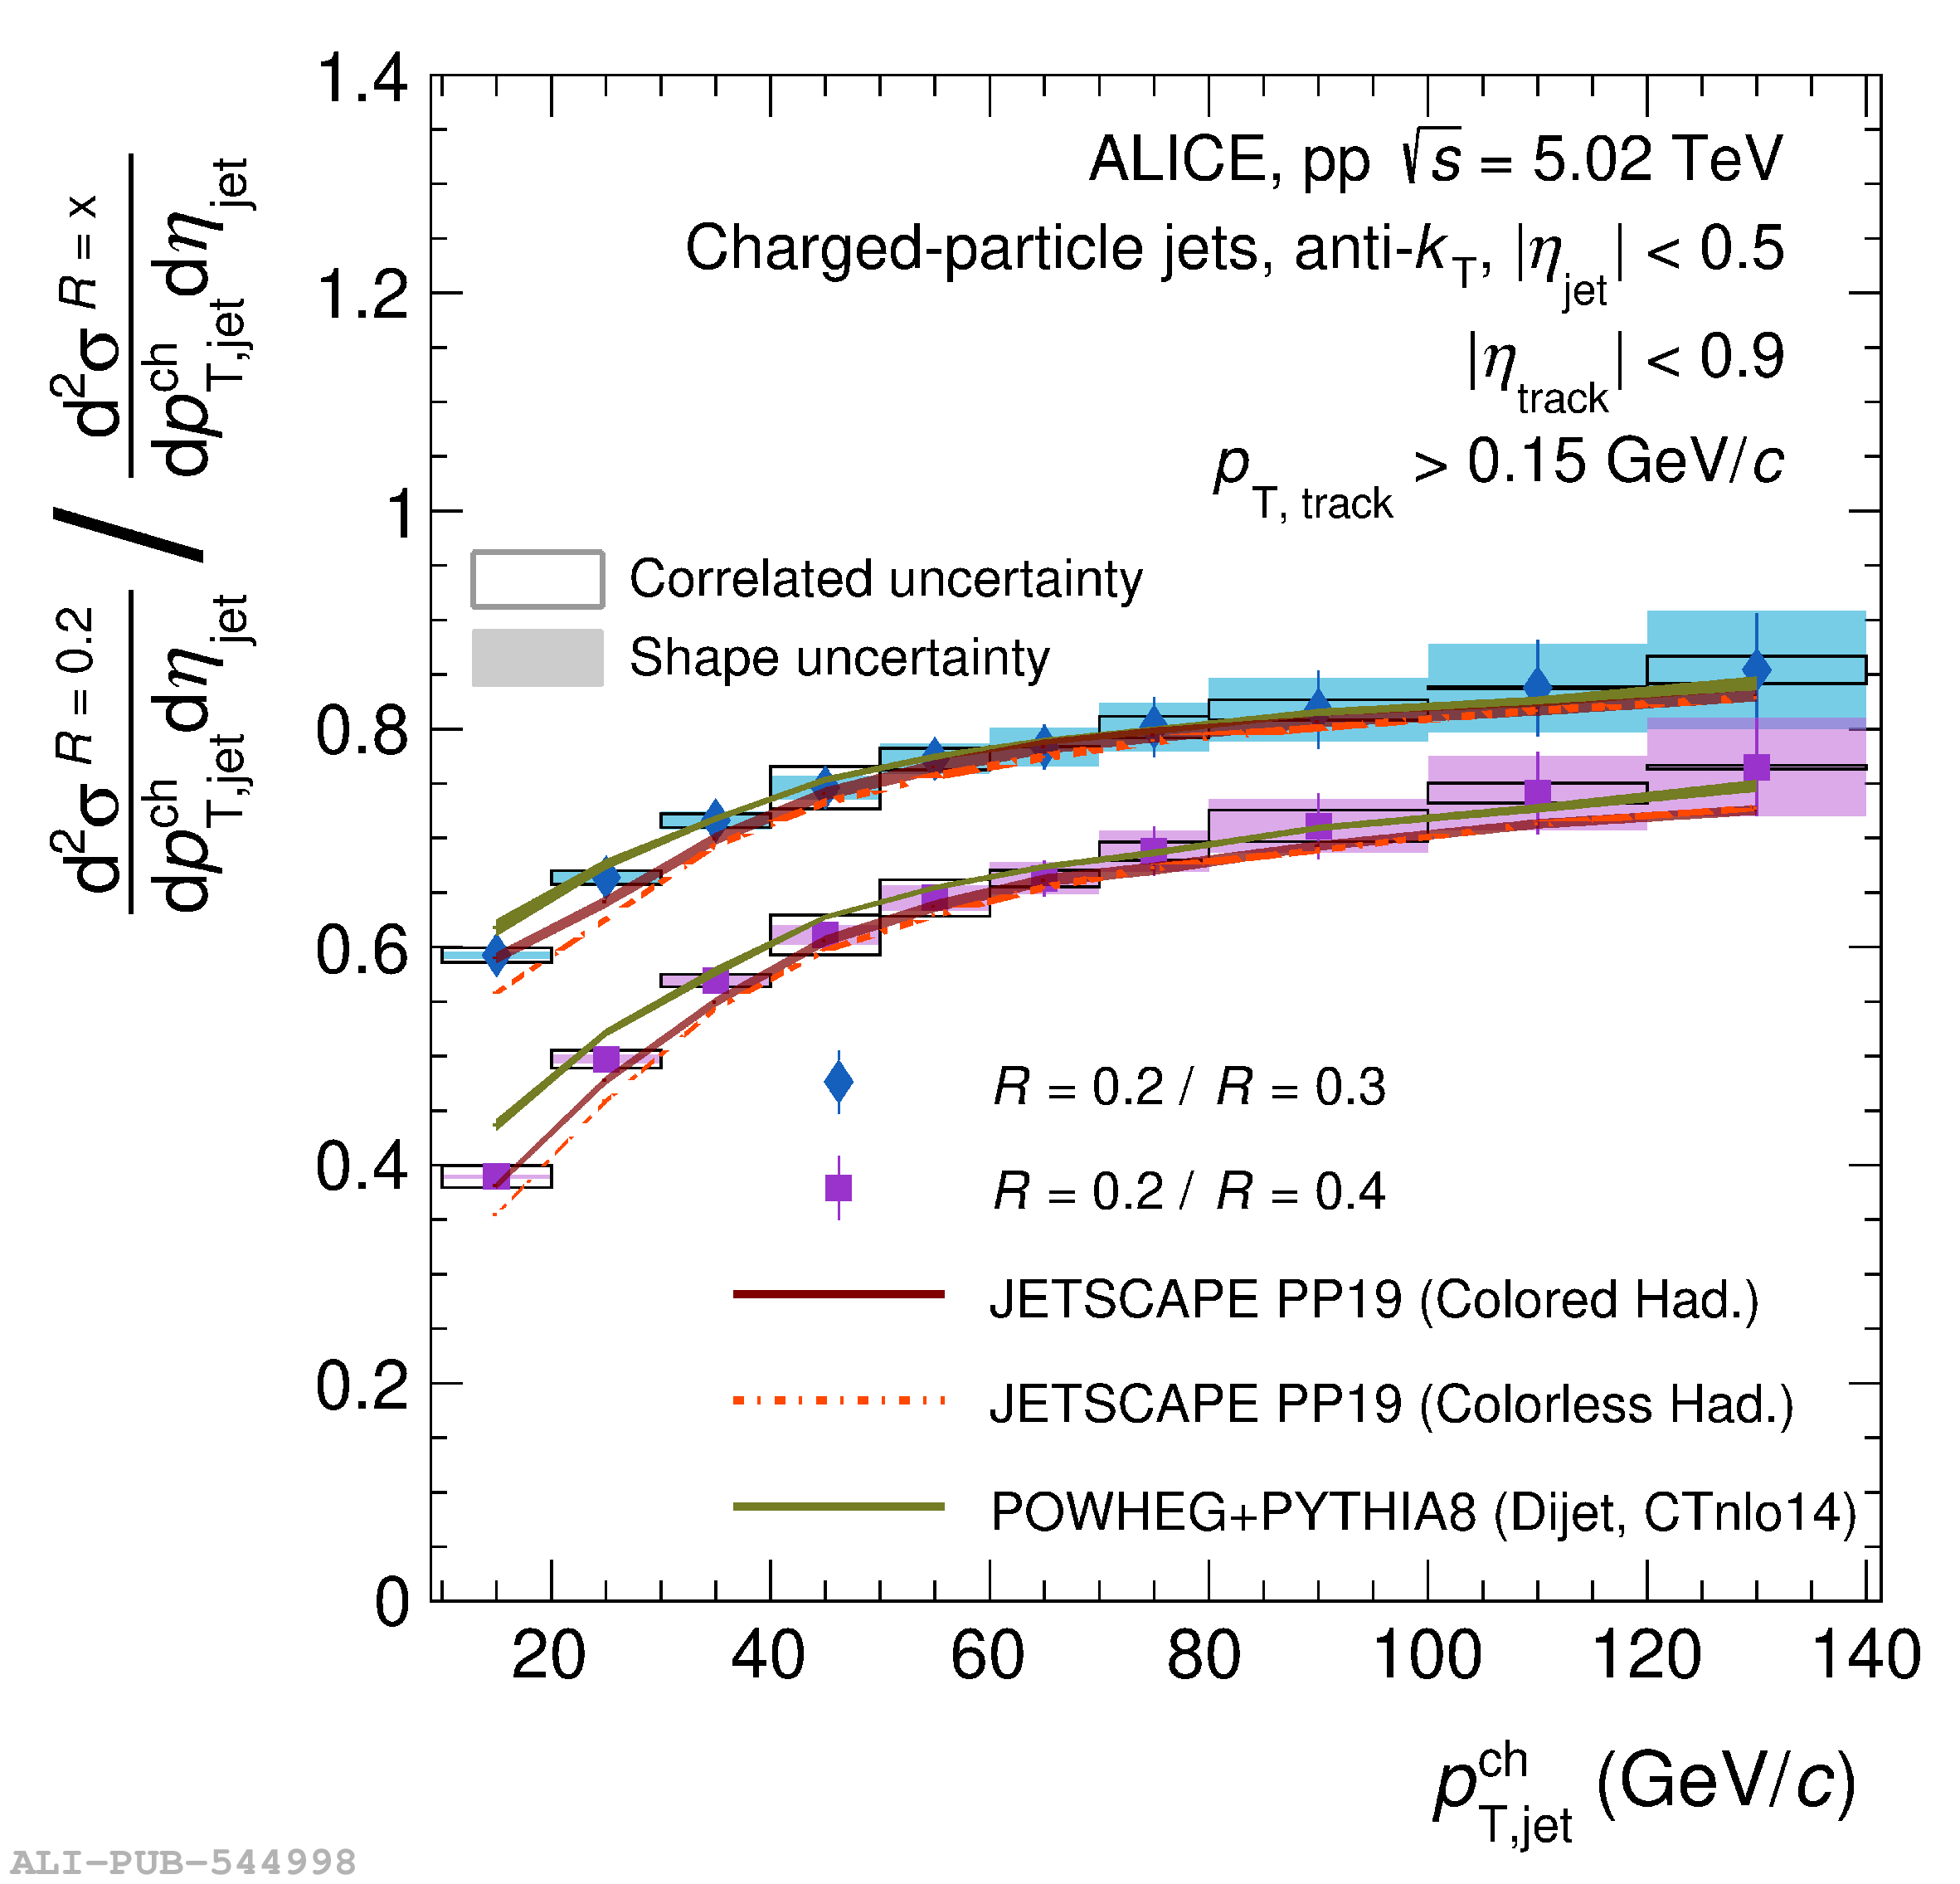
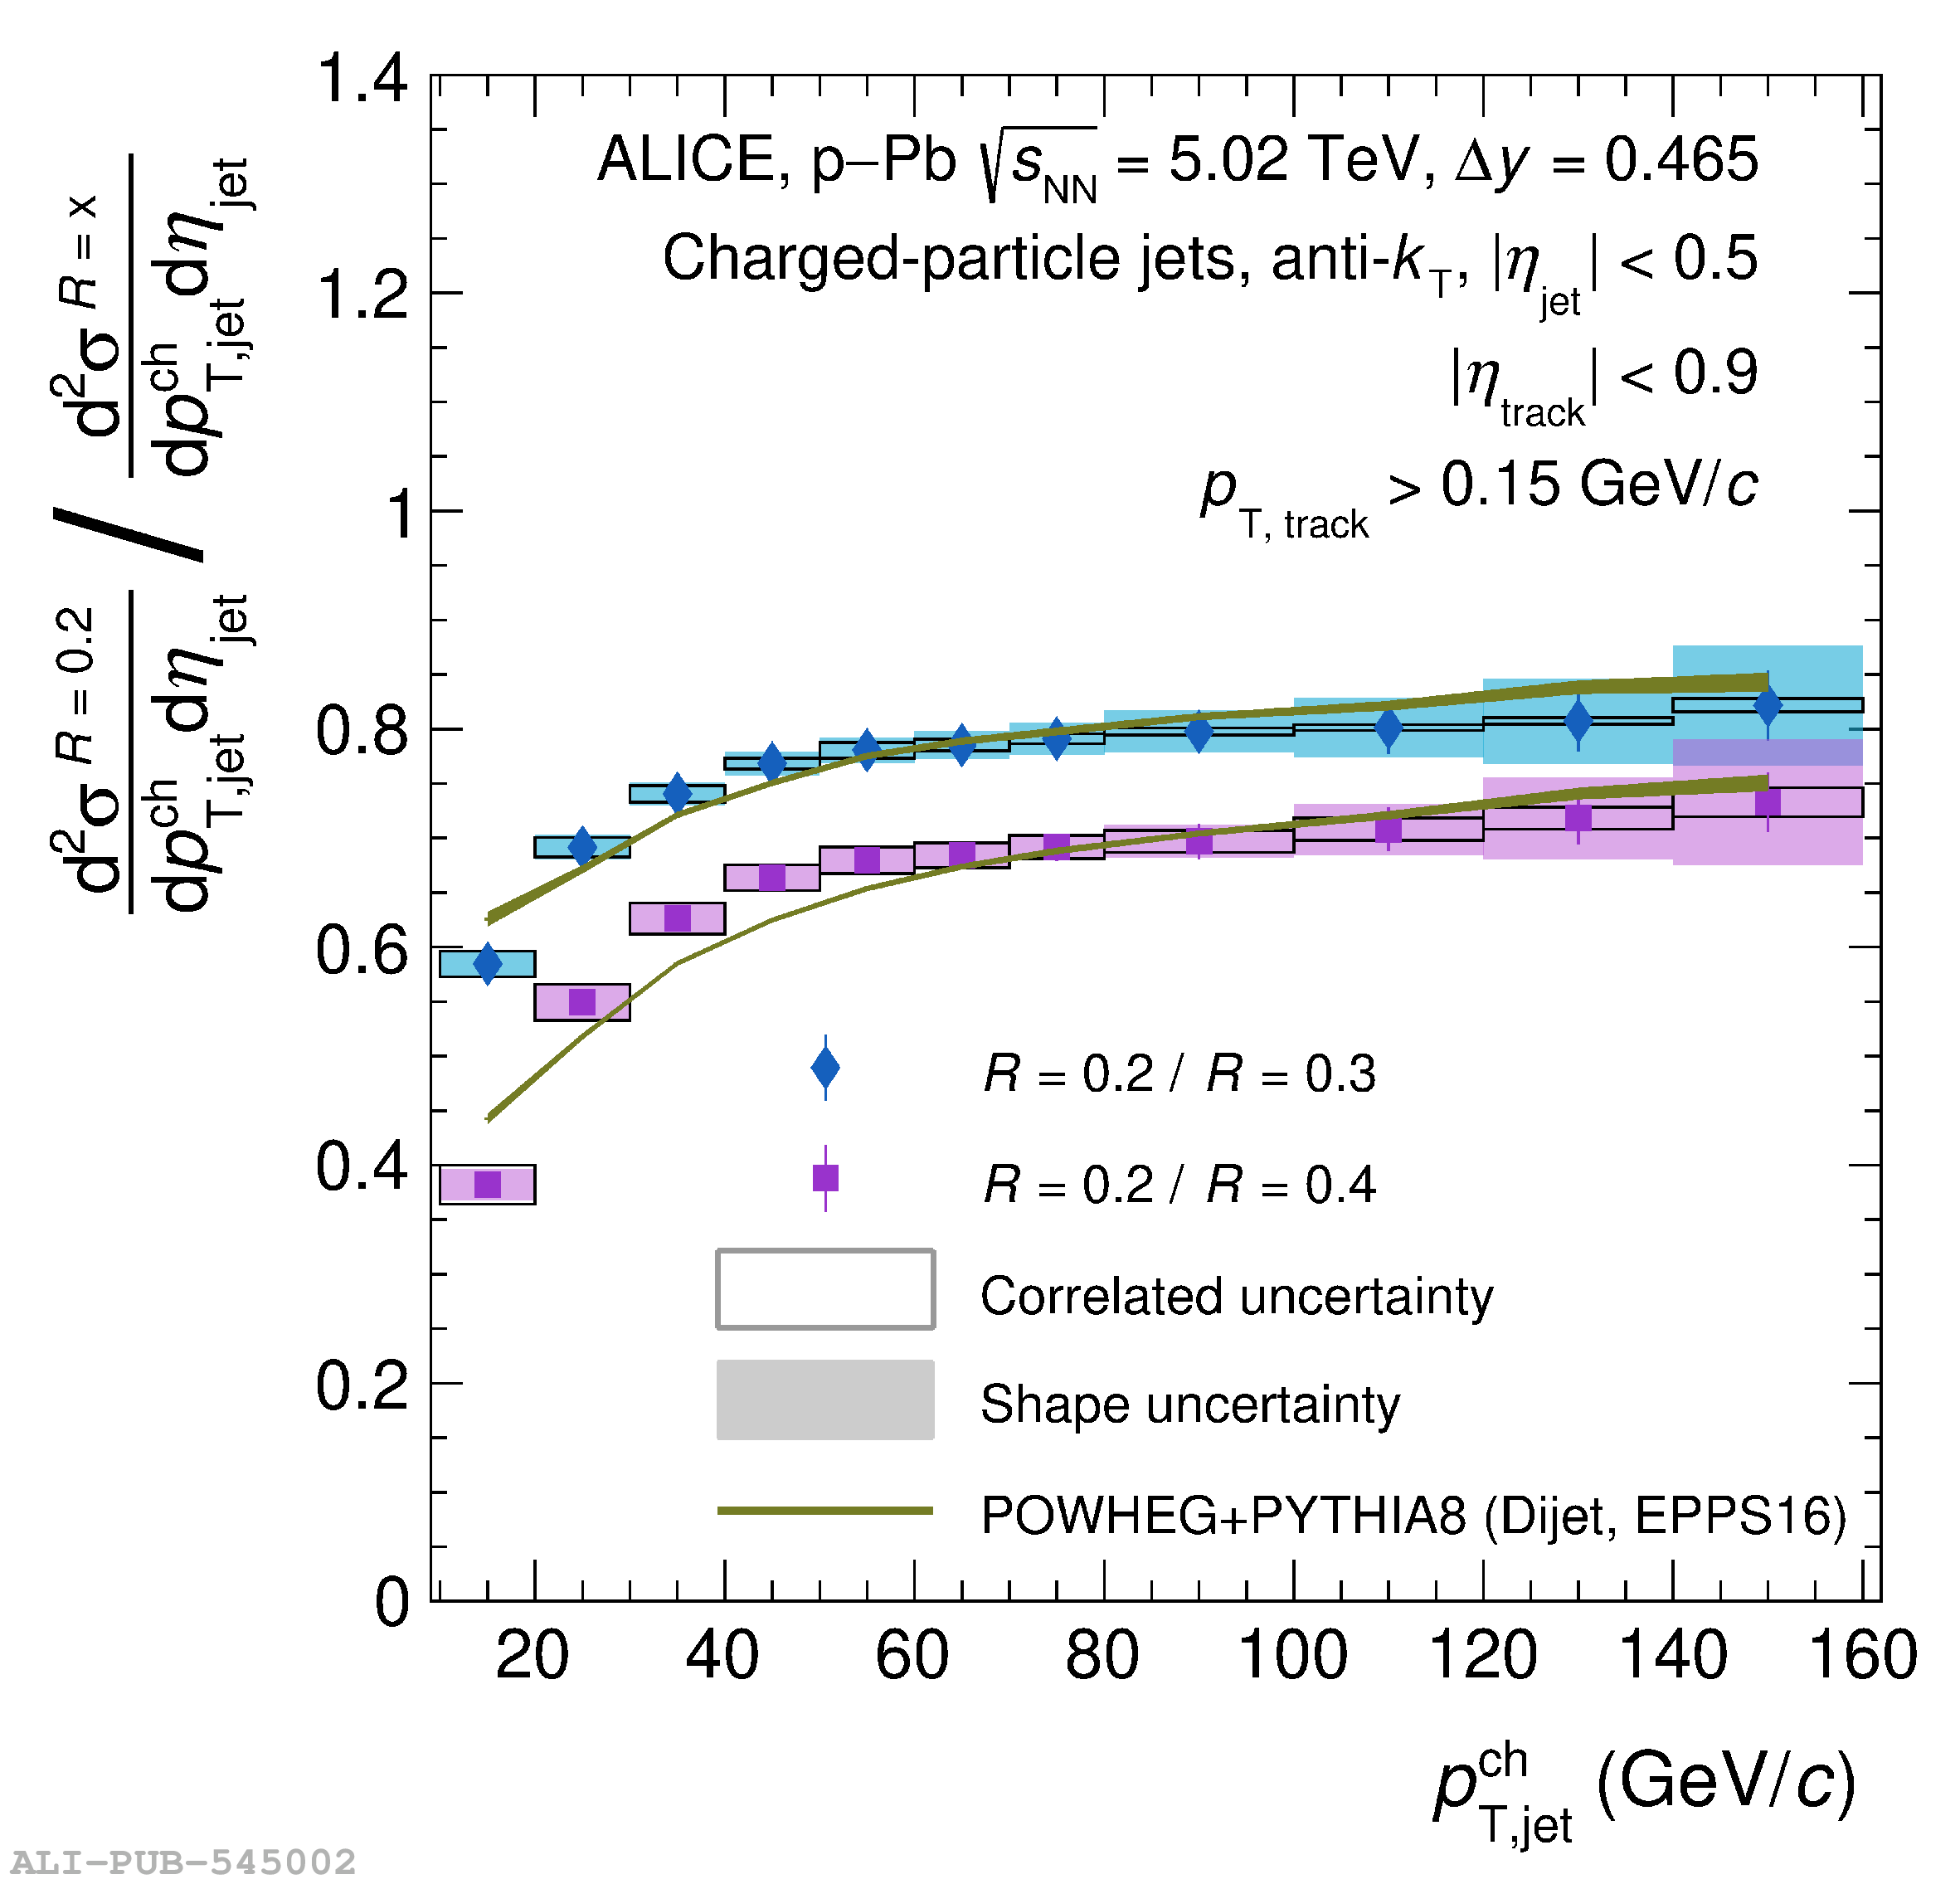
Figure 3

Fully corrected charged-particle jet cross section ratios with $R=0.2$ to other jet resolution parameters The plots also include comparison to the POWHEG +PYTHIA8 and JETSCAPE (in case of pp collisions) predictions Left panel: pp collisions at $\sqrt{s}$ = 5.02 TeV Right panel: p$-$Pb collisions at $\sqrt{s_{\rm NN}}$ = 5.02 TeV.

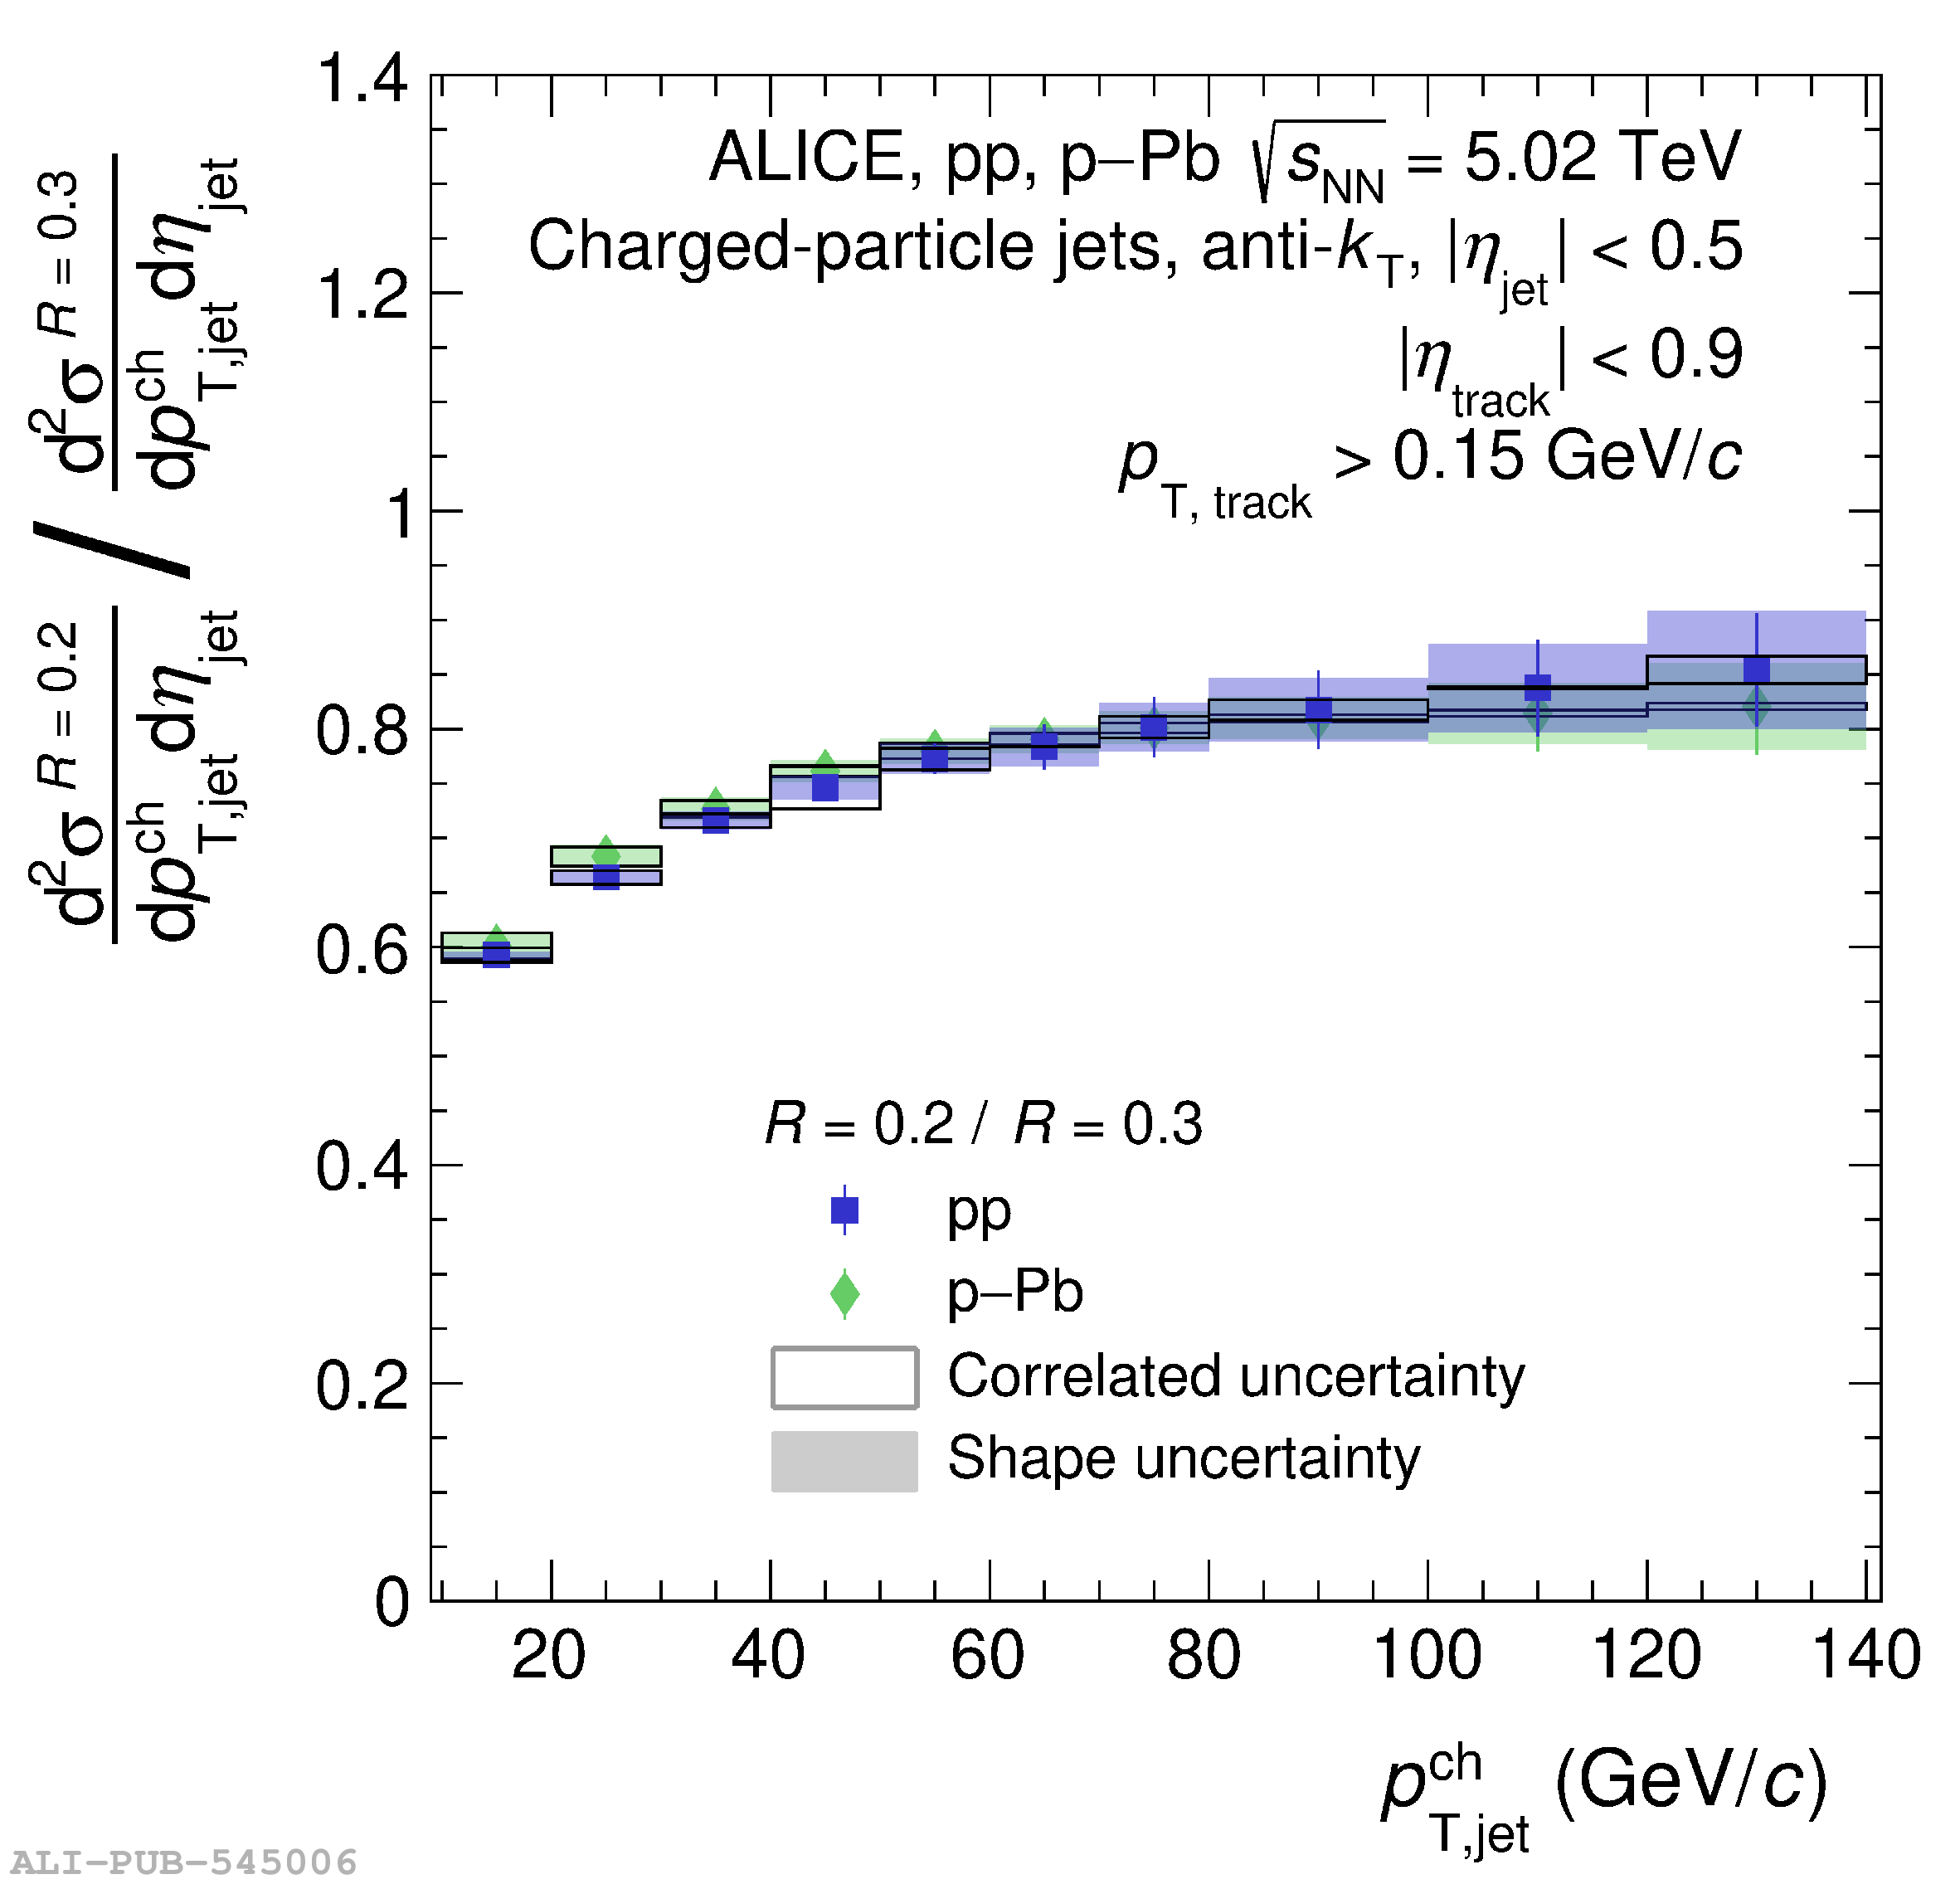
Figure 4

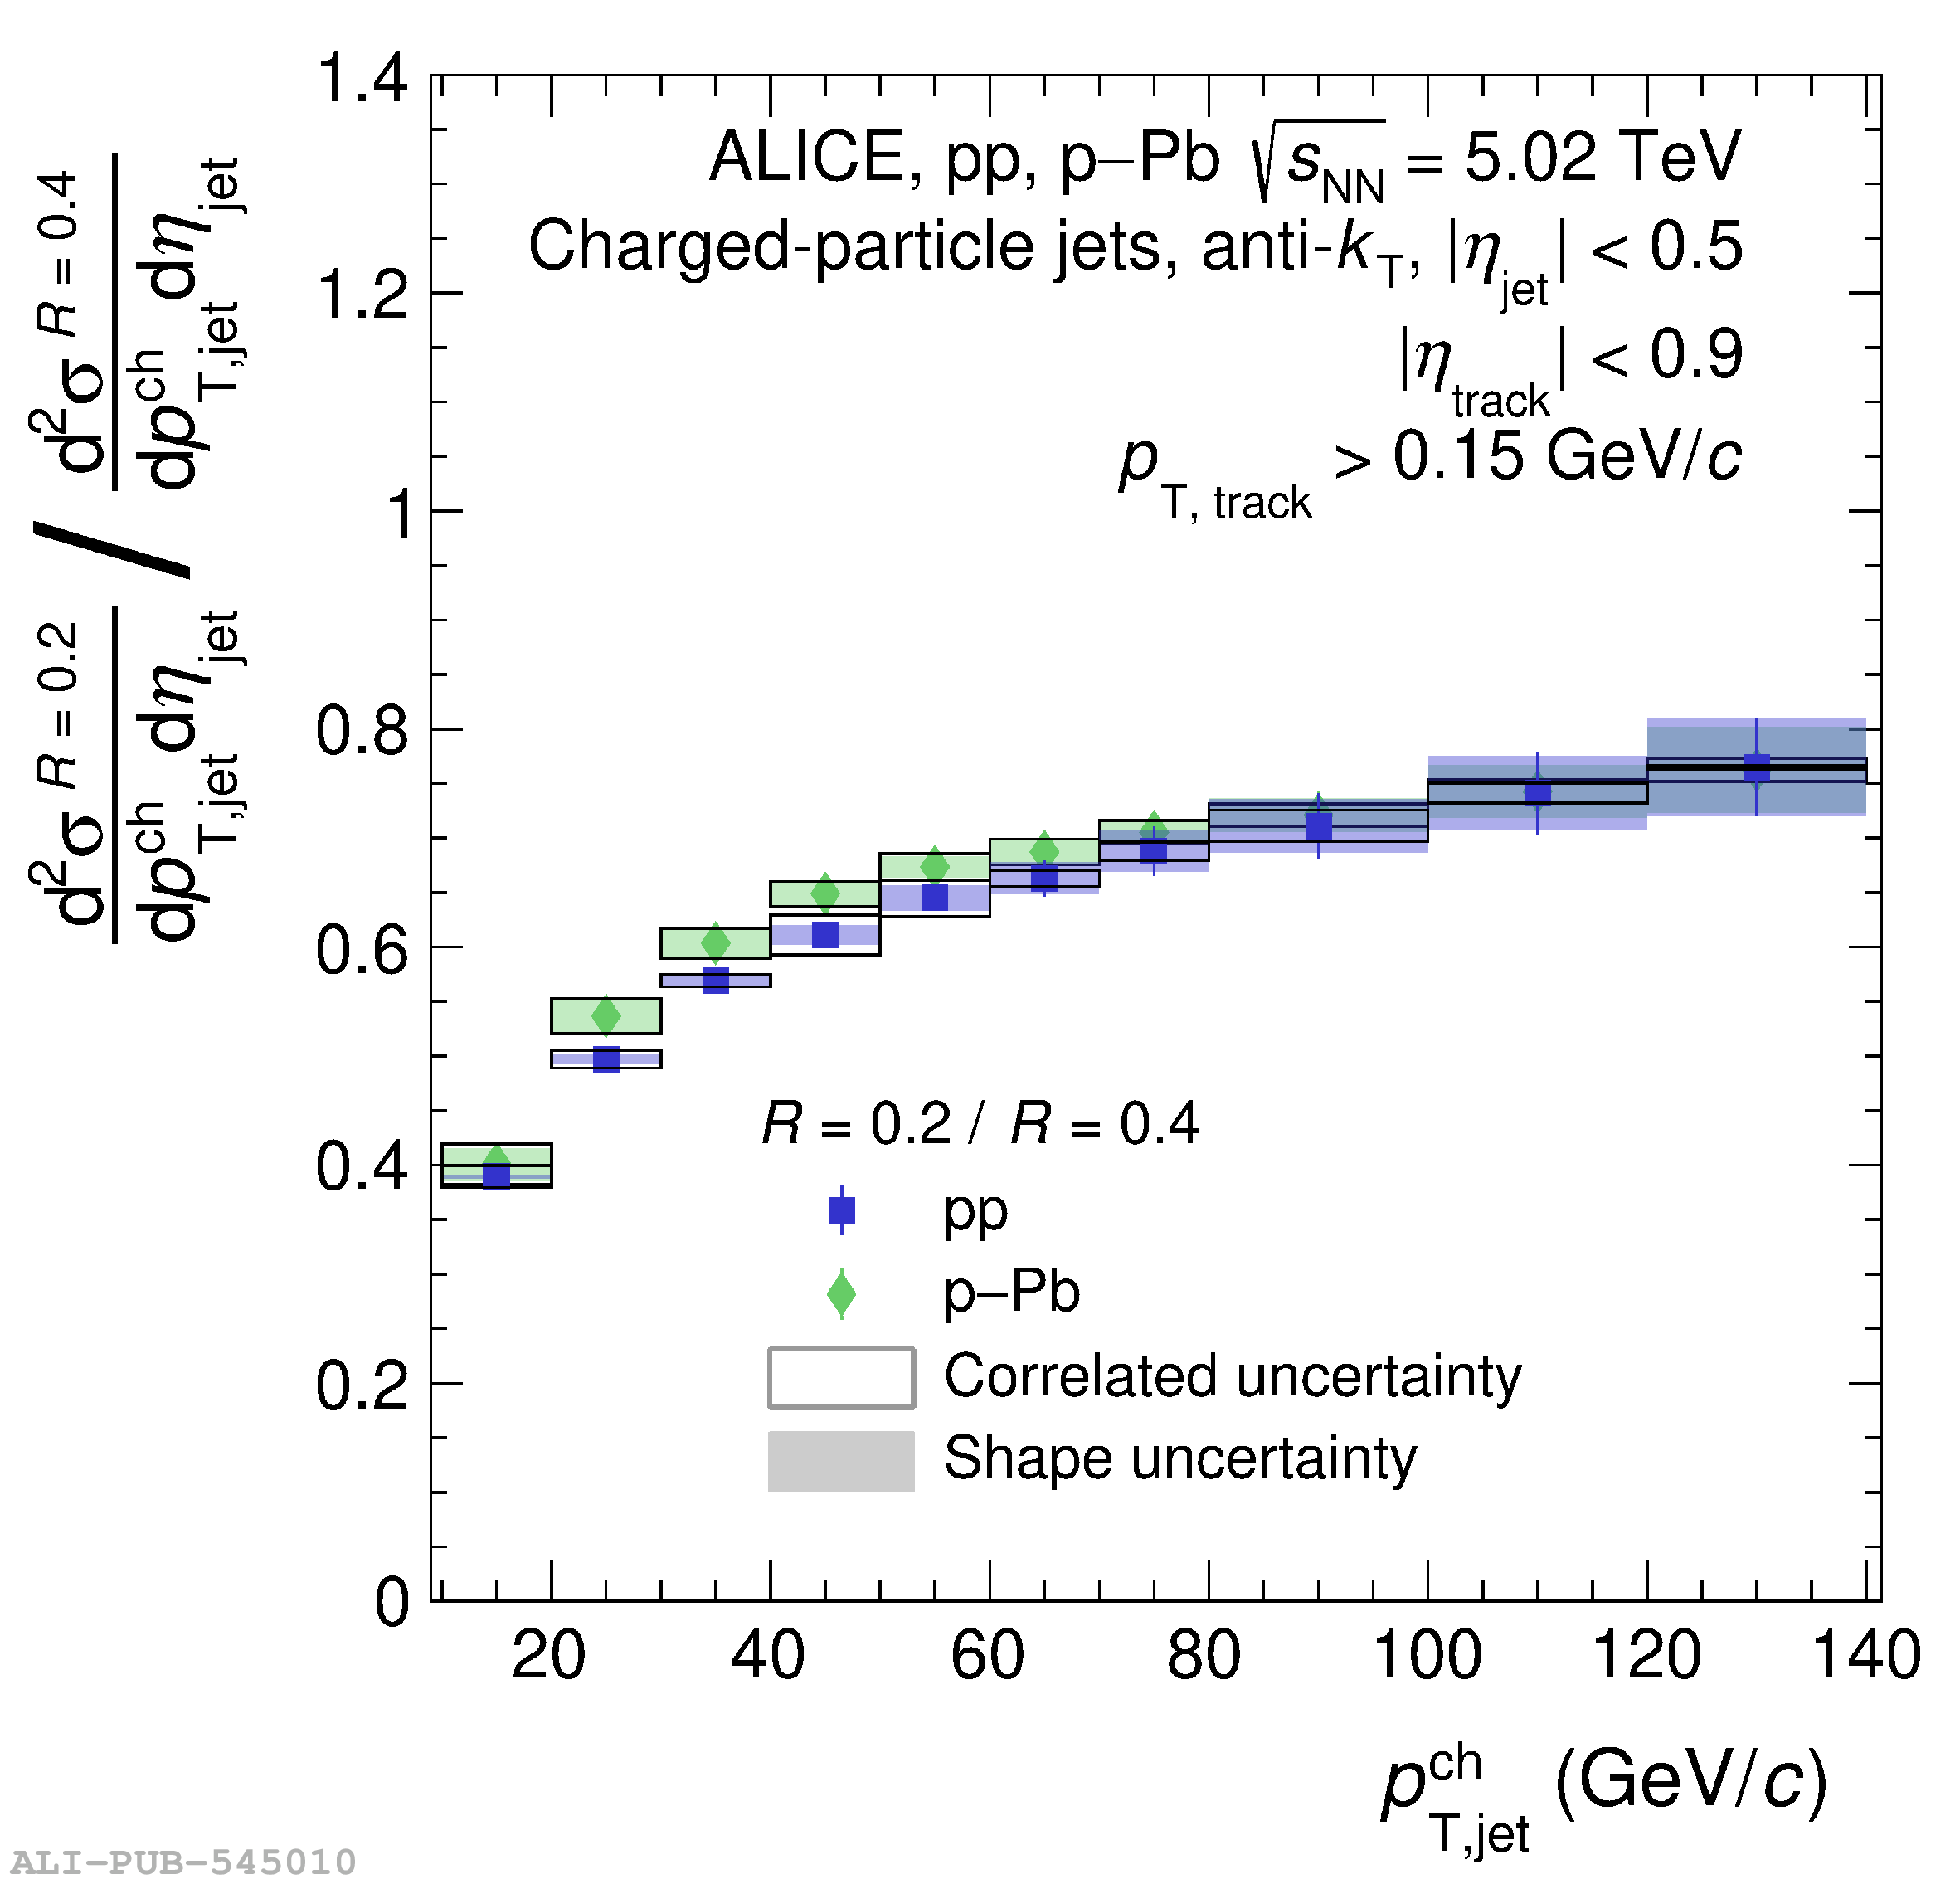
Comparison of jet cross section ratios between pp collisions and p$-$Pb collisions at $\sqrt{s_{\rm NN}}$ = 5.02 TeV. The left panel shows the ratios between jets with $R=0.2$ and $R=0.3$, the right panel shows the ratios between jets with $R=0.2$ and $R=0.4$.

Figure 5

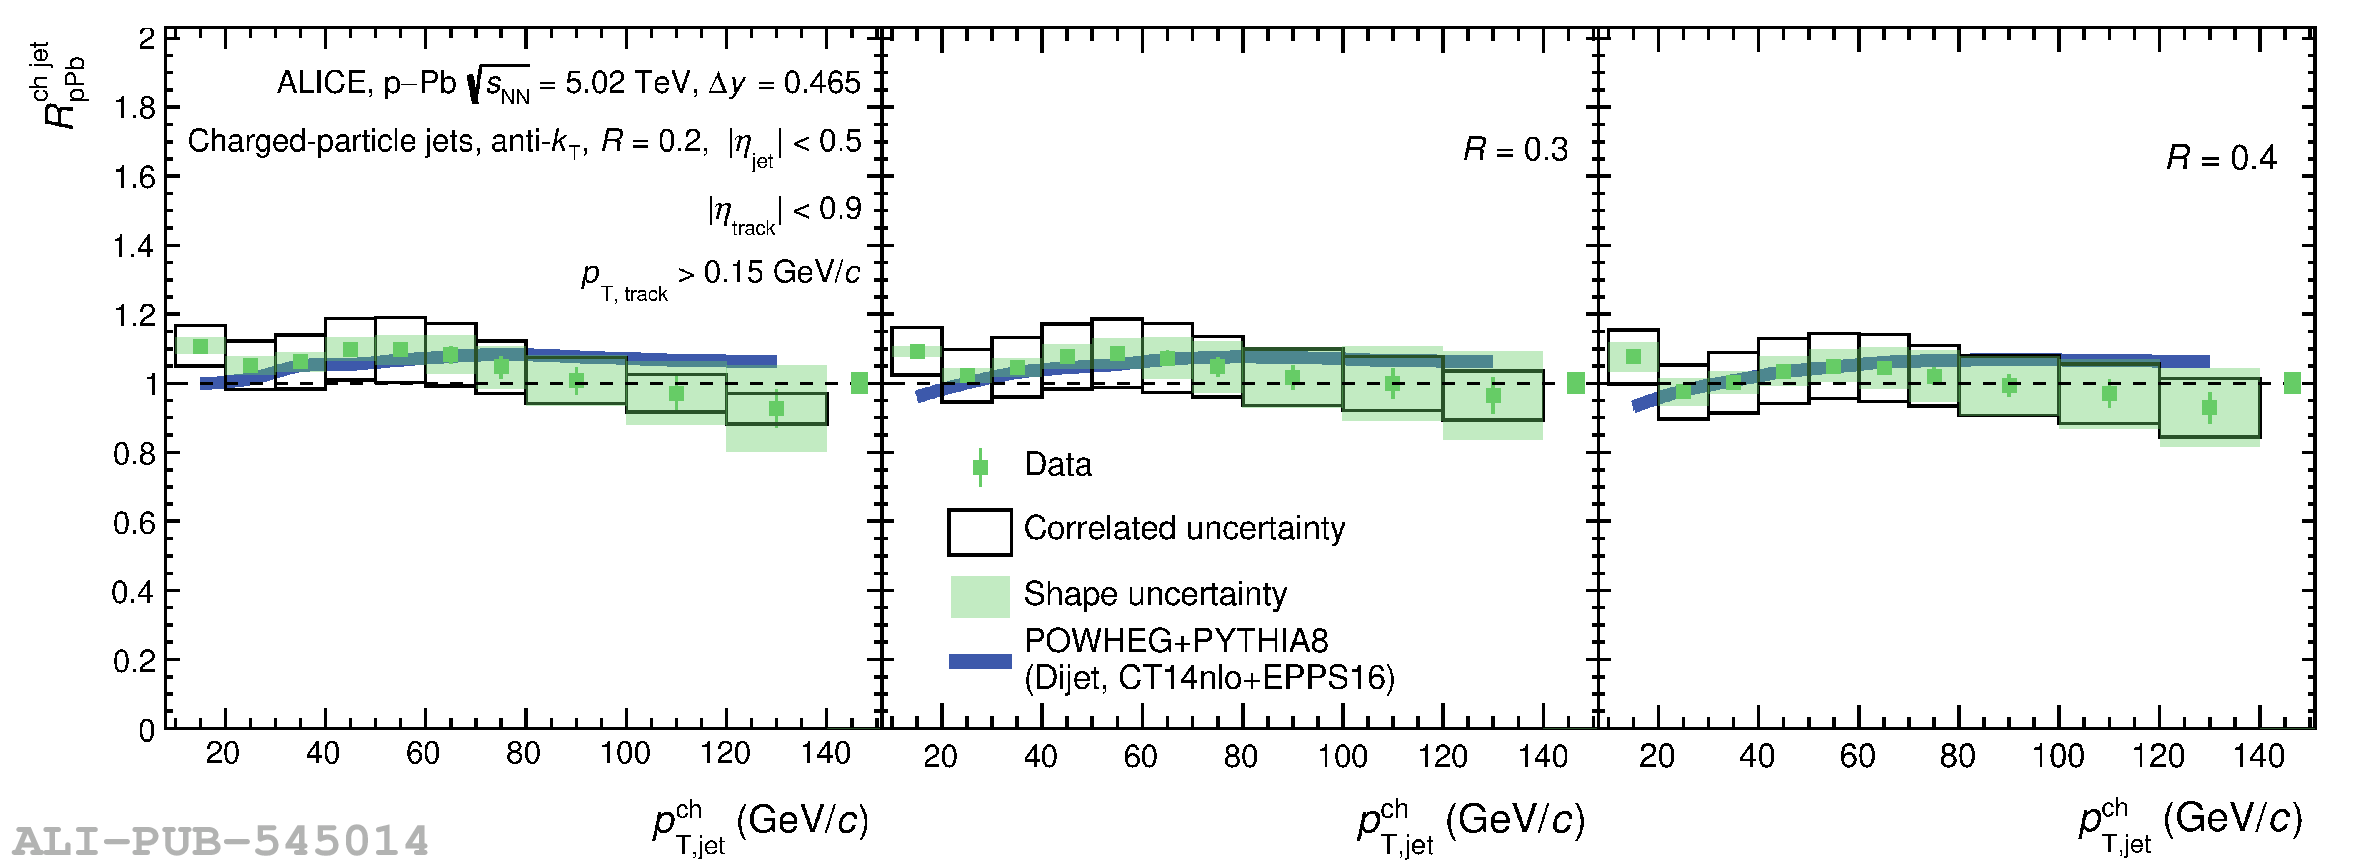
The nuclear modification factor $R_{\rm pPb}^{\rm ch\,jet}$ of inclusive charged-particle jets as a function of $p_{\rm T,jet}^{\rm ch}$ at $\sqrt{s_{\rm NN}}$ = 5.02 TeV for $R=0.2$, $0.3$, and $0.4$ The data measured are compared with the POWHEG +PYTHIA8 predictions calculated with various nPDFs. The bands on the predictions represent statistical uncertainties Systematic and statistical uncertainties of data are shown as boxes and error bars, respectively The normalization uncertainty of $4.37\%$ is shown as a box around one.

Figure 6

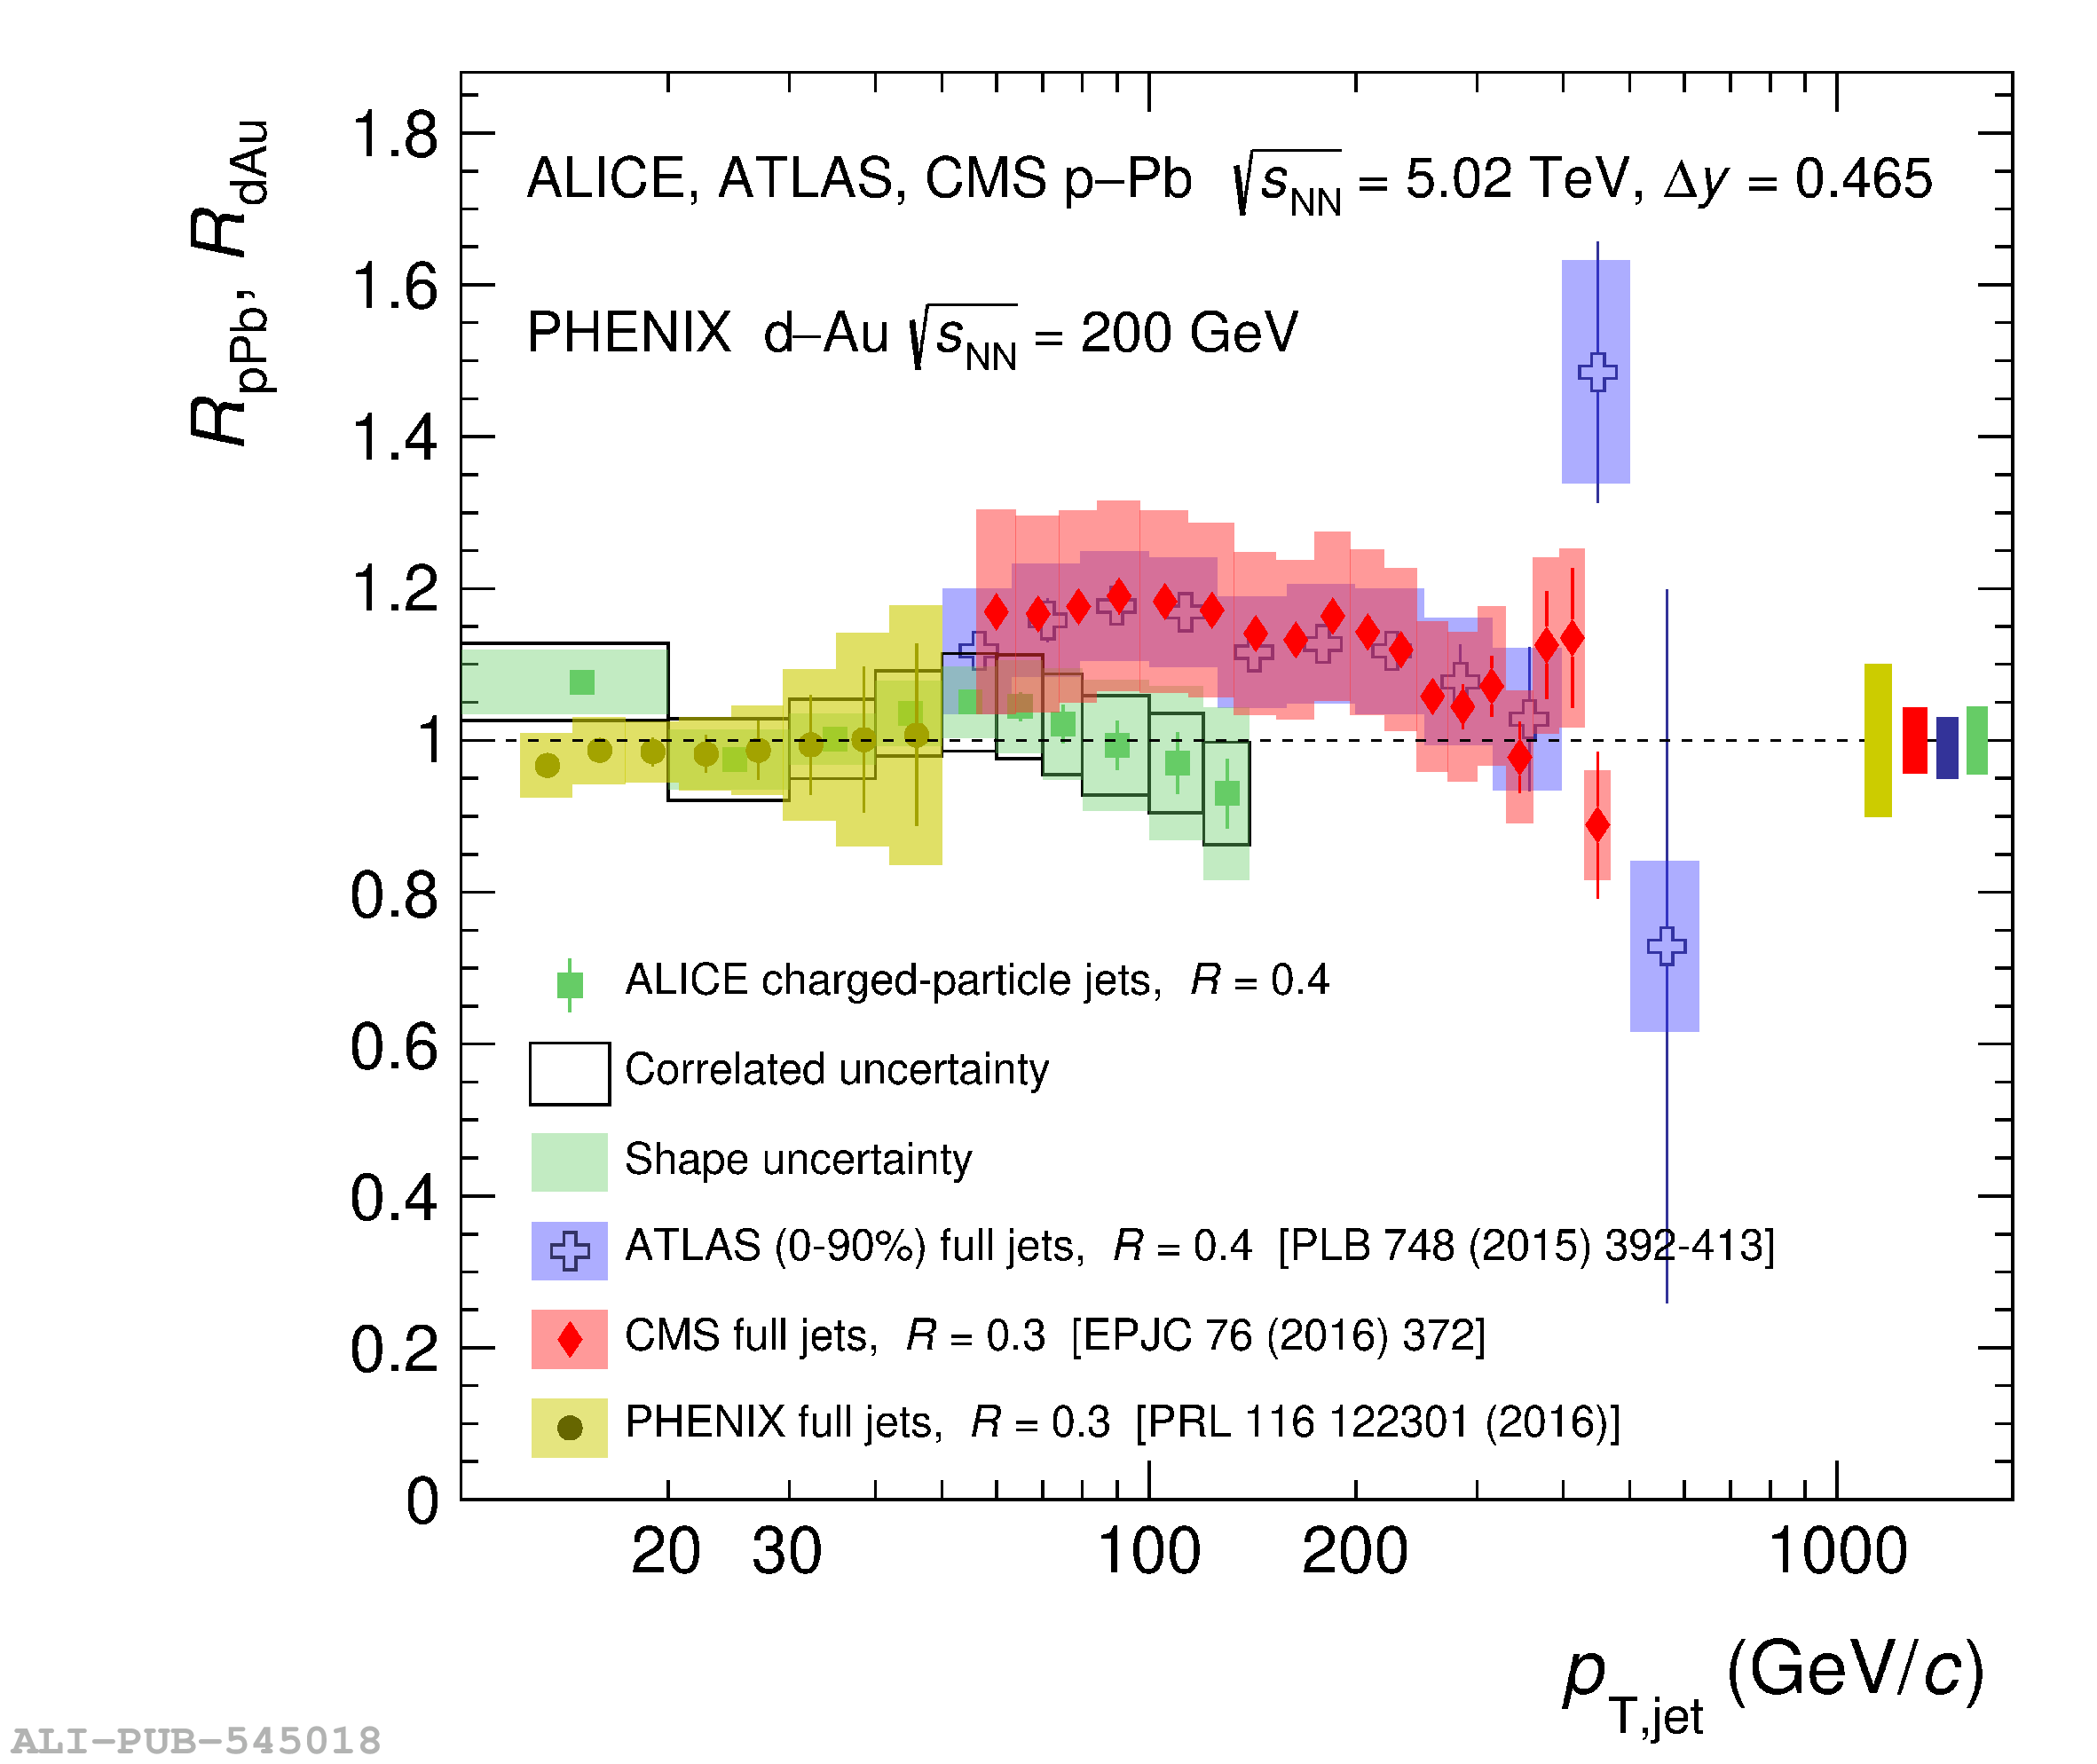
Comparison of the nuclear modification factors of jets in p$-$Pb and d$-$Au measurements at the LHC and RHIC, respectively The boxes around the data points denote the systematic uncertainties, while the error bars denote the statistical uncertainties The systematic uncertainties on the normalization are shown as boxes at $R_{\rm pPb}=1$.