Longitudinal (left) and azimuthal (right) projections of the two-particle transverse momentum correlations $G_{2}^{\rm CD}$ (top) and $G_{2}^{\rm CI}$ (bottom) for selected charged particle multiplicity classes in pp collisions at $\sqrt{s}=7\;\text{TeV}$. The correlator values are not shown in the intervals $|\Delta\eta|<0.1$ and $|\Delta\varphi|<0.09$, which are affected by track merging effects (see text for details). Vertical bars (mostly smaller than the marker size) and shaded bands represent statistical and uncorrelated systematic uncertainties, respectively. Correlated systematic uncertainties are represented as small boxes at the sides of the panels. | 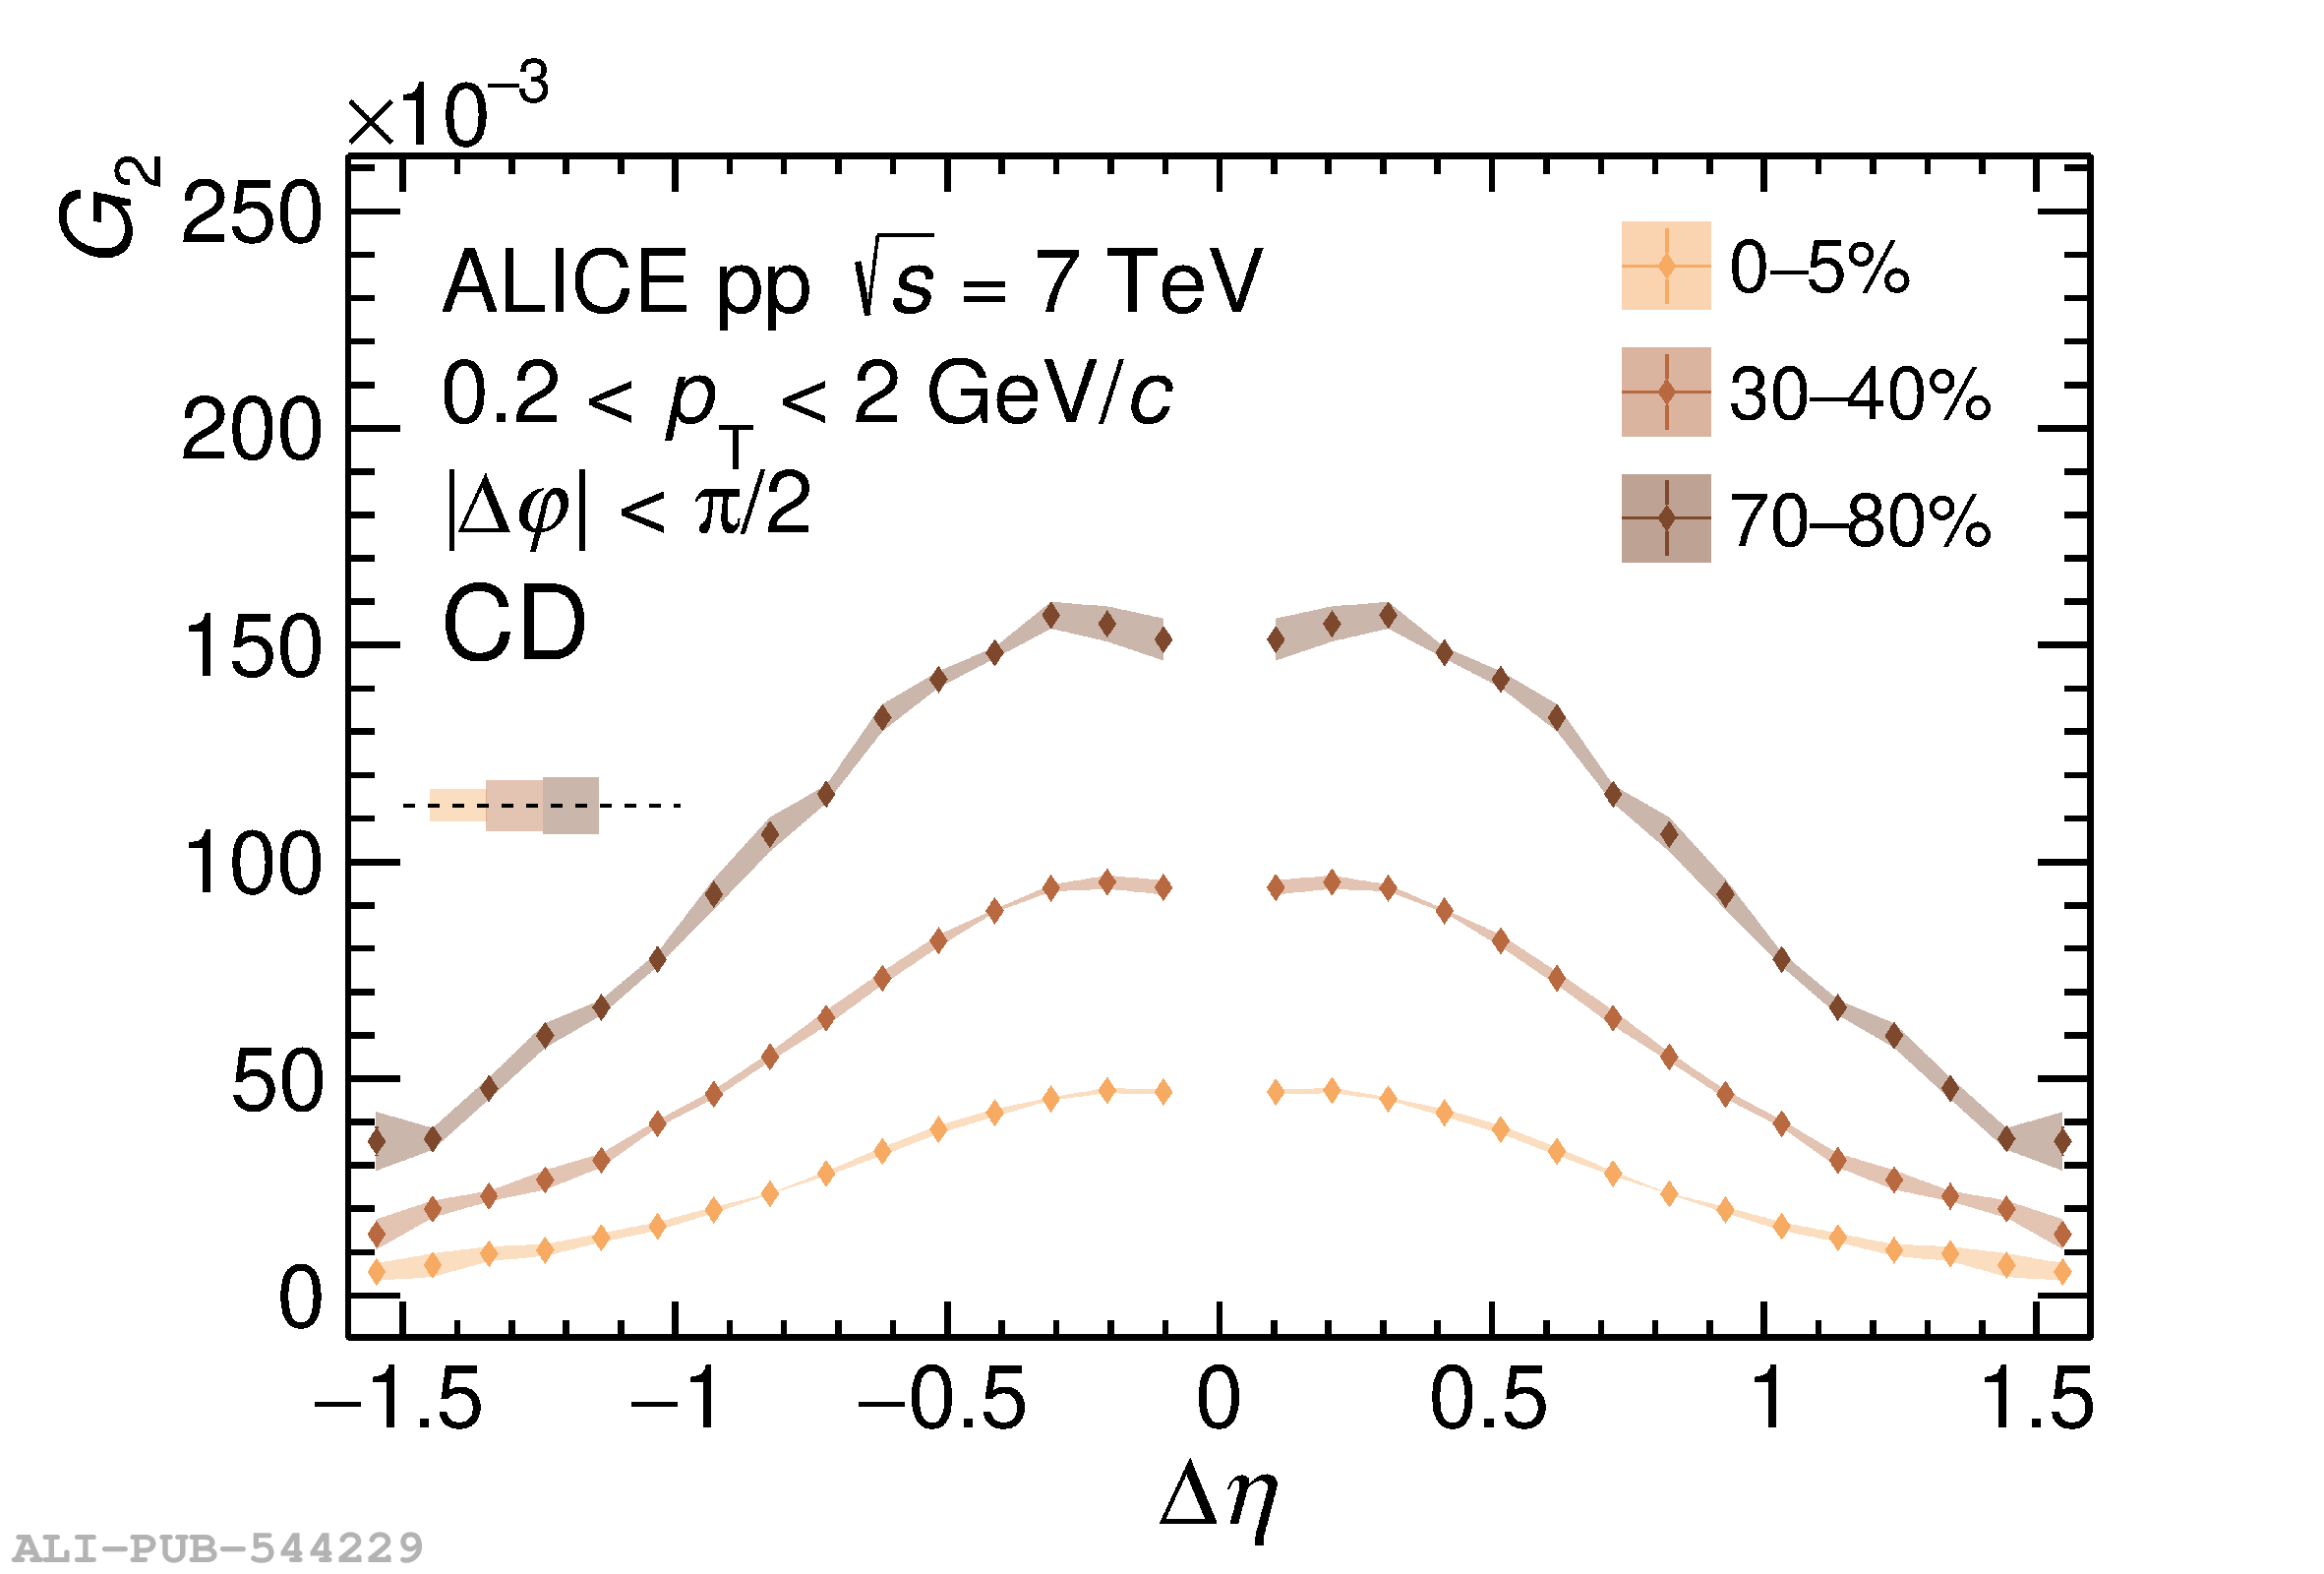 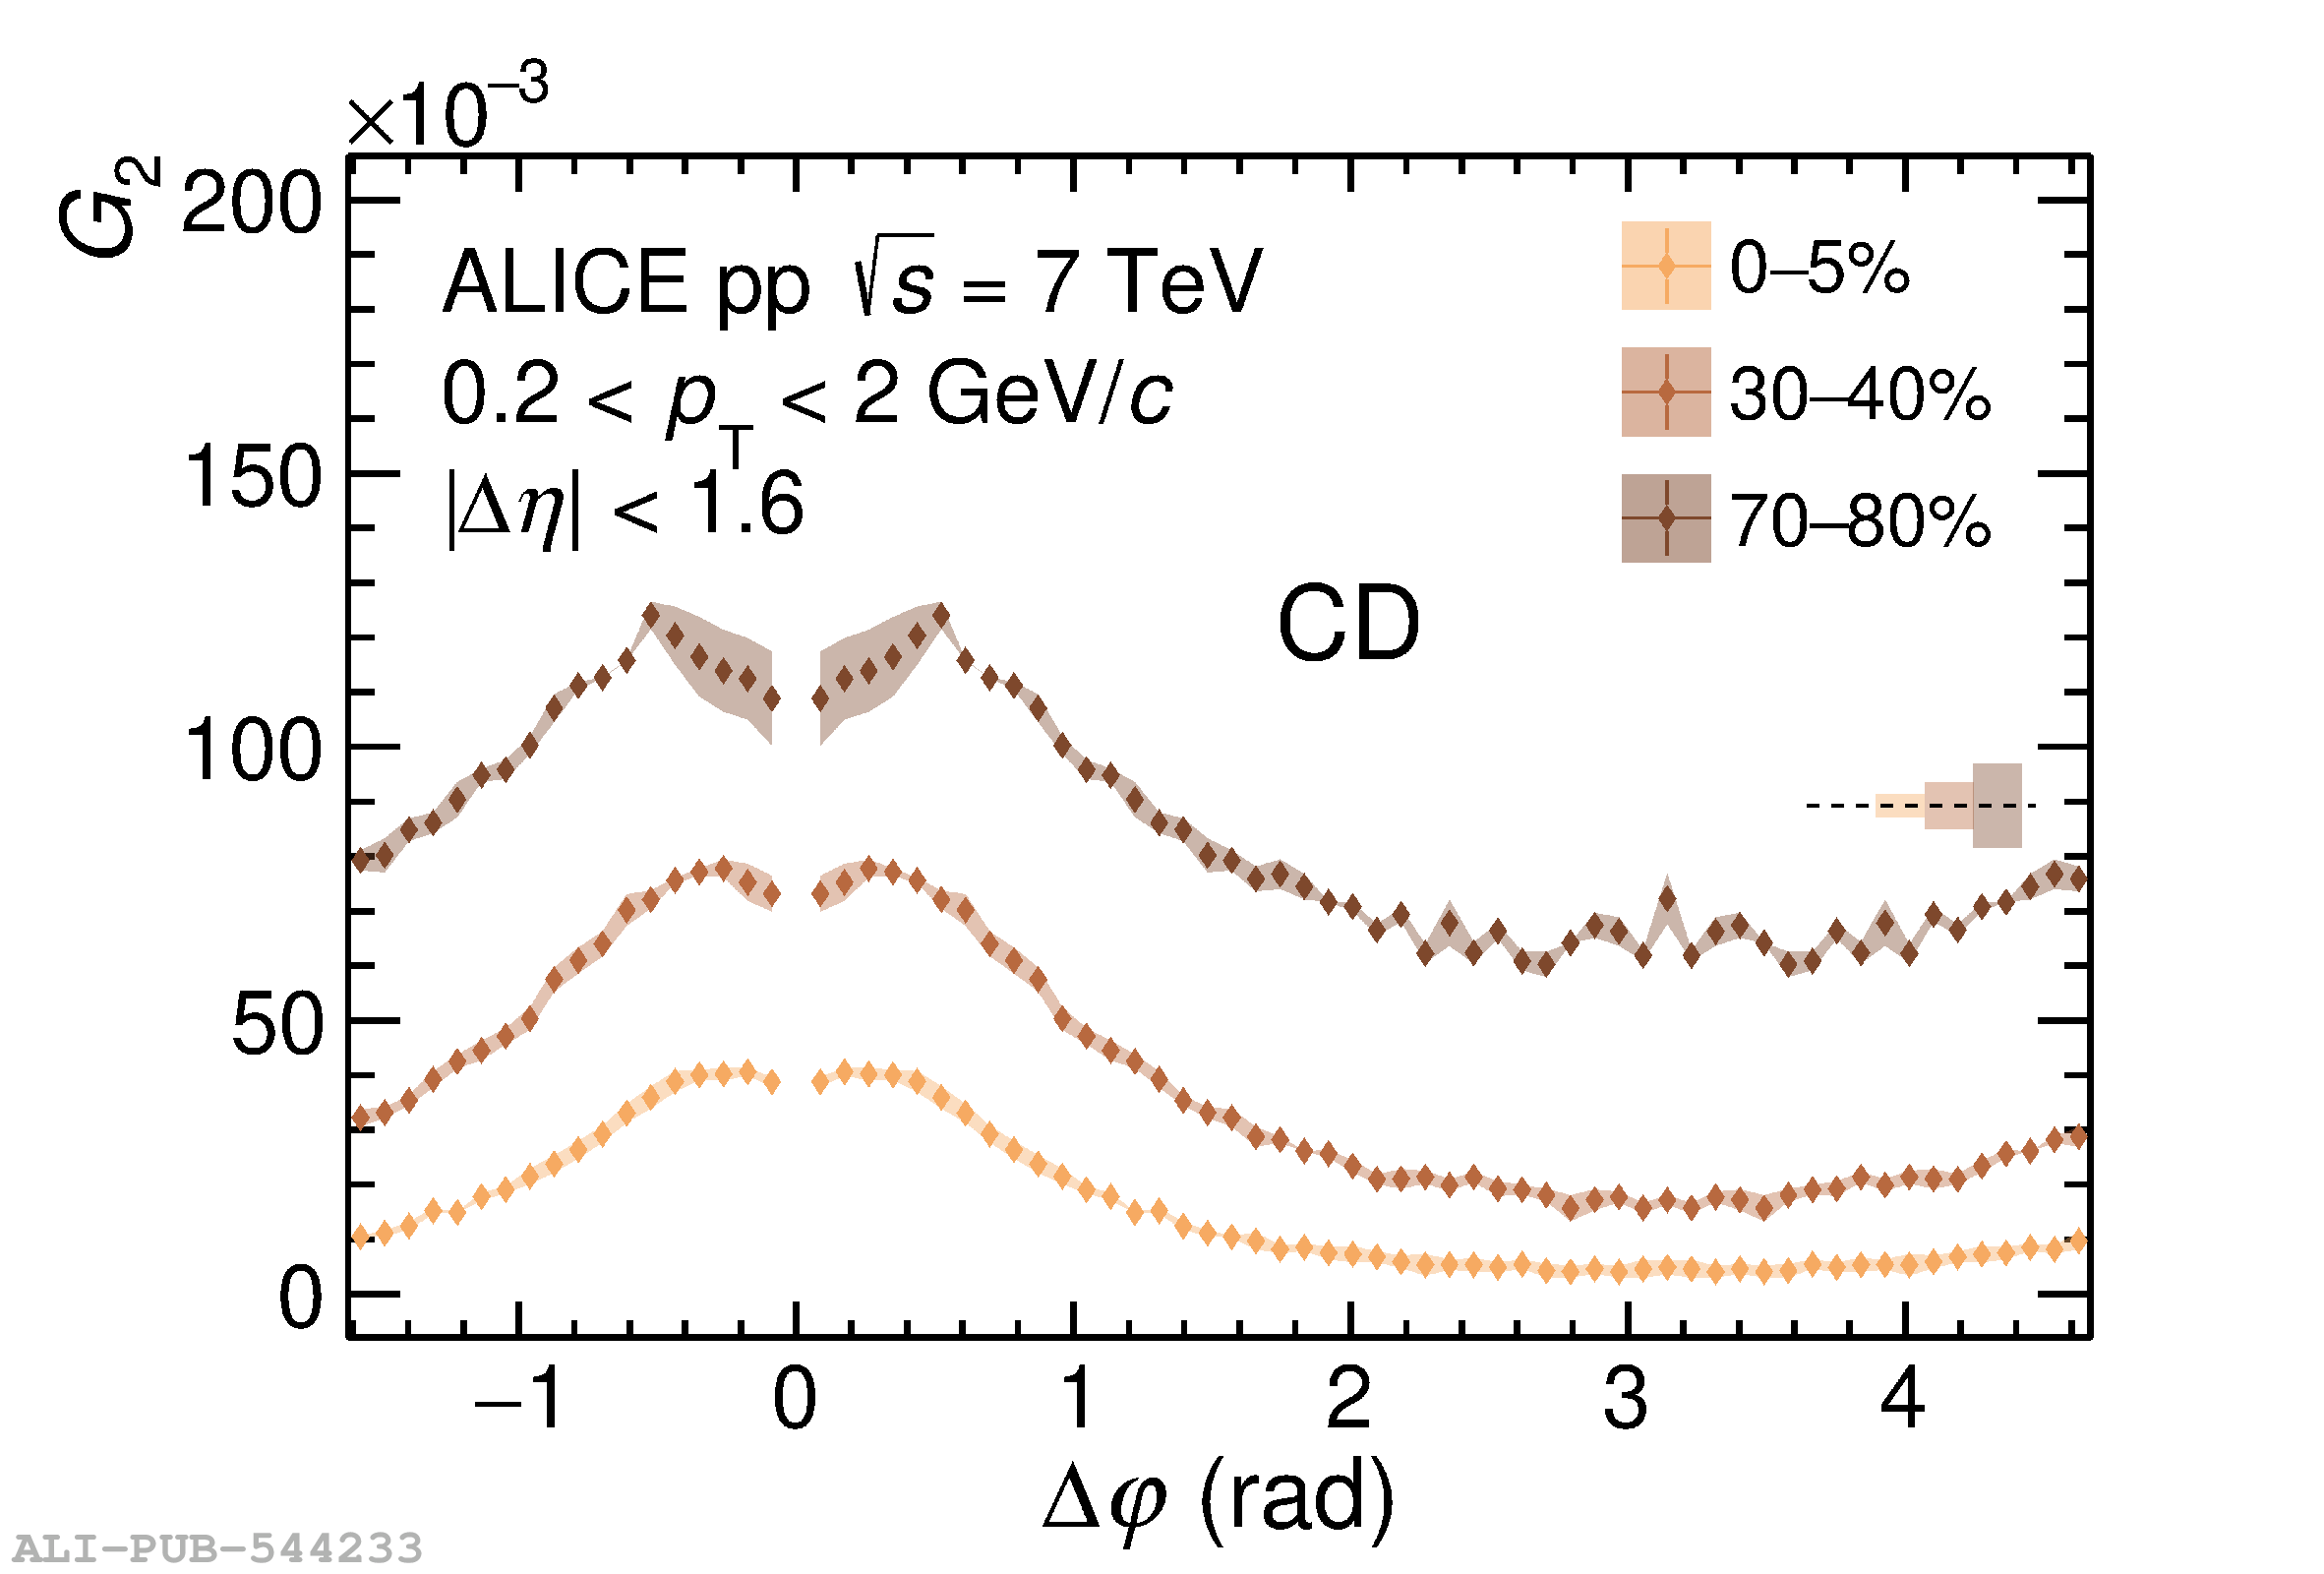   |