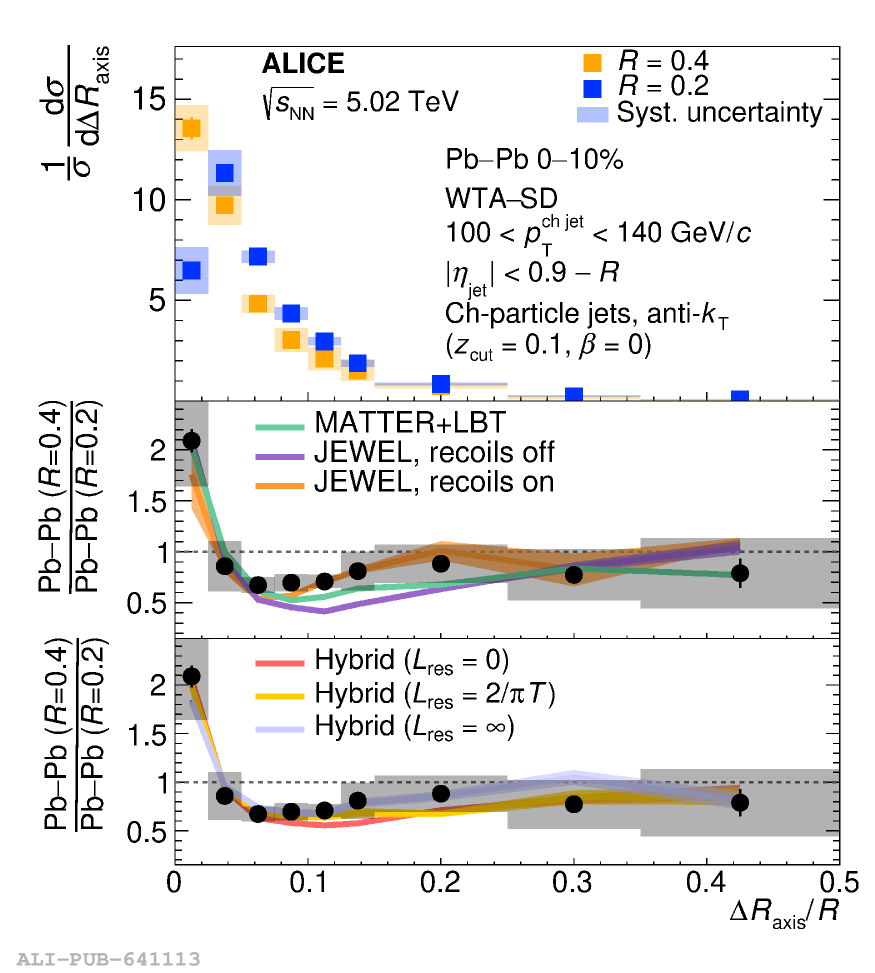
This paper presents the first measurement of the angle between different jet axes (denoted as $ΔR$) in Pb$-$Pb collisions. The measurement is carried out in the 0$-$10% most-central events at $\sqrt{s_{\rm NN}} = 5.02$ TeV. Jets are assembled by clustering charged particles at midrapidity using the anti-$k_{\rm T}$algorithm with resolution parameters $R=0.2$ and $0.4$ and transverse momenta in the intervals $40 <~ p_{\rm T}^{\rm ch jet} <~ 140$ GeV/$c$ and $80 <~ p_{\rm T}^{\rm ch jet} <~ 140$ GeV/$c$, respectively. Measurements at these low transverse momenta enhance the sensitivity to quark$-$gluon plasma (QGP) effects. A comparison to models implementing various mechanisms of jet energy loss in the QGP suggests that the observed narrowing of the Pb$-$Pb distribution relative to pp can be explained if quark-initiated jets are more likely to emerge from the medium than gluon-initiated jets. These new measurements disfavor intra-jet $p_{\rm T}$ broadening as implemented in a simple model calculation with the BDMPS formalism for energy loss in the QGP. The comparison of Pb$-$Pb and pp collisions shows sensitivity to the angular scale at which the QGP can resolve two independent splittings, favoring mechanisms that incorporate incoherent energy loss.
Phys.Rev.C 113 (2026) 4, 044905
HEP Data
e-Print: arXiv:2303.13347 | PDF | inSPIRE
CERN-EP-2023-046
Figure group
Figure 1
Left: schematic of how energetic partons split or fragment into lower-energy prongs or branches of partons down to a scale in which hadrons emerge. An algorithm can then be run over final-state hadrons to cluster them into jets. An inverse declustering algorithm can be used to recursively explore the jet substructure. Right: schematic showing that different jet axes (solid arrows) can be selected from a jet to construct the $\DeltaR$ observable. The Standard axis (represented by a black arrow) is constrained by all the jet constituents (represented by dashed arrows). The SD axis (represented by a dark blue arrow) is determined by the particles left in the jet after grooming (blue and dark red arrows). Finally, the WTA axis (represented by a pink arrow) tends to be aligned with the most energetic constituent. | 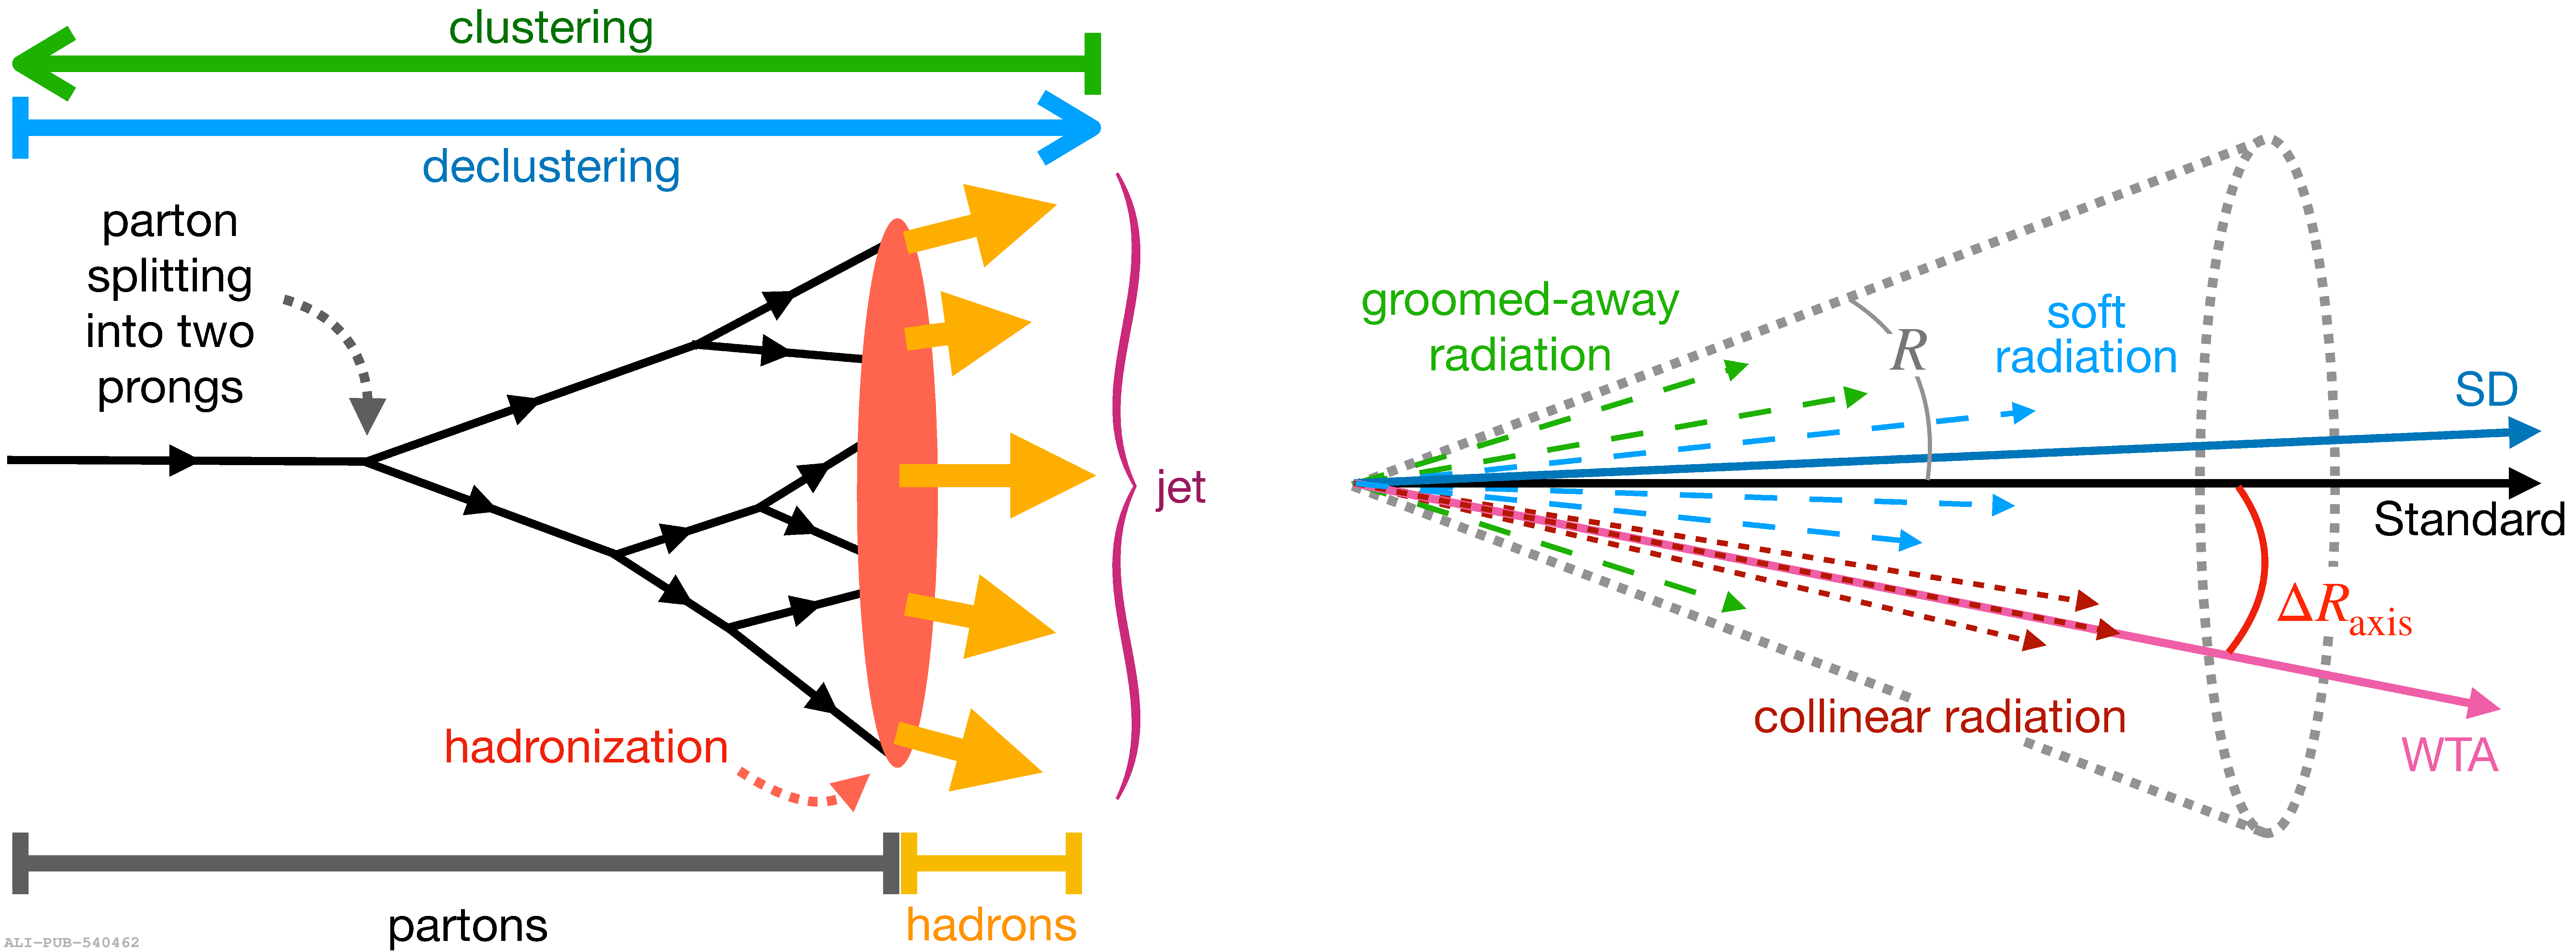 |
Figure 2
Top panels: fully corrected \PbPb{} and \pp{} $\DeltaR^{\rm WTA-Standard}$ distributions in the \pTchjet{} intervals $[40,60]$ (left), and $[60,80]$ (right) \GeVc{} for jets of $R=0.2$ The \pp{} baseline is taken from Ref. \citenum{ALICE:2022rdg} Central and bottom panels: measured \PbPb/\pp{} ratio in black, as well as predictions from a selection of jet quenching models. | 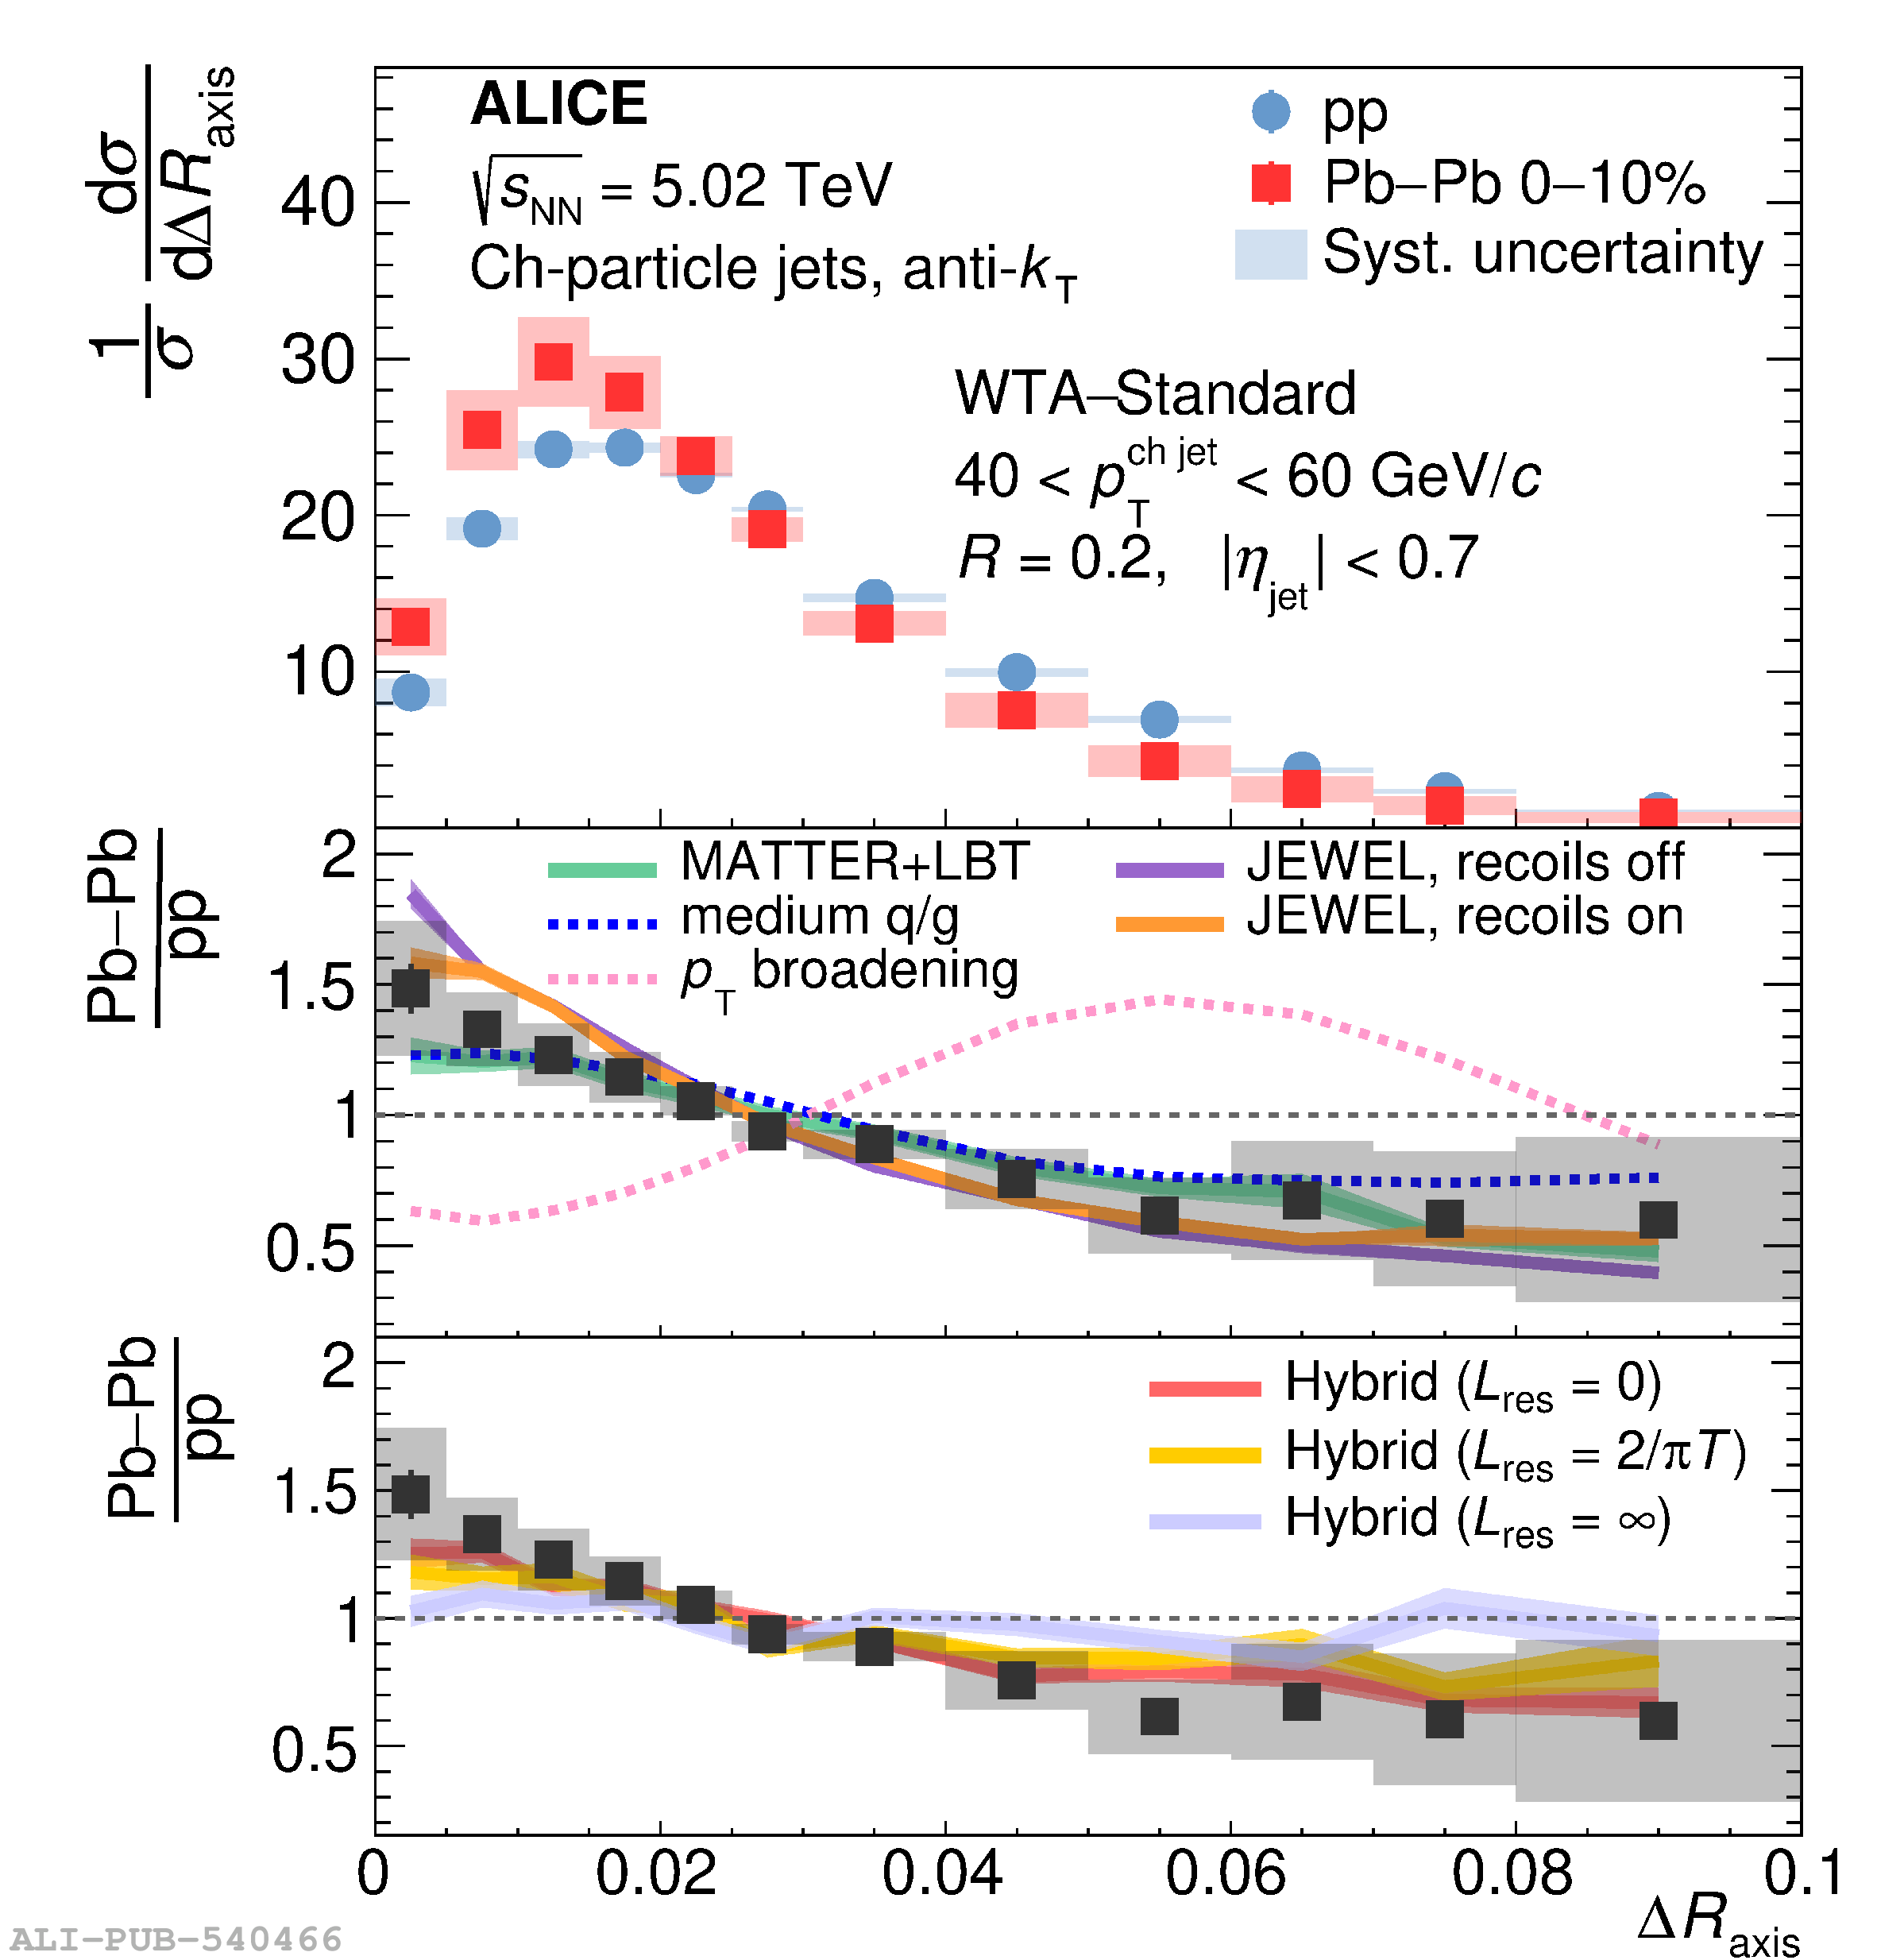  |
Figure 3
Top panels: fully corrected \PbPb{} $\DeltaR^{\rm WTA-Standard}/R$ (left), and $\DeltaR^{\rm WTA-SD}/R$ with $(\zcut=0.2,\beta=0)$ (right) distributions in the \pTchjet{} interval $[100,140]$ \GeVc Central and bottom panels: measured $\PbPb (R=0.4)/\PbPb(R=0.2)$ ratio in black, as well as predictions from a selection of jet quenching models. |  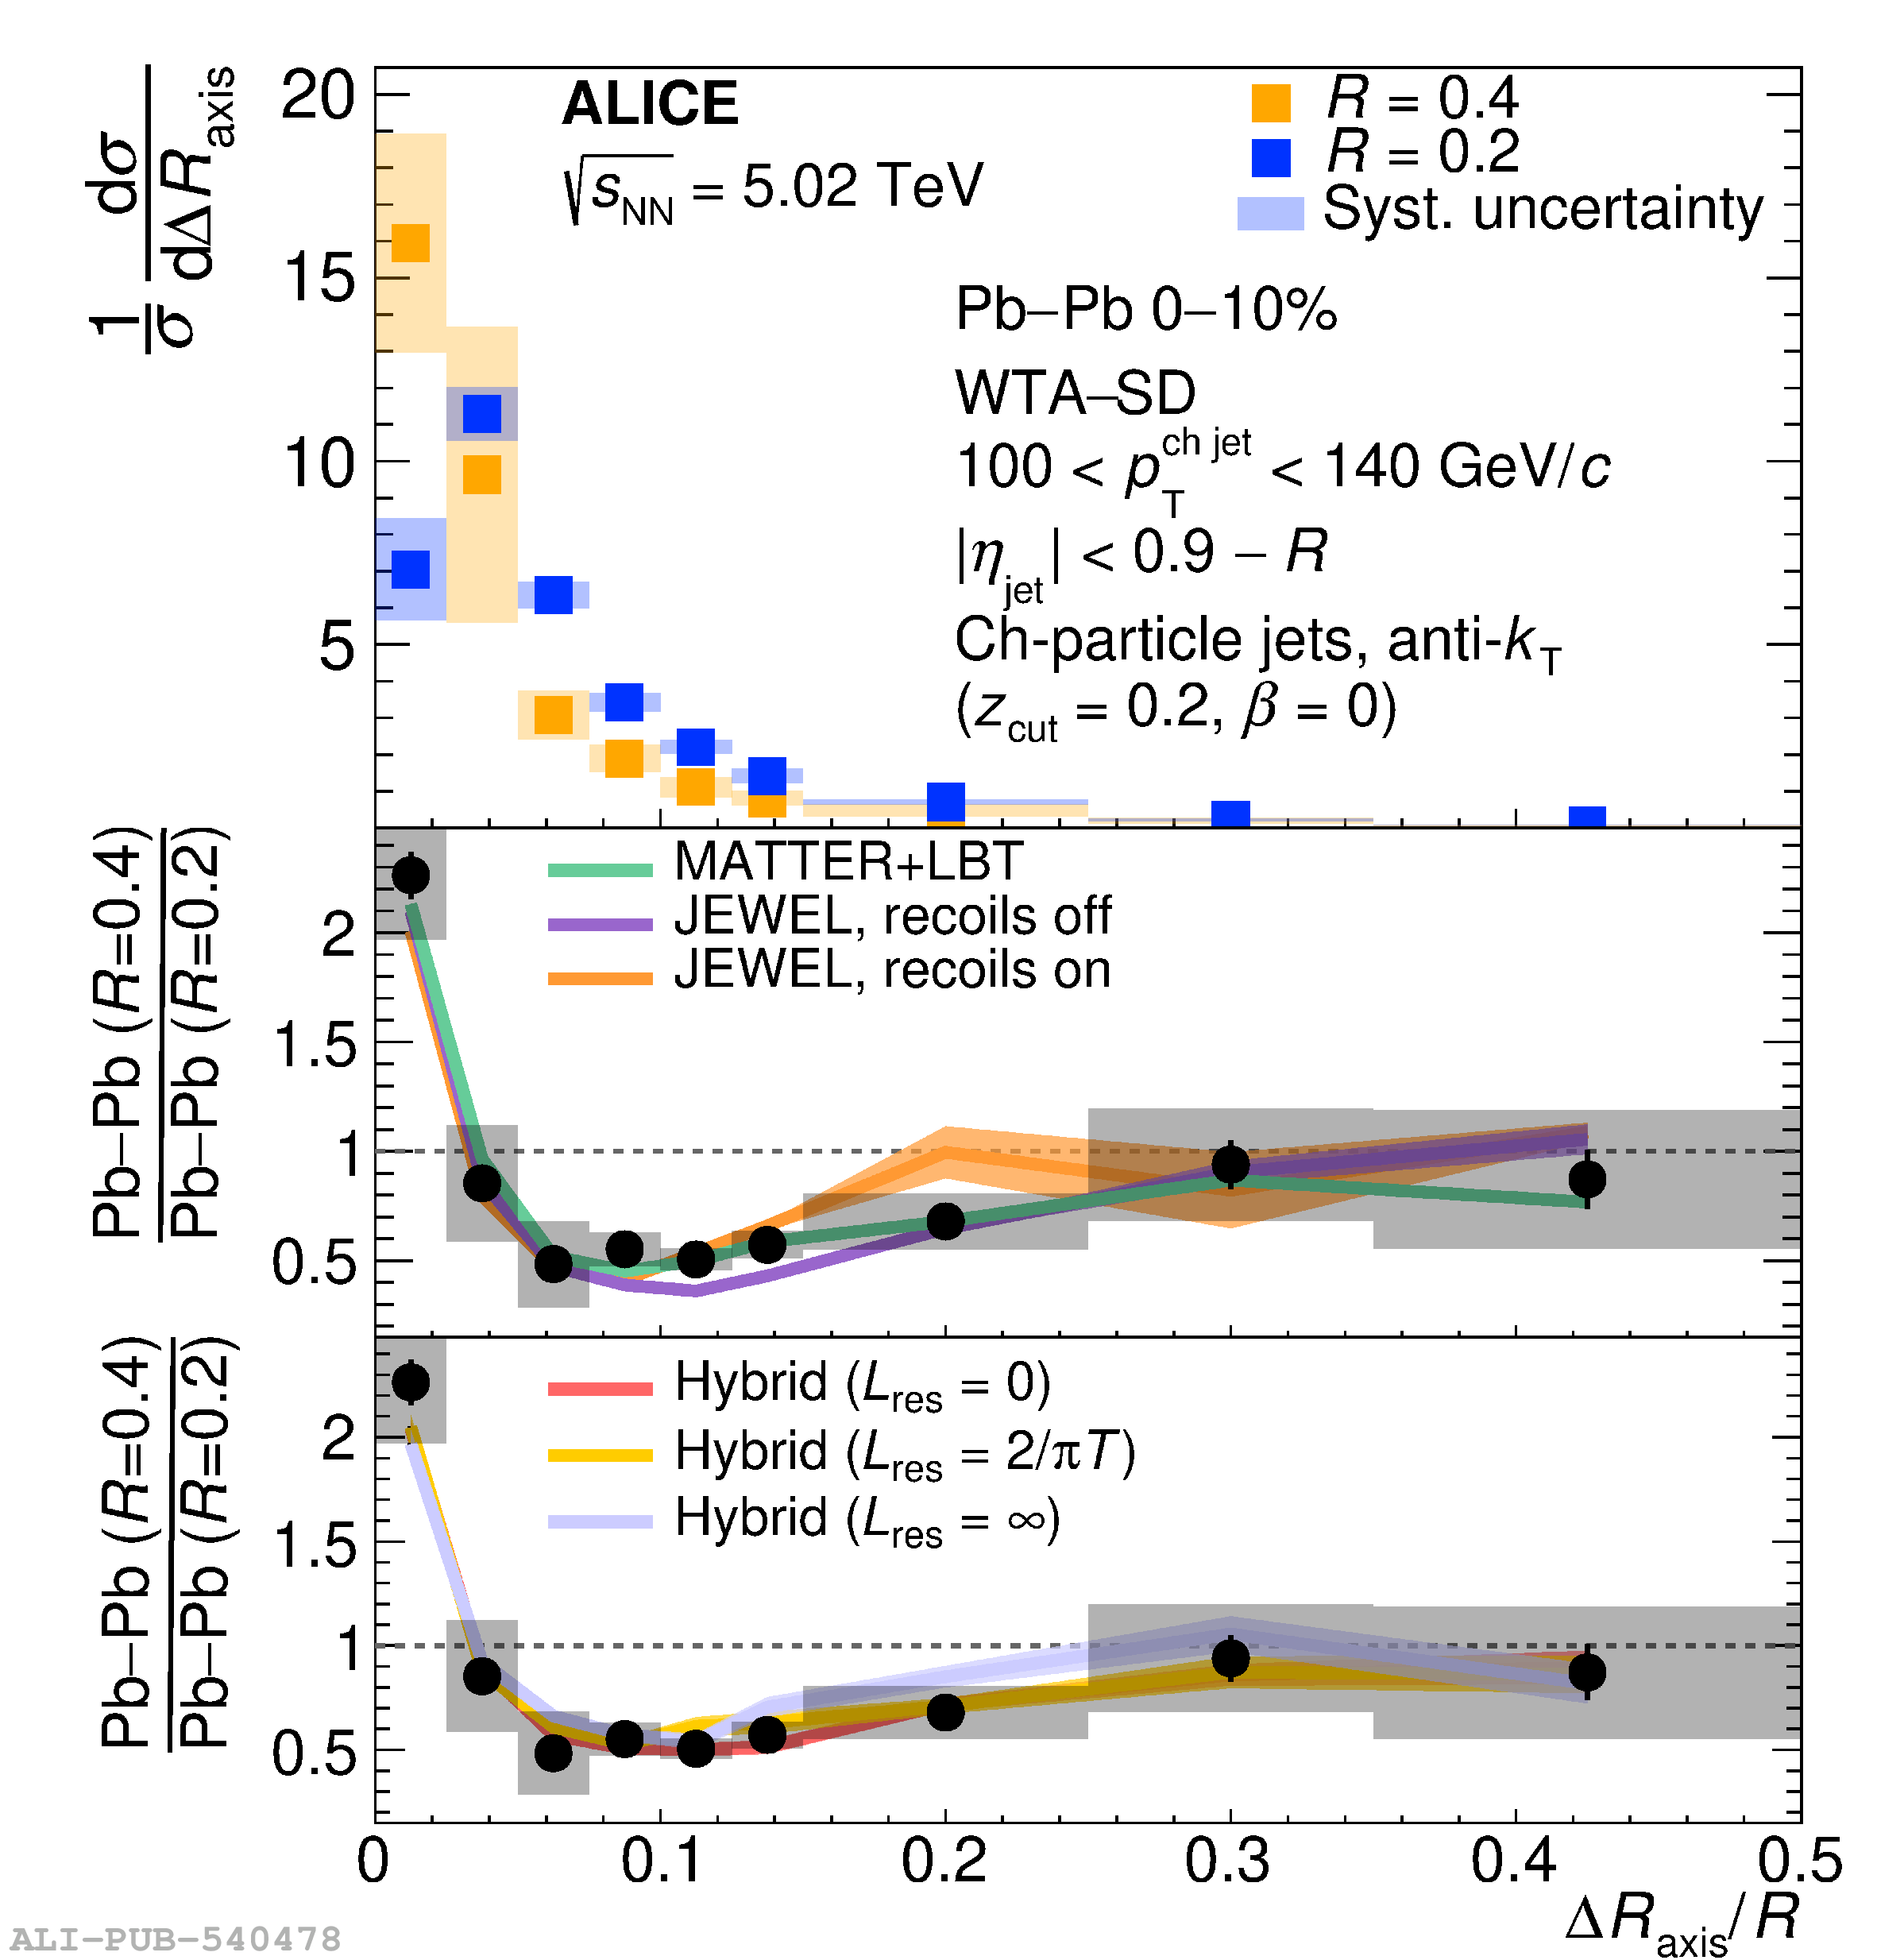 |