Measurement of $ω$ meson production in pp collisions at $\sqrt{s}$ = 13 TeV

The $p_{\rm T}$-differential cross section of $\omega$ meson production in pp collisions at $\sqrt{s}= 13$ TeV at midrapidity ($|y|<~0.5$) was measured with the ALICE detector at the LHC, covering an unprecedented transverse-momentum range of $1.6 <~p_{\rm T}<~ 50$ GeV/$c$. The meson is reconstructed via the $\omega\rightarrow\pi^+\pi^-\pi^0$ decay channel. The results are compared with various theoretical calculations: PYTHIA8.2 with the Monash 2013 tune overestimates the data by up to 50%, whereas good agreement is observed with Next-to-Leading Order (NLO) calculations incorporating $\omega$ fragmentation using a broken SU(3) model. The $\omega/\pi^0$ ratio is presented and compared with theoretical calculations and the available measurements at lower collision energies. The presented data triples the $p_{\rm T}$ ranges of previously available measurements. A constant ratio of $C^{\omega/\pi^0}=0.578\pm0.006~\text{(stat.)}\pm 0.013~\text{(syst.)}$ is found above a transverse momentum of $4$ GeV/$c$, which is in agreement with previous findings at lower collision energies within the systematic and statistical uncertainties.


J. High Energ. Phys. 04 (2025) 067
HEP Data
e-Print: arXiv:2411.09432 | PDF | inSPIRE
CERN-EP-2024-303
Figure group

Figure 1

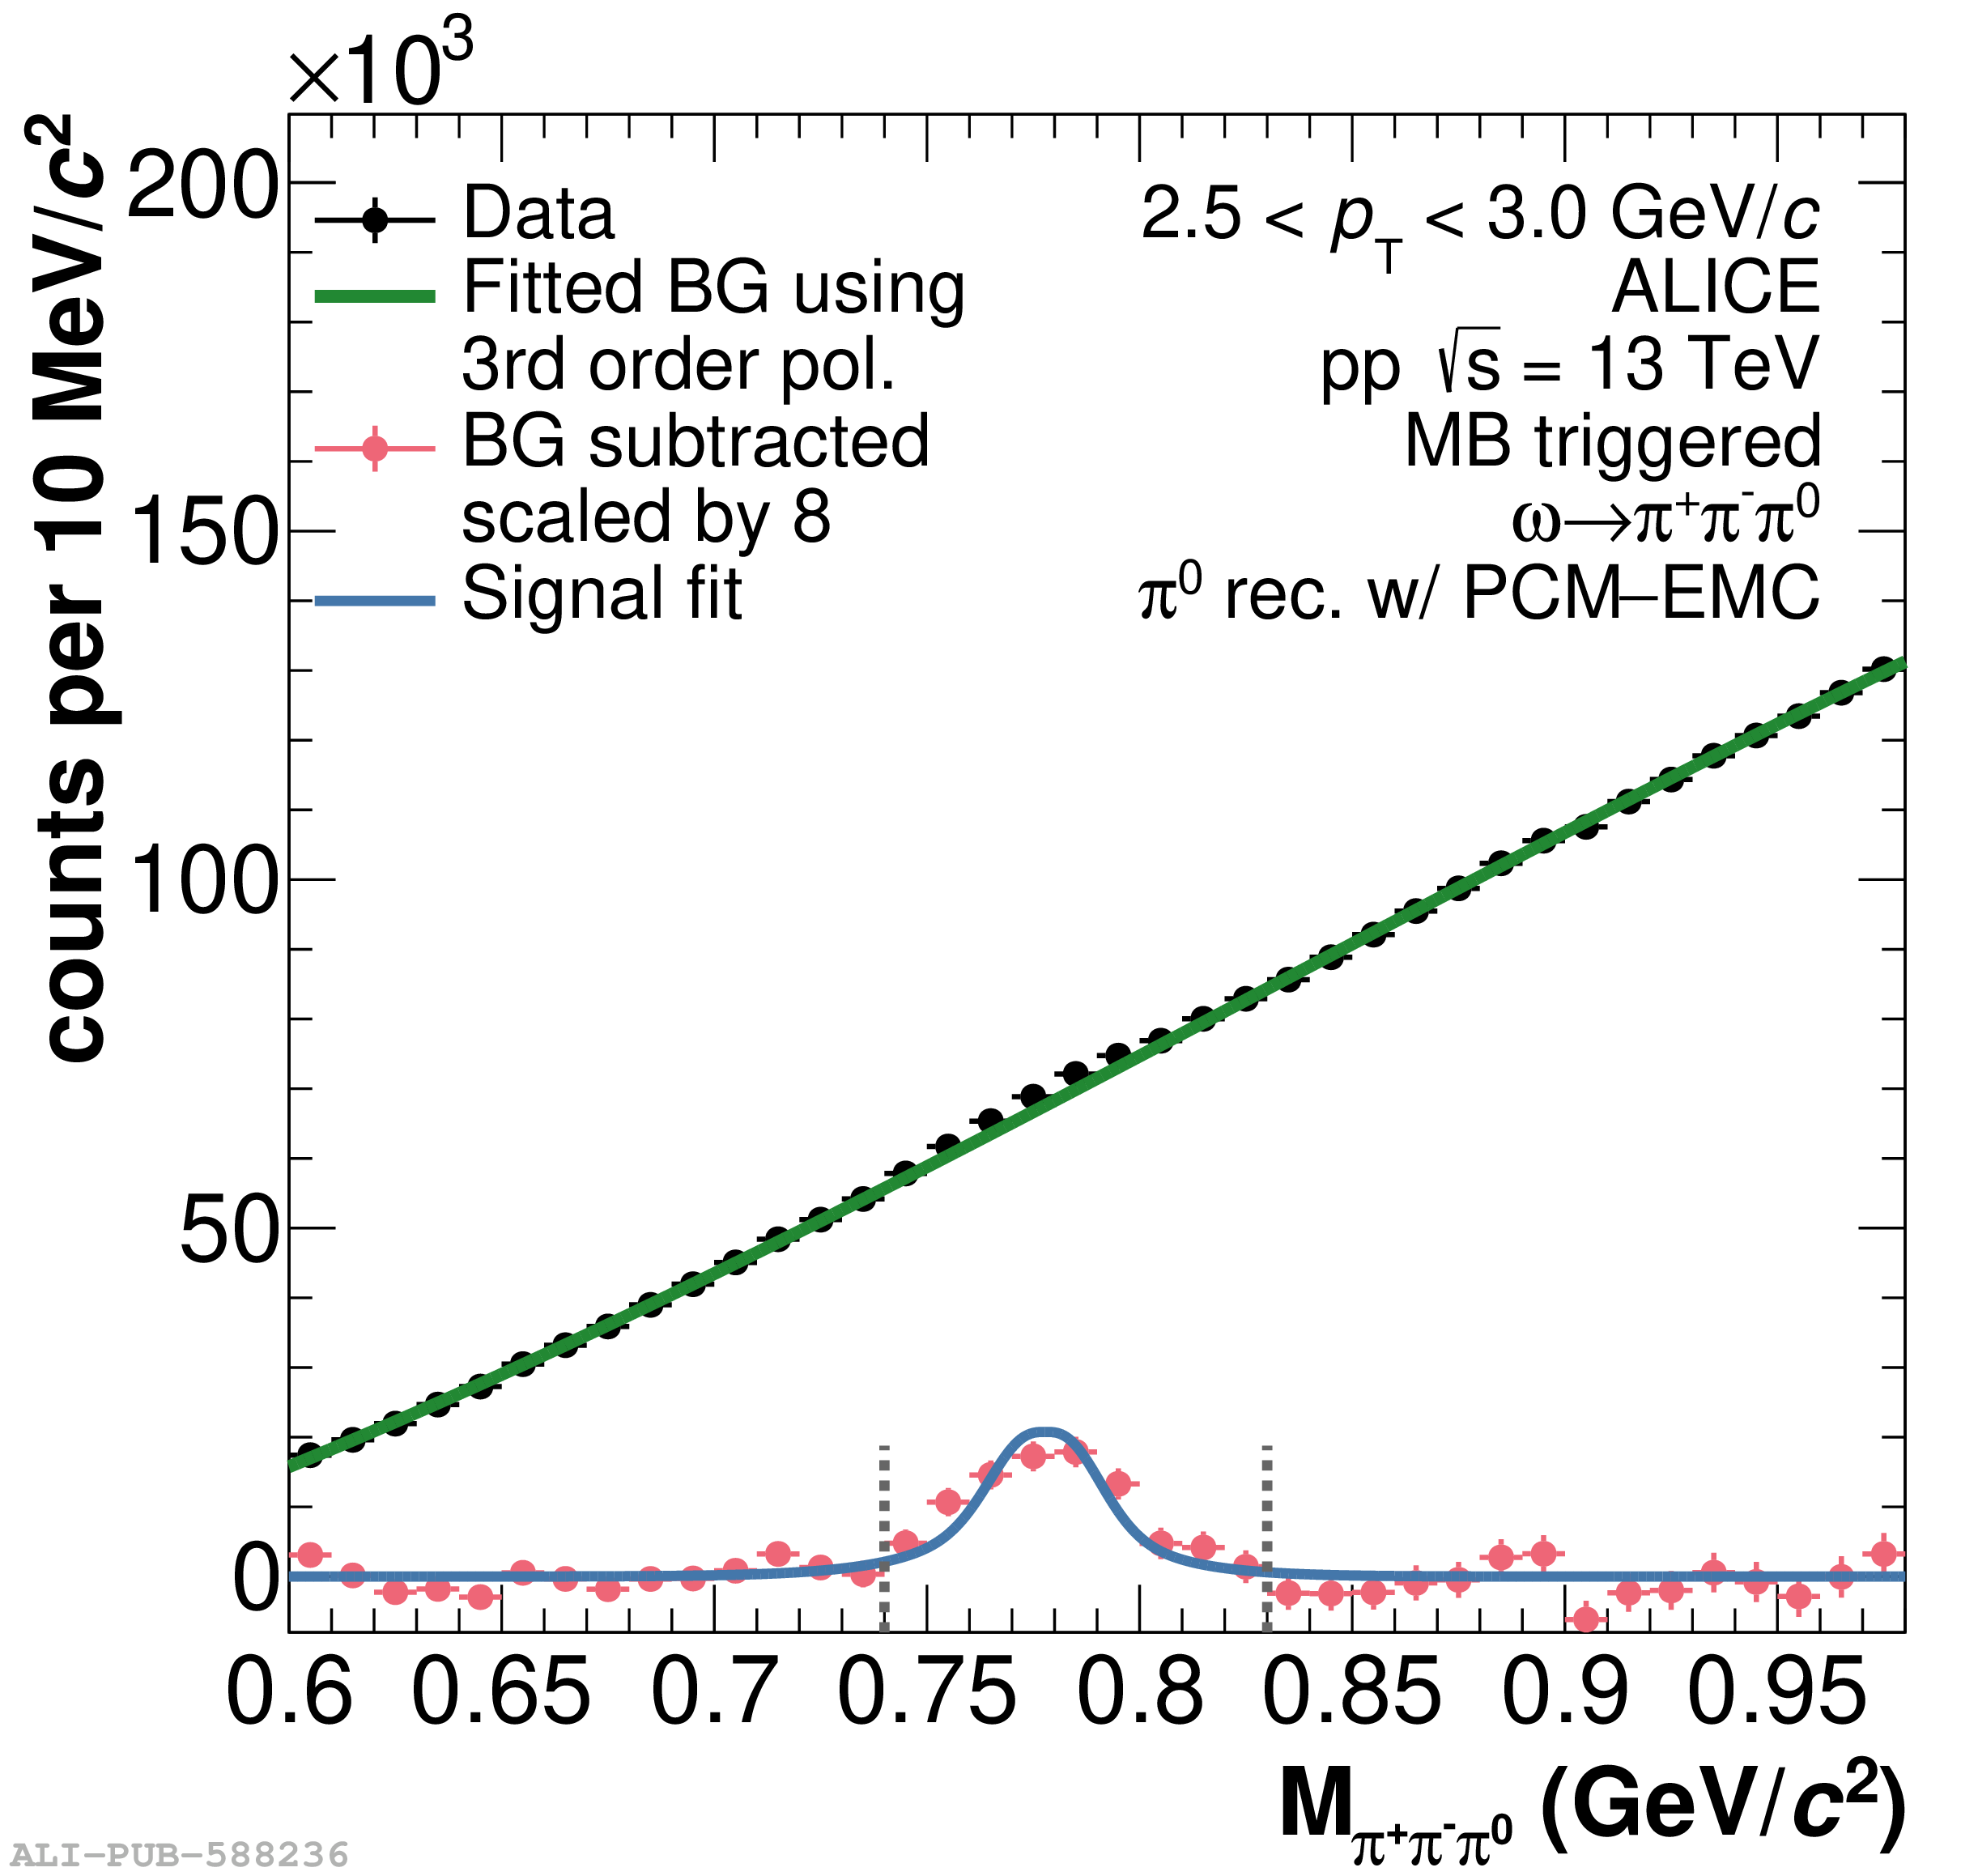
Invariant mass distributions of $\pi^+\pi^-\pi^0$ candidates shown in the vicinity of the nominal $\omega$ mass in exemplary $p_{\rm T}$ intervals. Each panel displays a different $\pi^0$ reconstruction method, which is indicated in the respective panel and described in the text. A third-order polynomial is used to describe the background, which is subtracted from the distribution and the obtained signal is fitted with a Gaussian with two exponential tails. The integration range used to obtain the raw yields via bin-by-bin counting is indicated by vertical gray lines.

Figure 2

Correction factors applied to the raw $\omega$ yields according to Eq.7.1 for the five $\pi^0$ reconstruction methods, as indicated in the legend. The factors include the reconstruction efficiency $\epsilon_{\text{rec}}$ and the geometrical acceptance $A$ of the involved detectors.

Figure 3

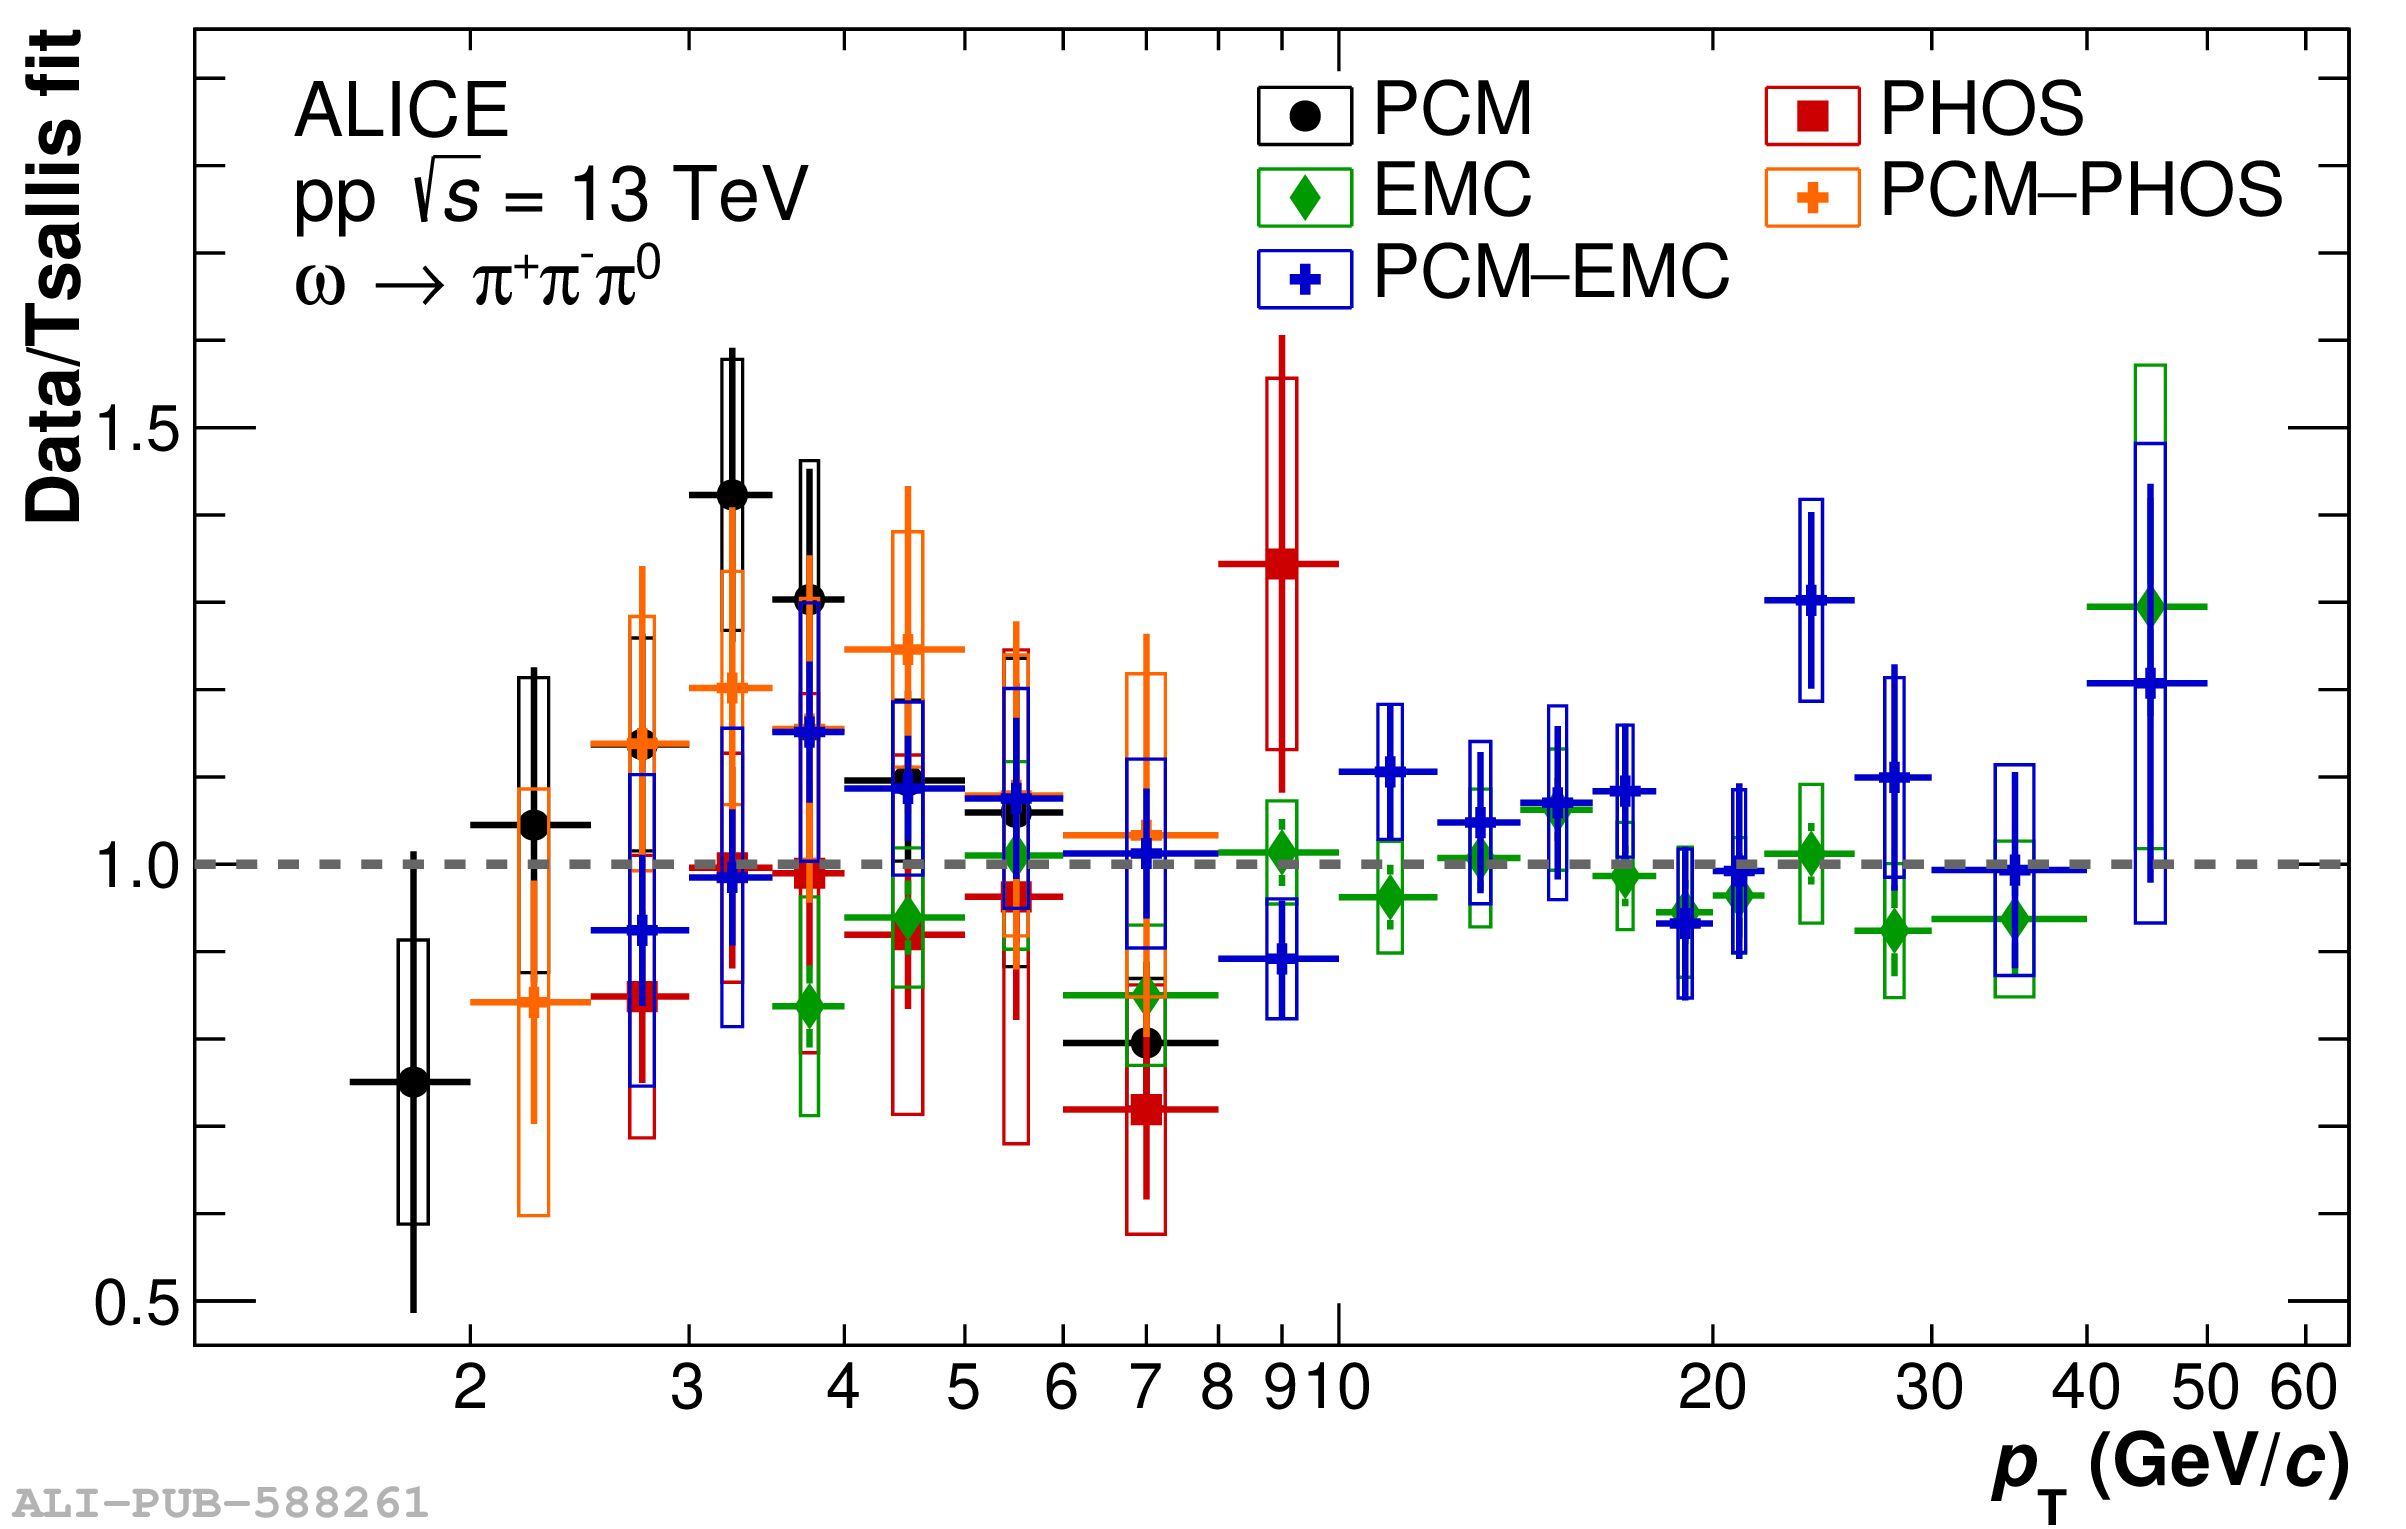
Ratios of the $\omega$ production cross section obtained using five different $\pi^0$ reconstruction methods with respect to a Levy-Tsallis fit of the combined measurement. The fit parameters are given in Table 2 together with the reduced $\chi^2$ of the converged fit. The statistical and systematic uncertainties of the individual measurements are given in Table 1 and are represented by vertical bars and boxes, respectively.

Figure 4

Invariant cross section of $p+p\rightarrow\omega+X$ production at midrapidity in pp collisions at $\sqrt{s}= 13$ TeV compared to theoretical predictions. The cross section is parametrized using a Levy-Tsallis function (dashed grey line), where the fit parameters are given in Table 2. The systematic uncertainty of the measurement is denoted by boxes, excluding the normalization uncertainty of 1.58%, which is shown separately as a grey box in the bottom panel of the figure. To account for the finite width of each $p_{\rm T}$-interval, the data points are shifted according to the underlying spectrum, as described by the fit. The red line represents the theoretical prediction obtained using the PYTHIA8.2 [17] event generator with the Monash 2013 tune [46]. The width of the line indicates the statistical uncertainty of the prediction. The blue dashed line shows a NLO calculation [14] incorporating $\omega$ fragmentation based on a broken SU(3) model, where all scales are chosen to be $\mu= p_{\rm T}$ and the blue shaded band denotes the scale uncertainty. The bottom panel shows the ratio of the data, as well as the theoretical predictions to the Levy-Tsallis parametrization.

Figure 5

Ratio of $\omega/\pi^0$ production as a function of transverse momentum for pp collisions at $\sqrt{s}= 13$ TeV. The data is compared to various measurements at lower collision energies ranging from $\sqrt{s}=62$ to $7000$ GeV. The data is confronted with various theoretical calculations, which are given in the legend and described in the text. In addition, the ratio obtained from $m_{\rm T}$-scaling of the measured $\pi^0$ meson cross section is shown.