(a) Measured values of $\nu_{\rm dyn}[\rm K_{\rm S}^{0},\rm K^{\pm}]$ plotted as a function of the width of the acceptance $\Delta\eta$ in the 0--5\% and 5--10\% collision centrality ranges are compared HIJING (generator level) calculations scaled by a factor of 18. (b) Values of $\nu_{\rm dyn}[\rm K_{\rm S}^{0},\rm K^{\pm}]$ shown in panel (a) are scaled by $\alpha$ . HIJING values are scaled by a factor of 15 for easier comparison with the data. The statistical and systematic uncertainties are represented as bar and boxes, respectively. |  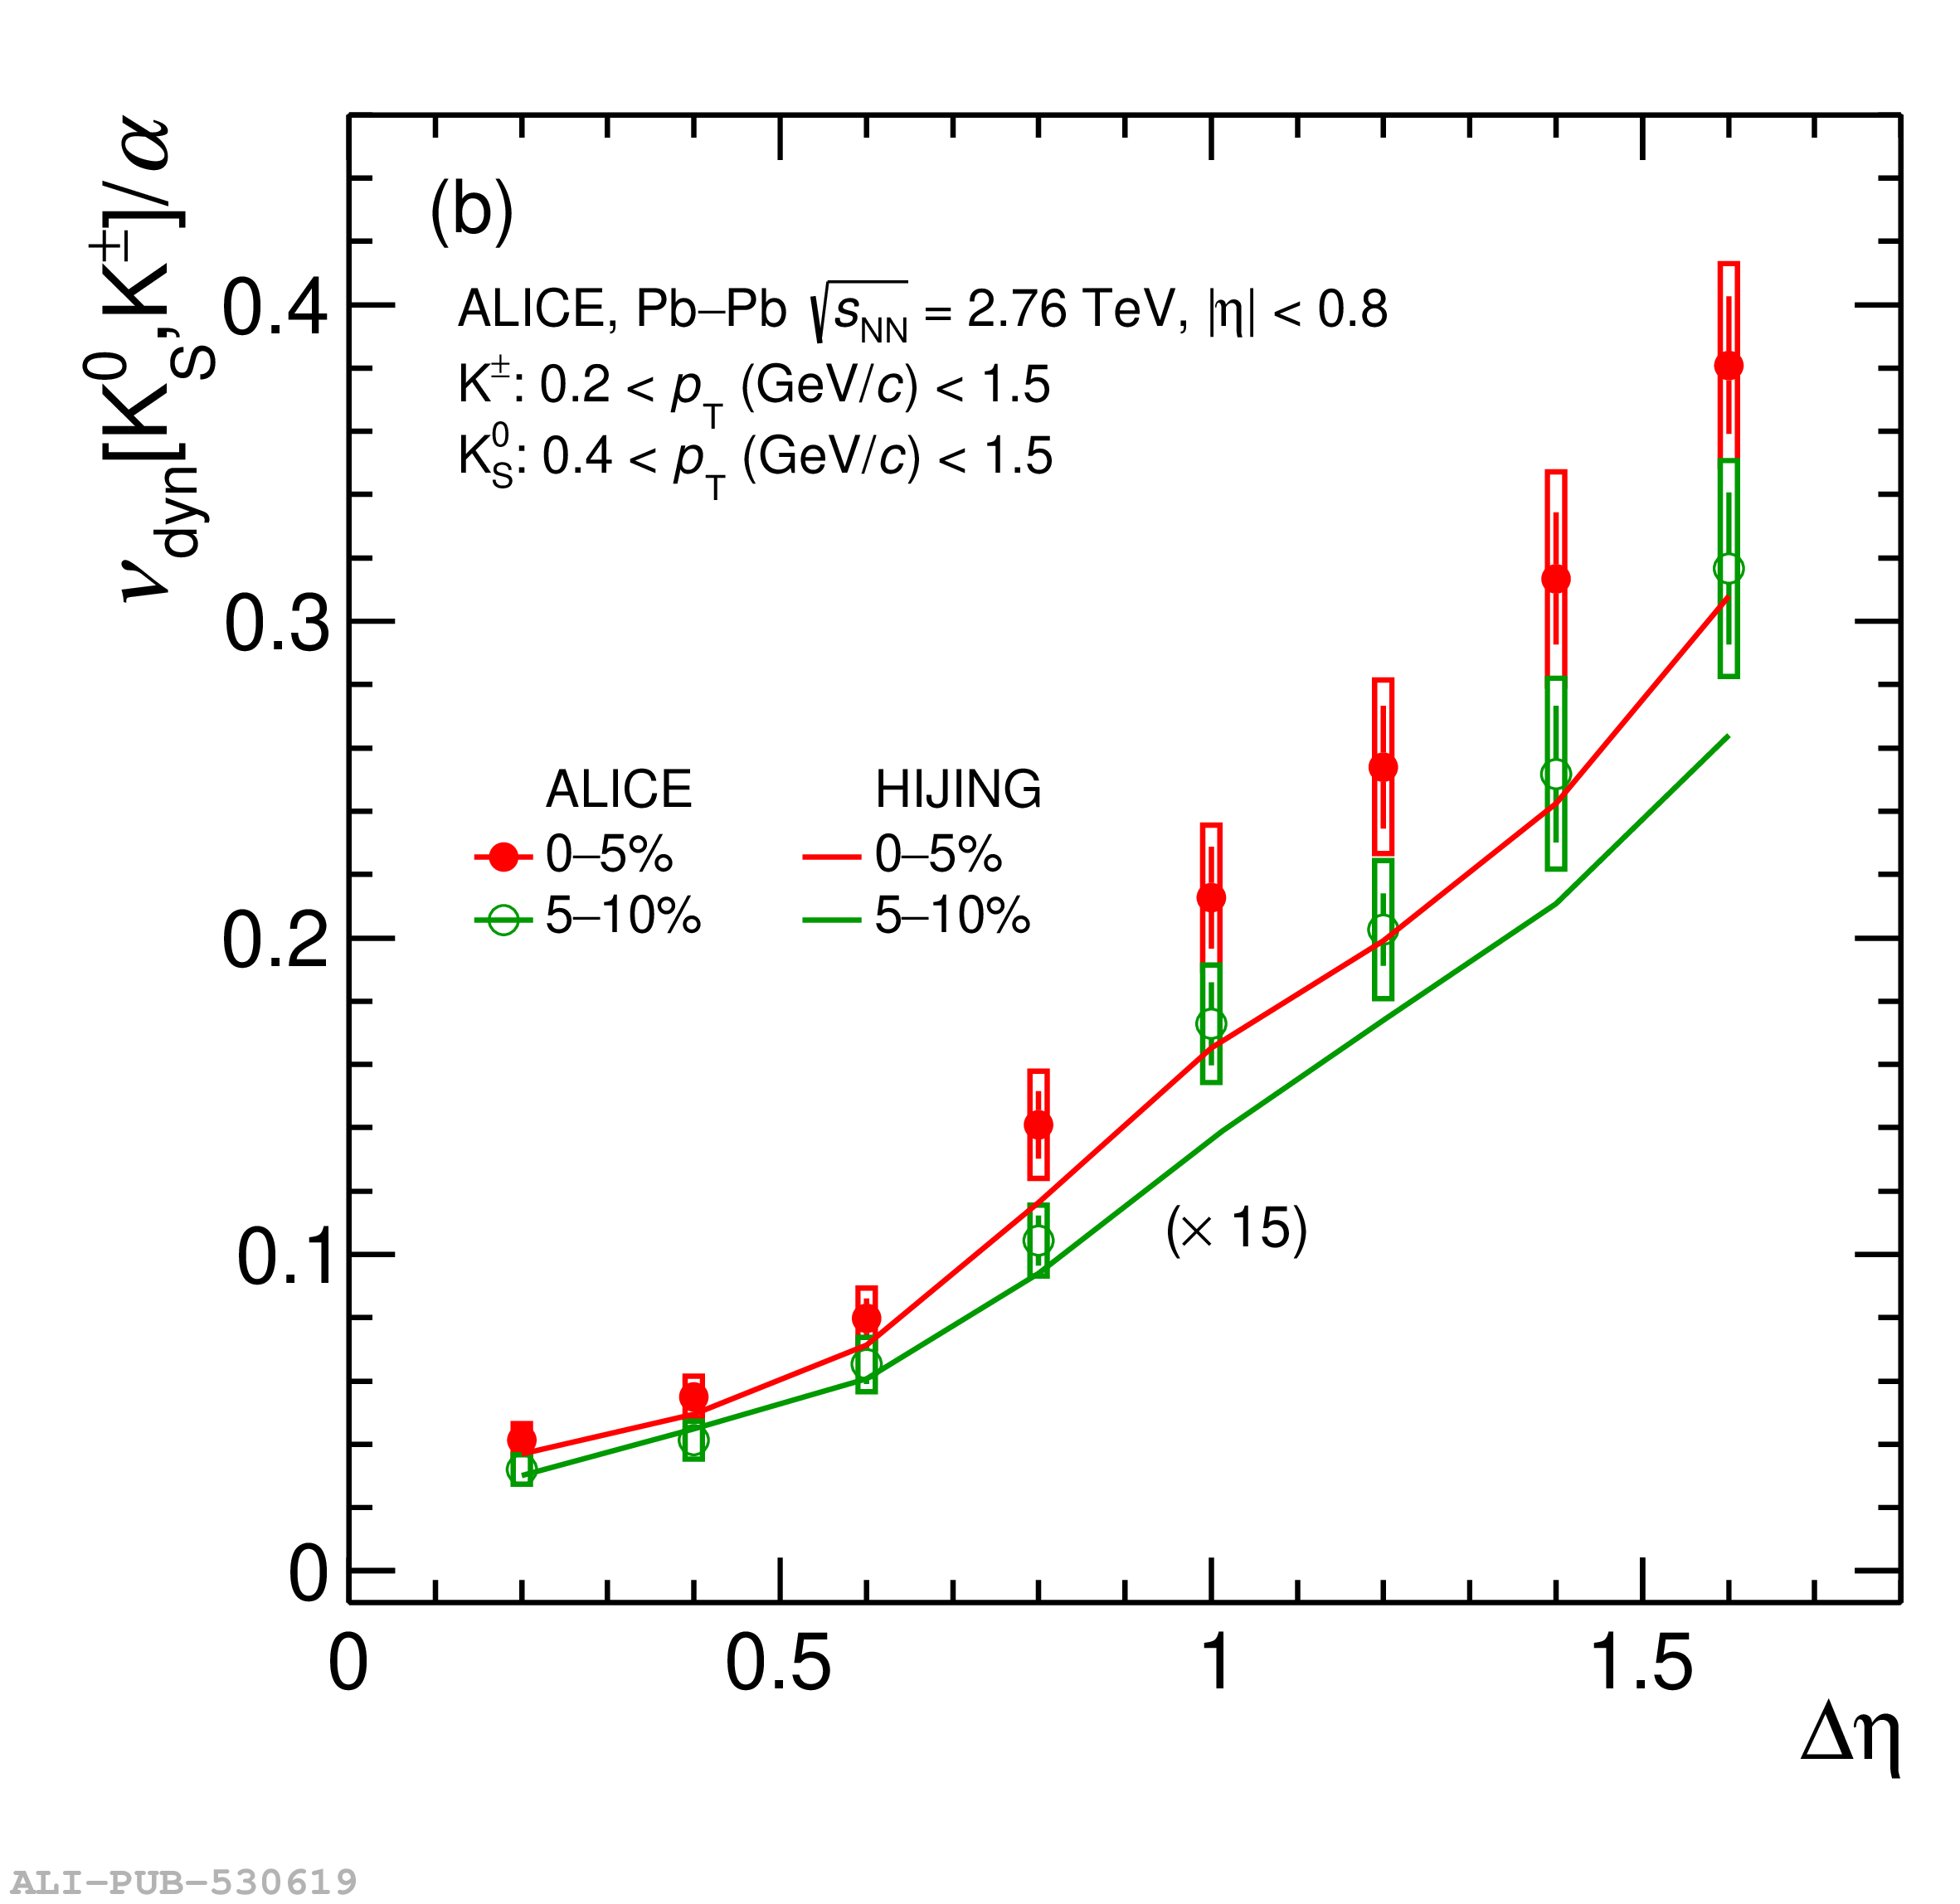 |