Invariant mass distribution of $\pi^++\pi^-$ pairs measured in central (0--5$\%$) \PbPb\ collisions. The yellow and black solid lines show a second order polynomial fit of the combinatorial background and a Gaussian+second order polynomial fit to the invariant mass spectrum, respectively. The vertical dash lines delineate the mass range used for the determination of neutral-kaon yields. Given the red-brown area, which corresponds to combinatorial background, cannot be properly assessed event by event, the average of the yellow areas is used as proxy, event-by-event, to estimate the true combinatorial yield represented by the red-brown area. | 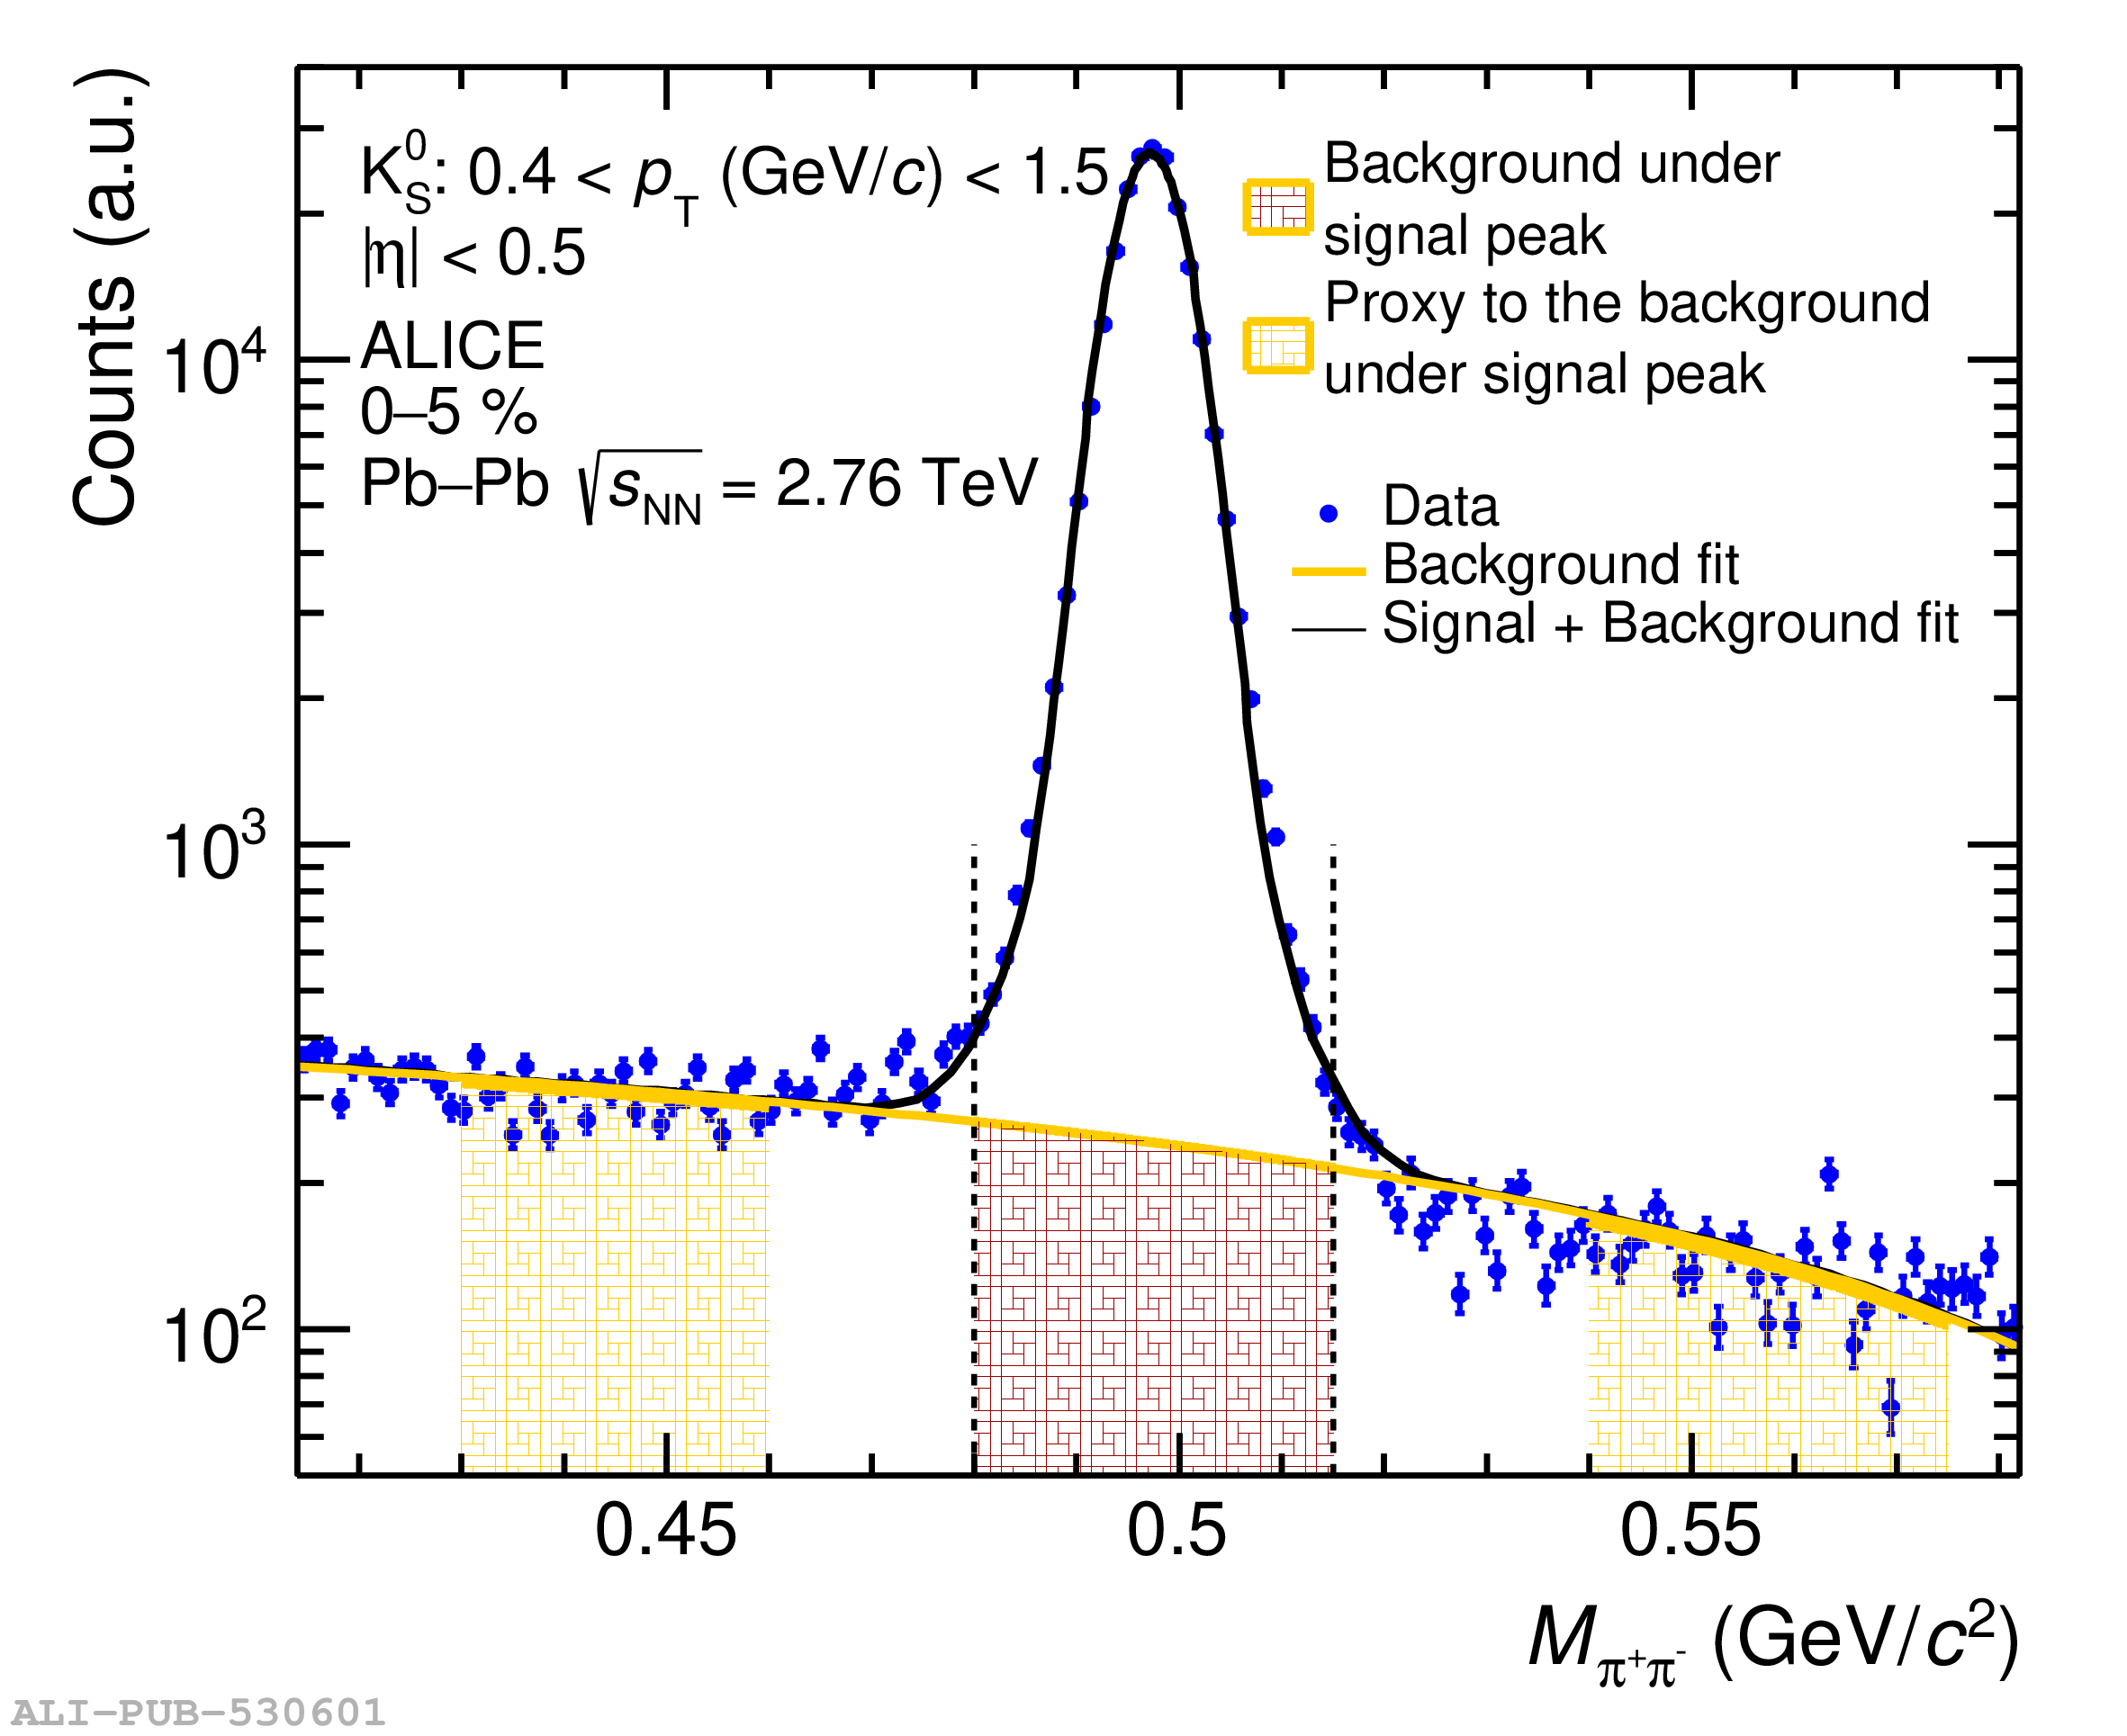 |