\footnotesize{Dimuon invariant mass distribution in the lowest (top panels) and highest (bottom panels) \Ntrkcorr intervals in \pp collisions at $\sqrt{s} =$ 5.02 (left) and $\sqrt{s} = 13$ TeV (right). Example fit functions are shown by lines for \jpsi, $\psi(2\rm S)$ signal, background and the combination of signal with background. The data points with error bars are represented by scattered points.}. | 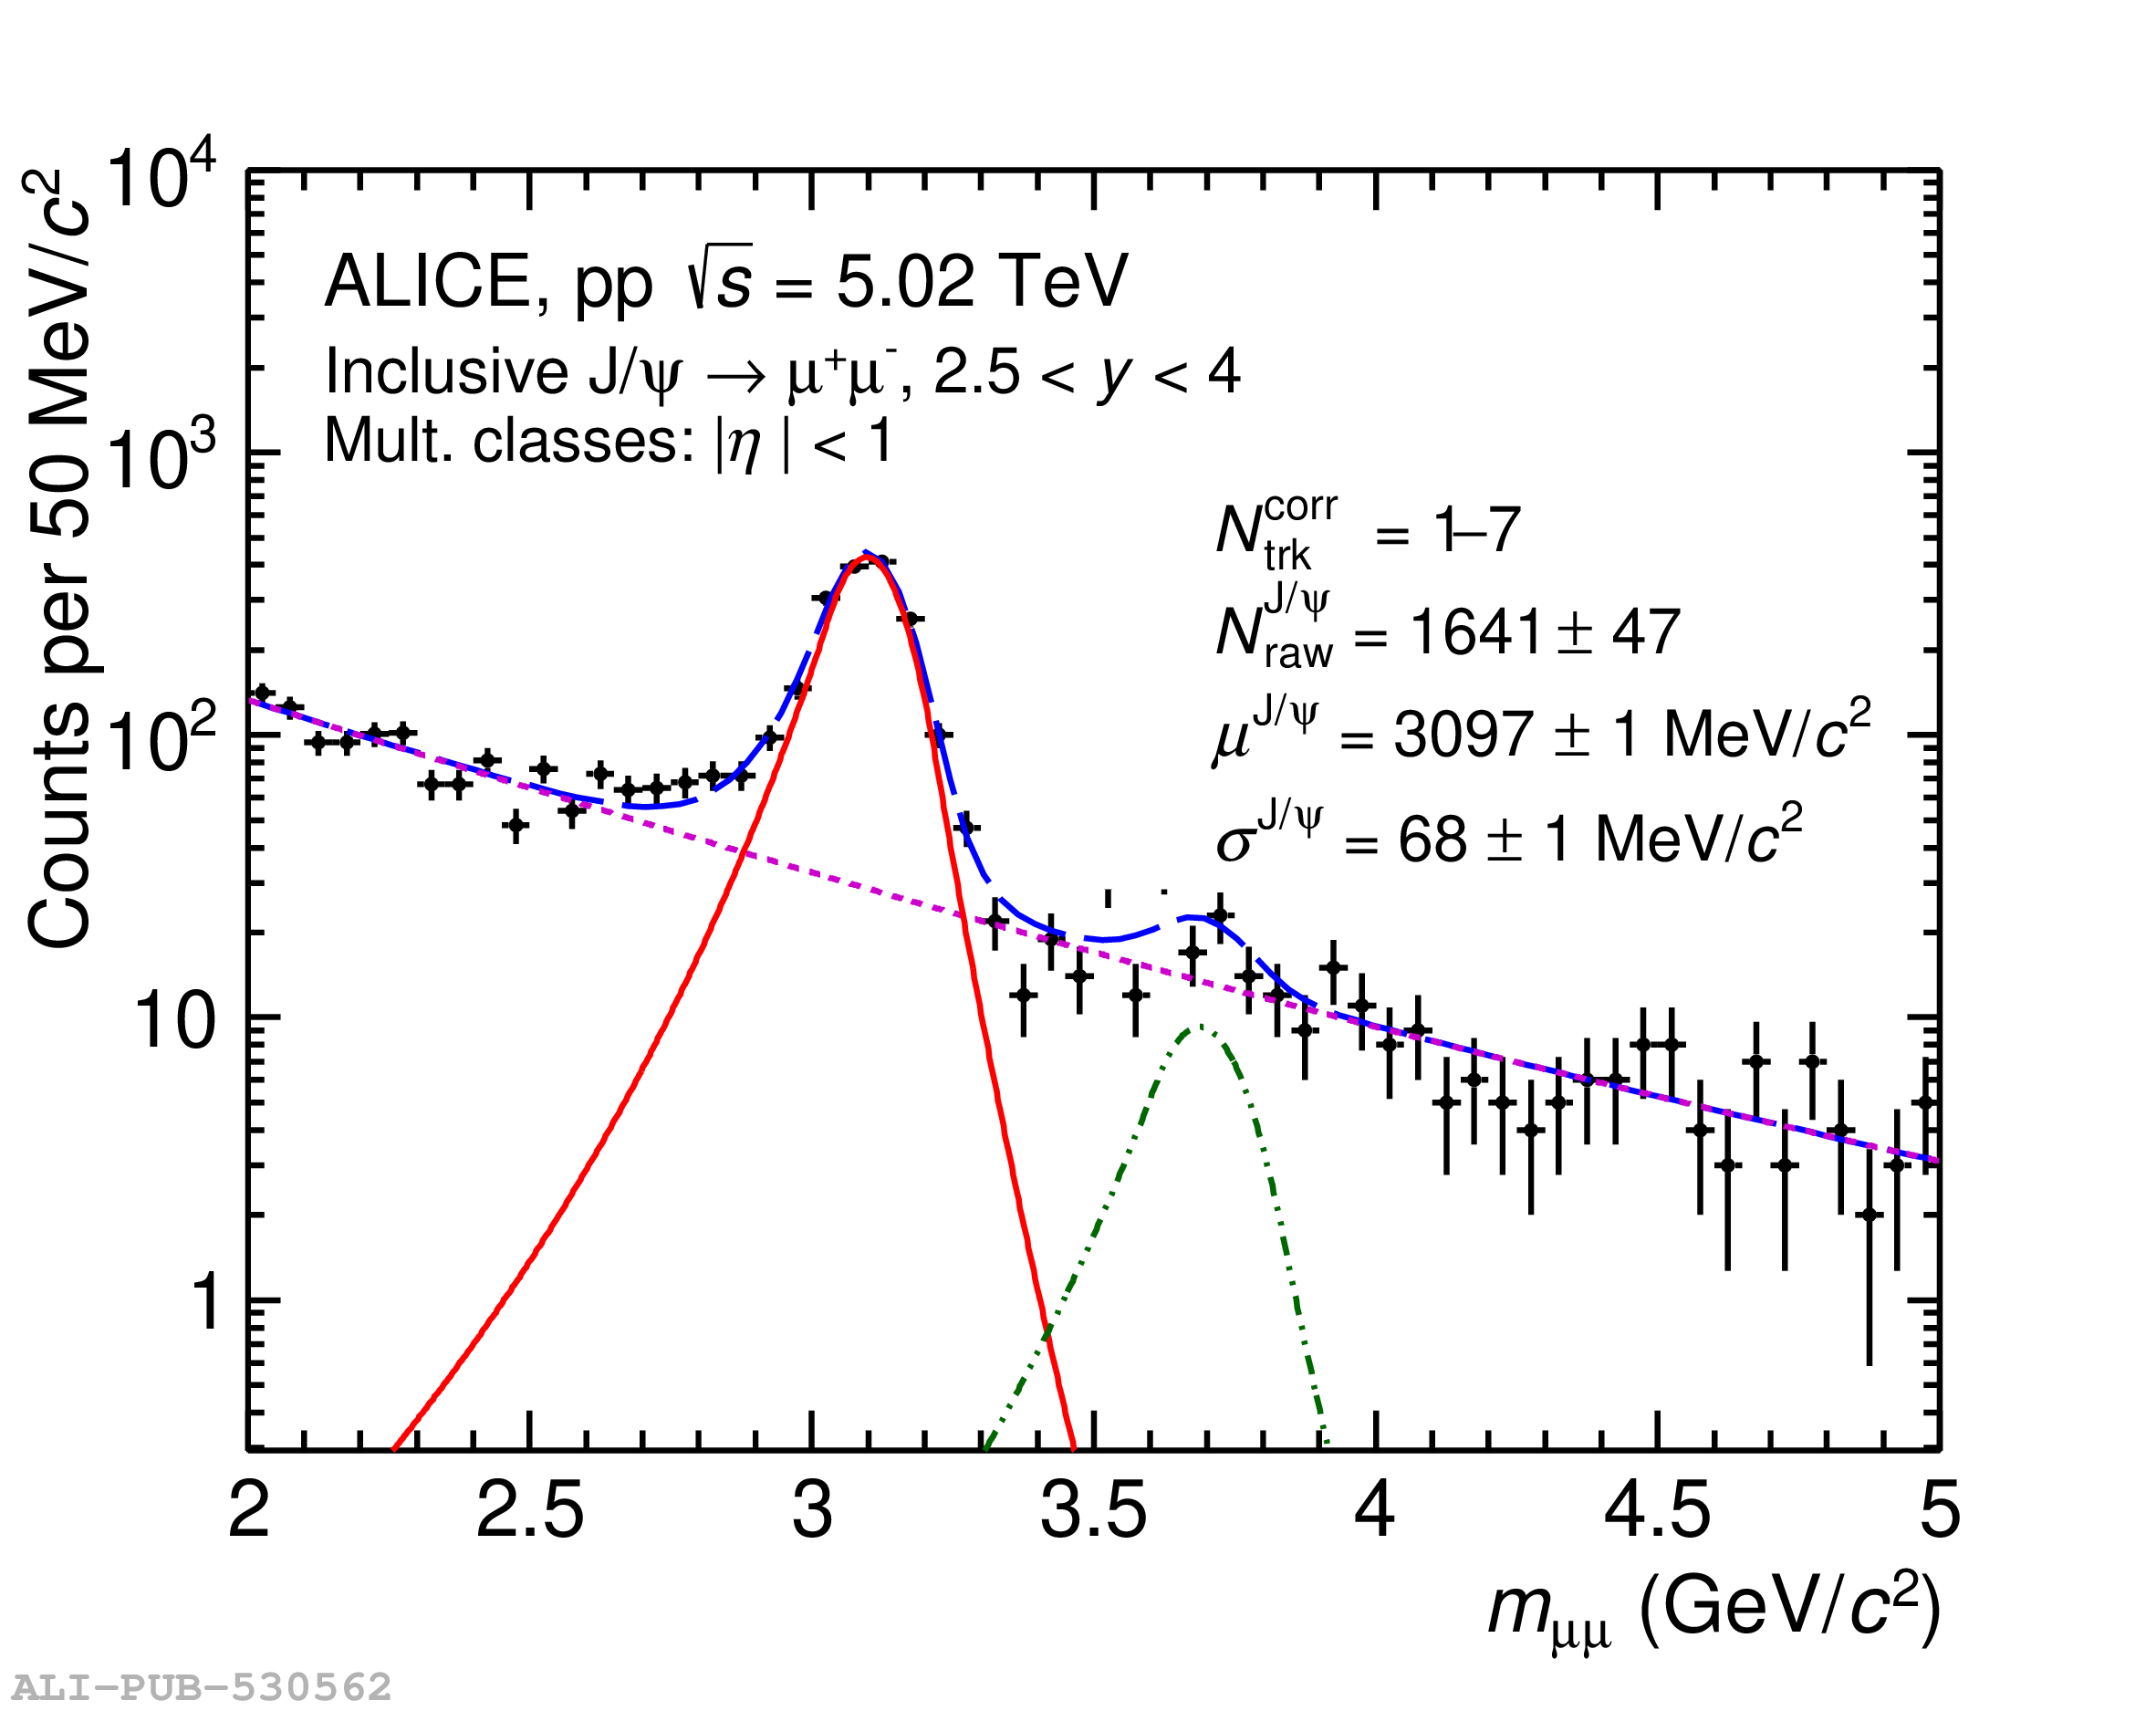 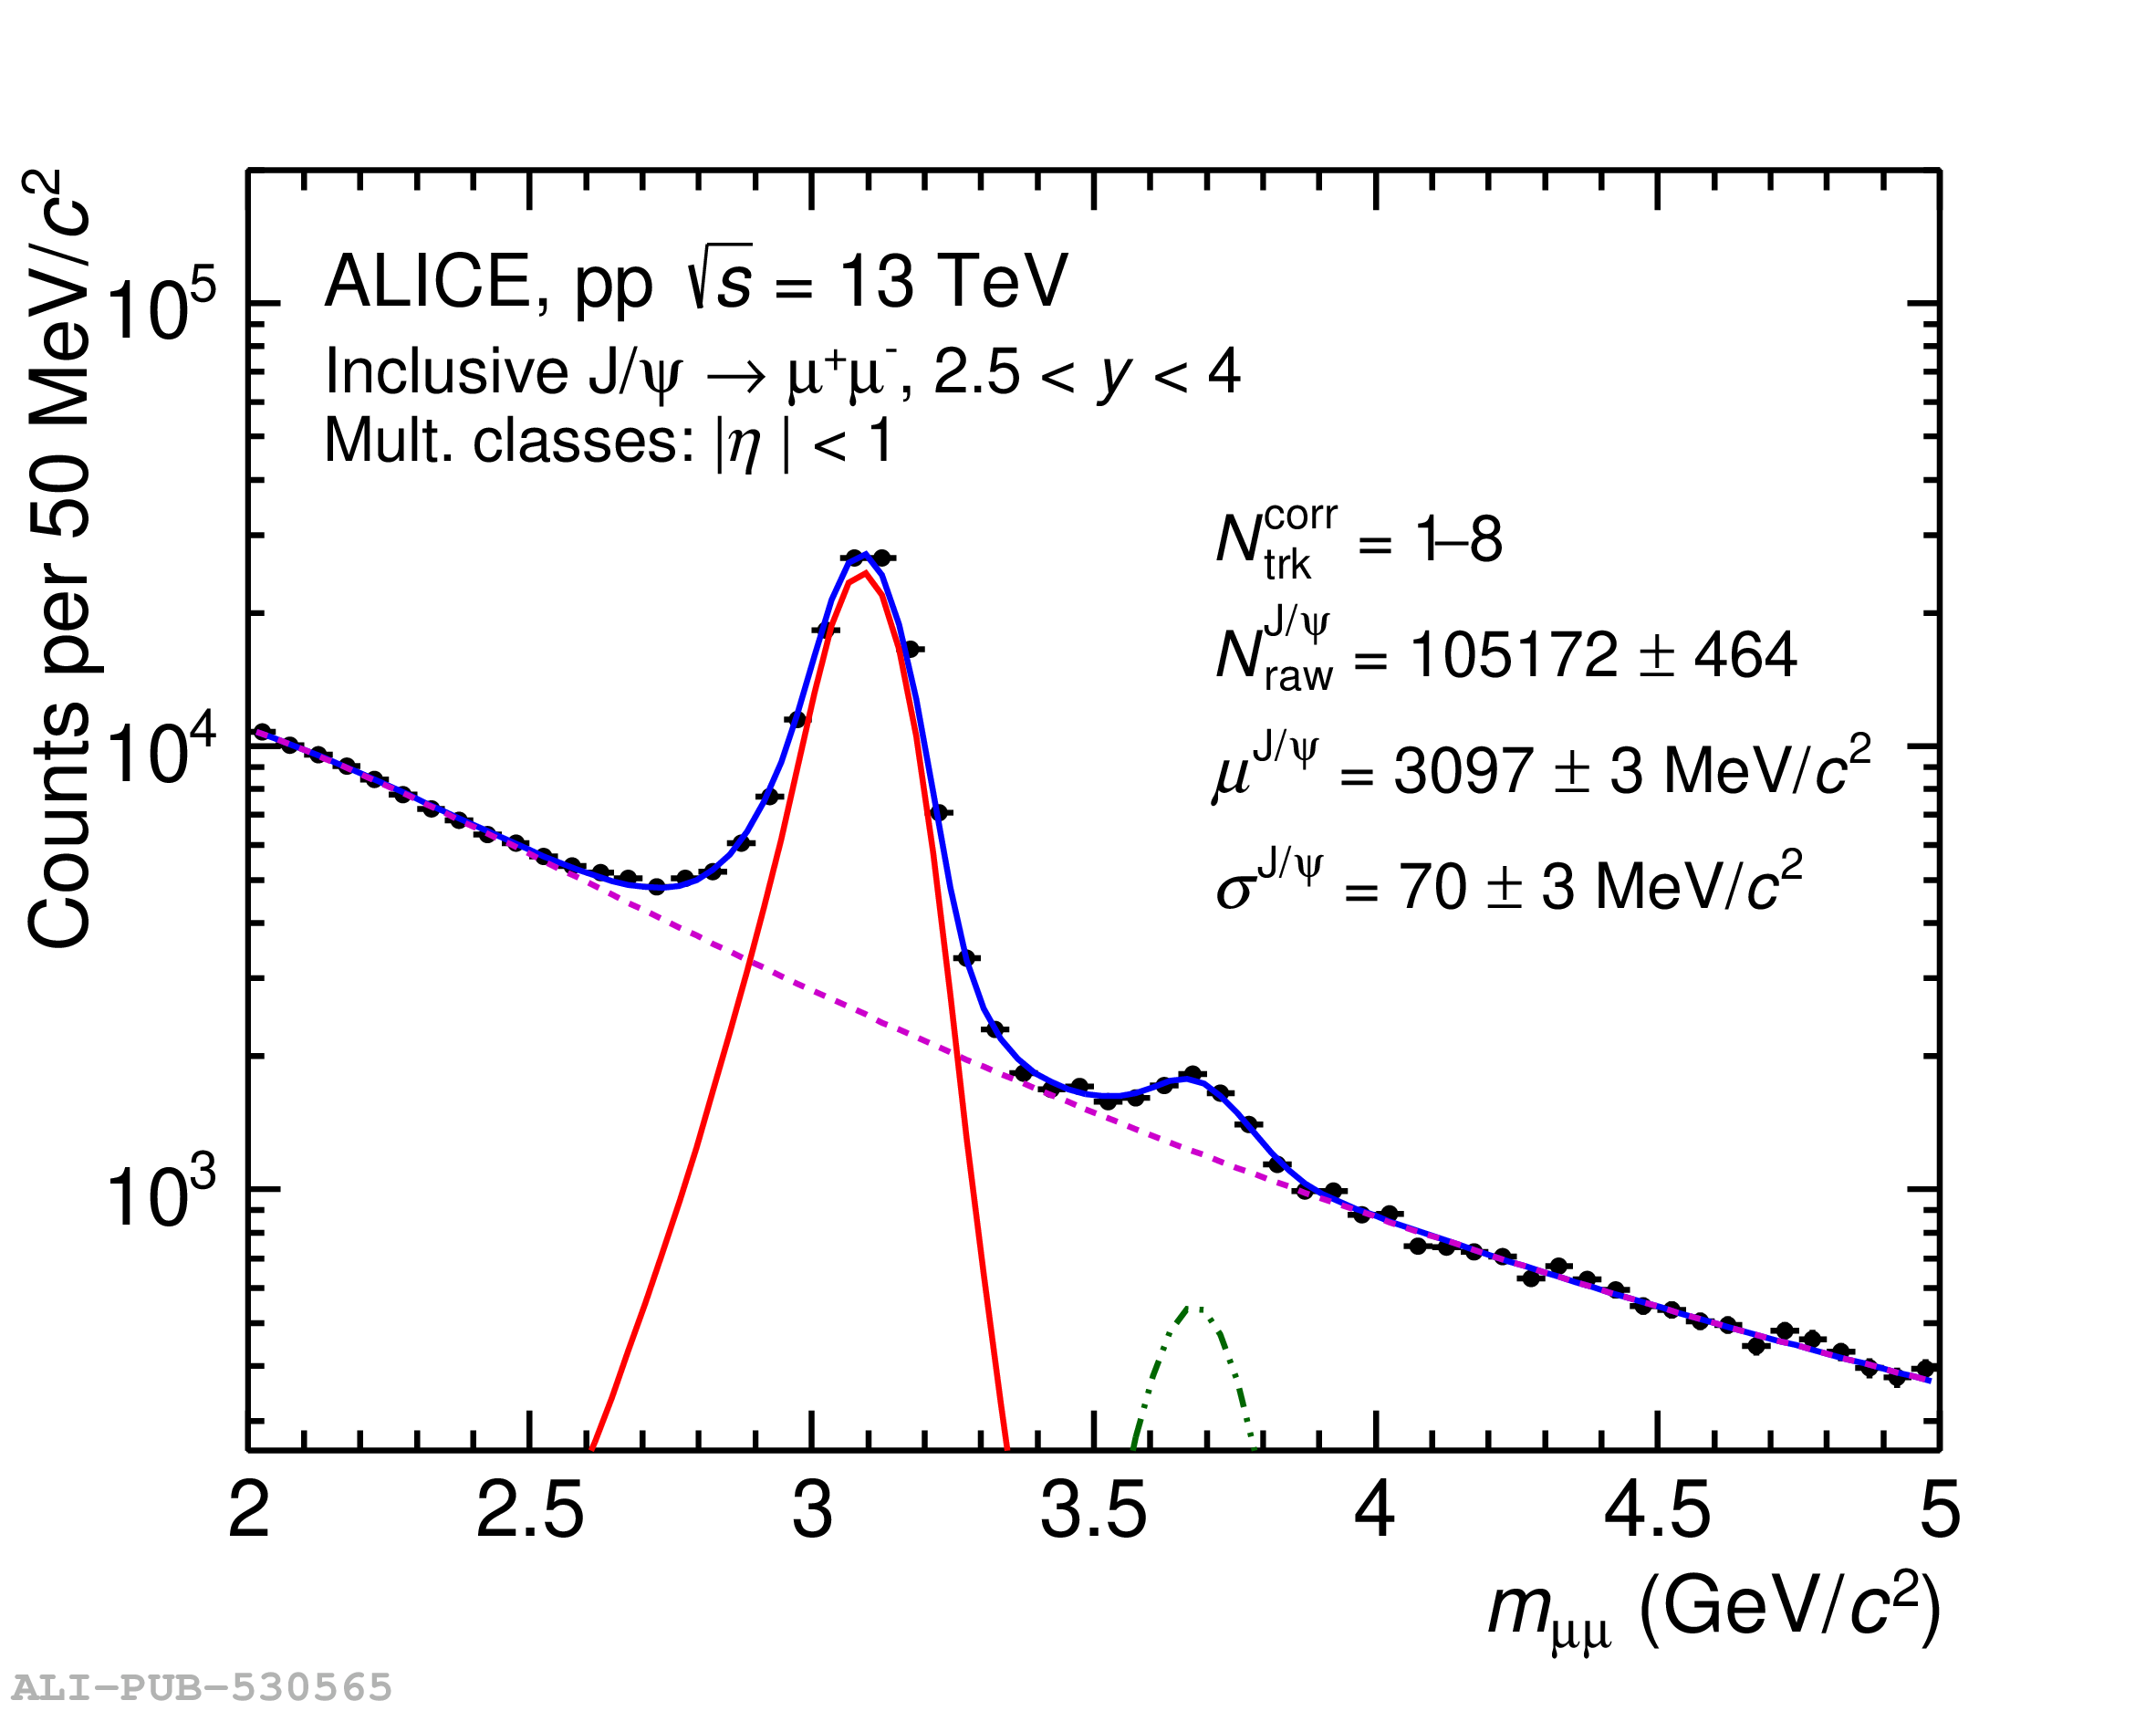 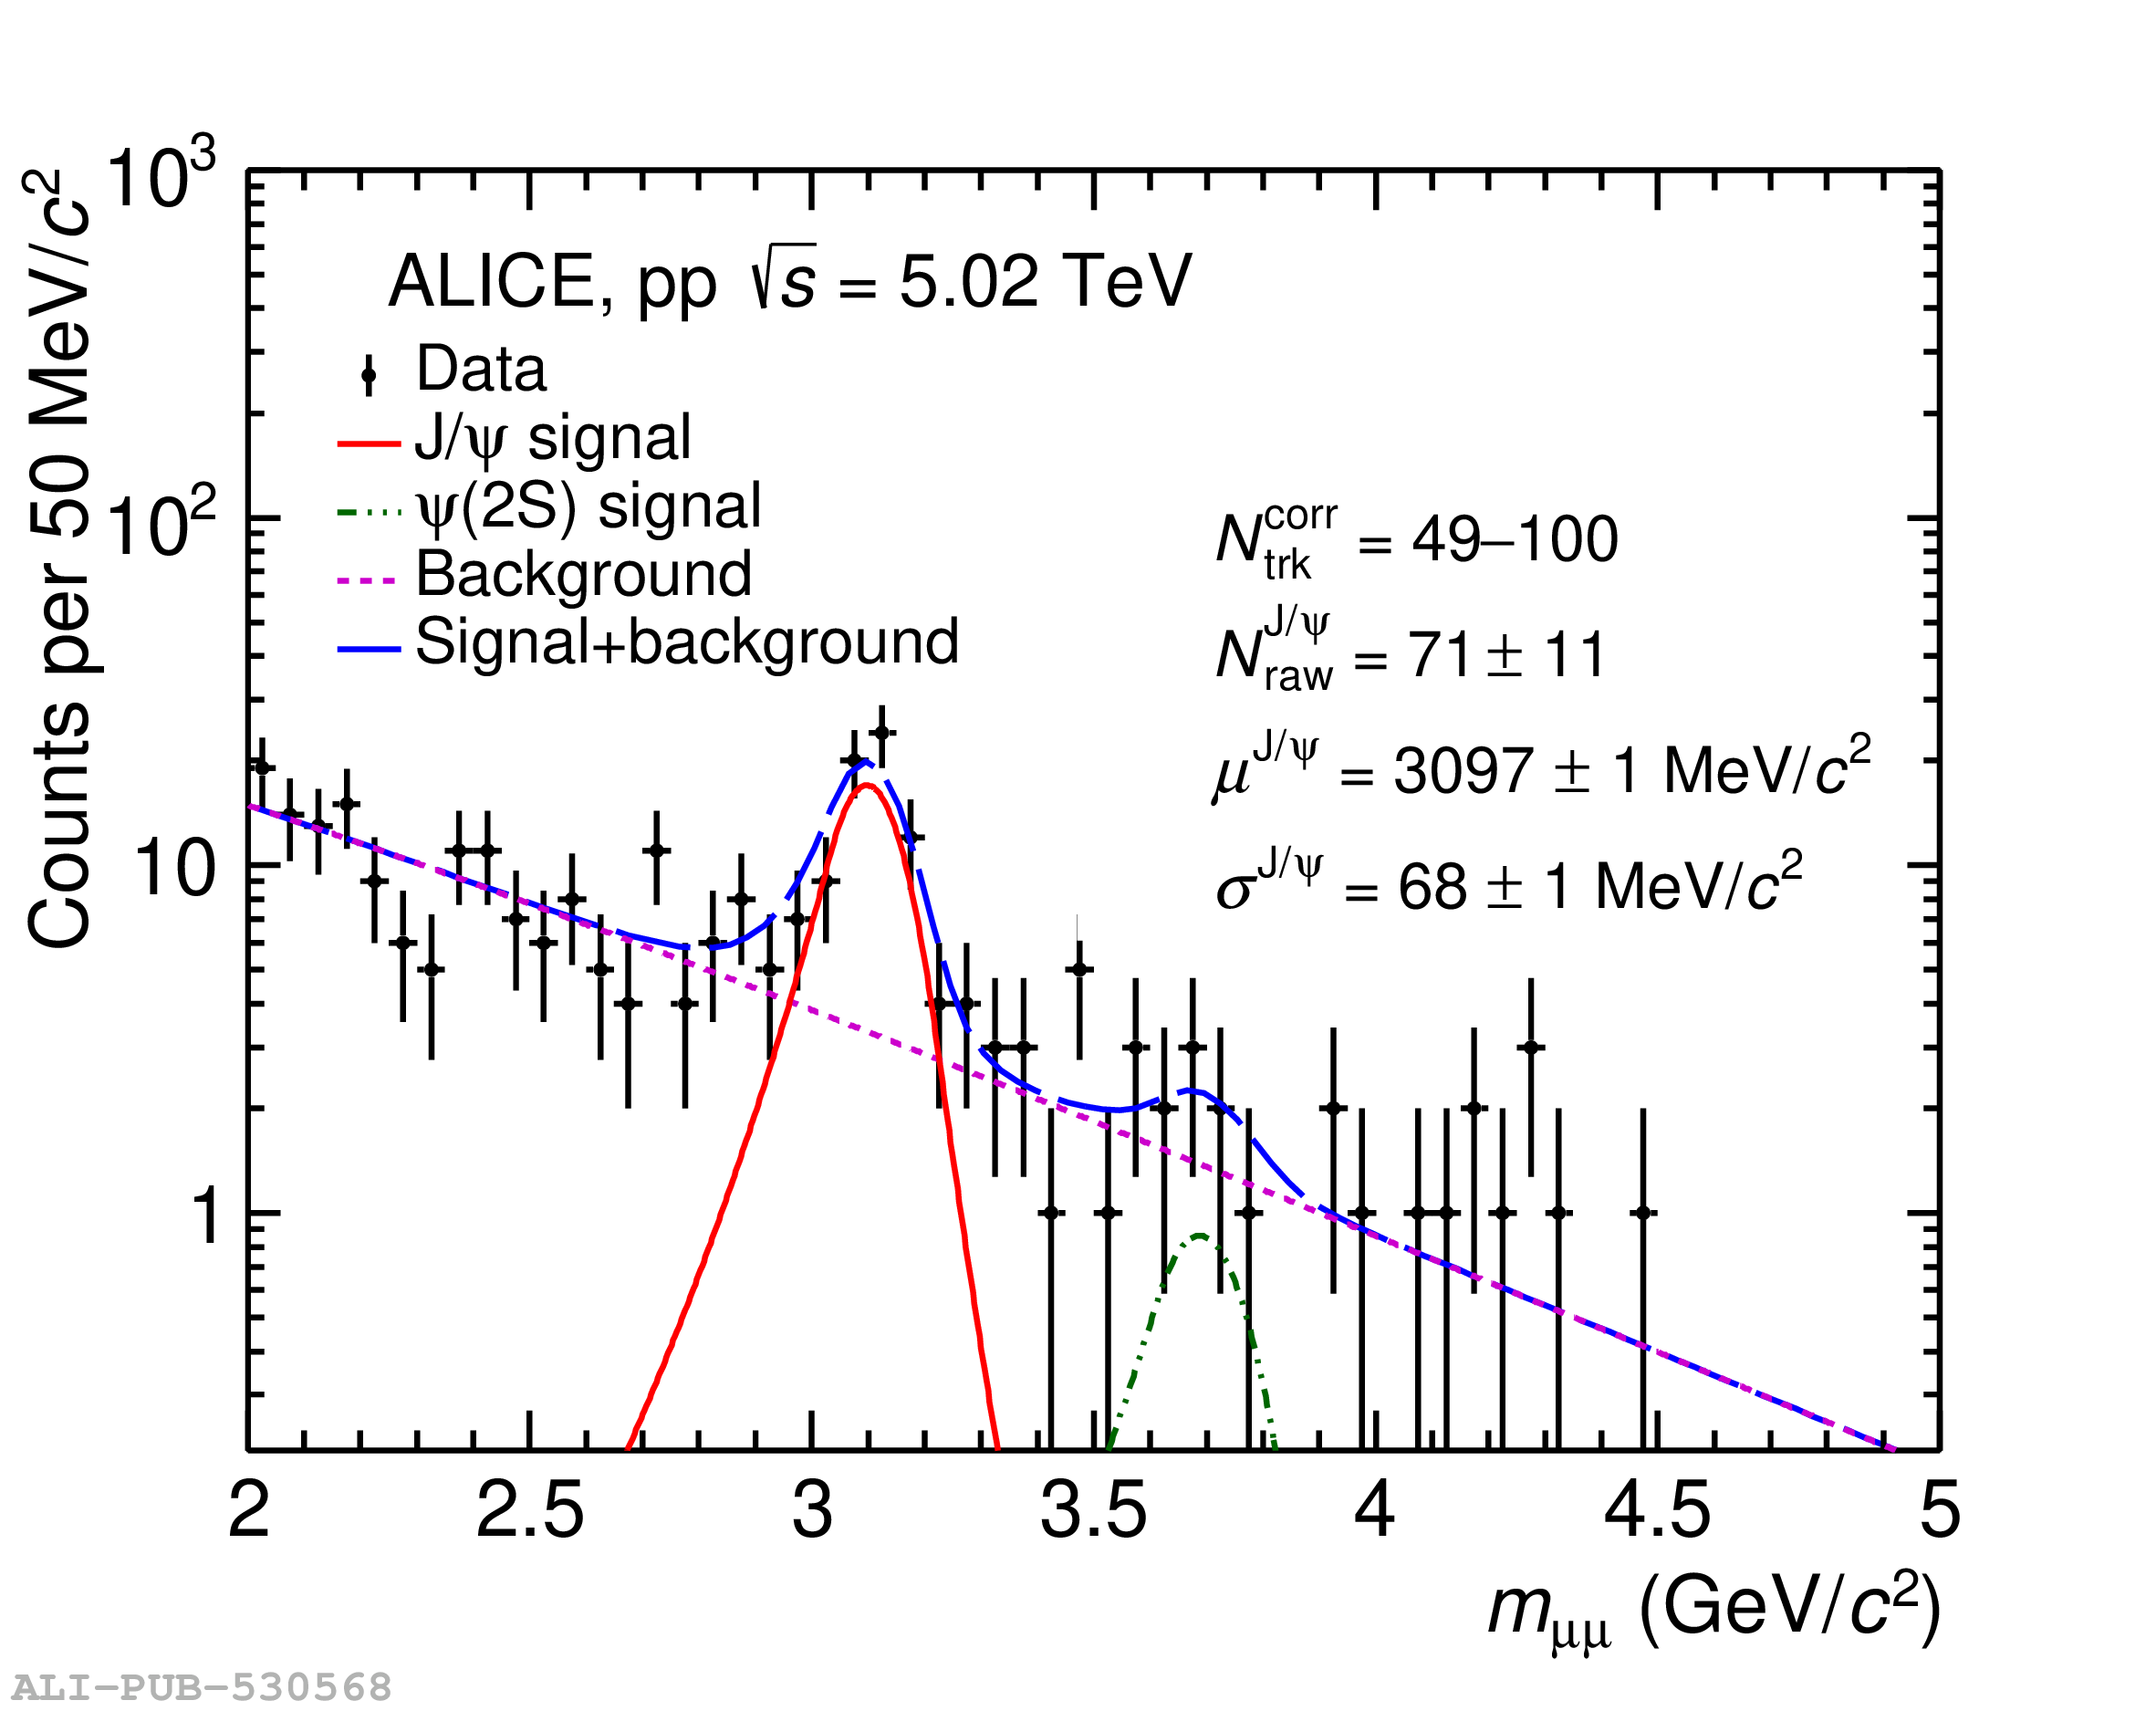 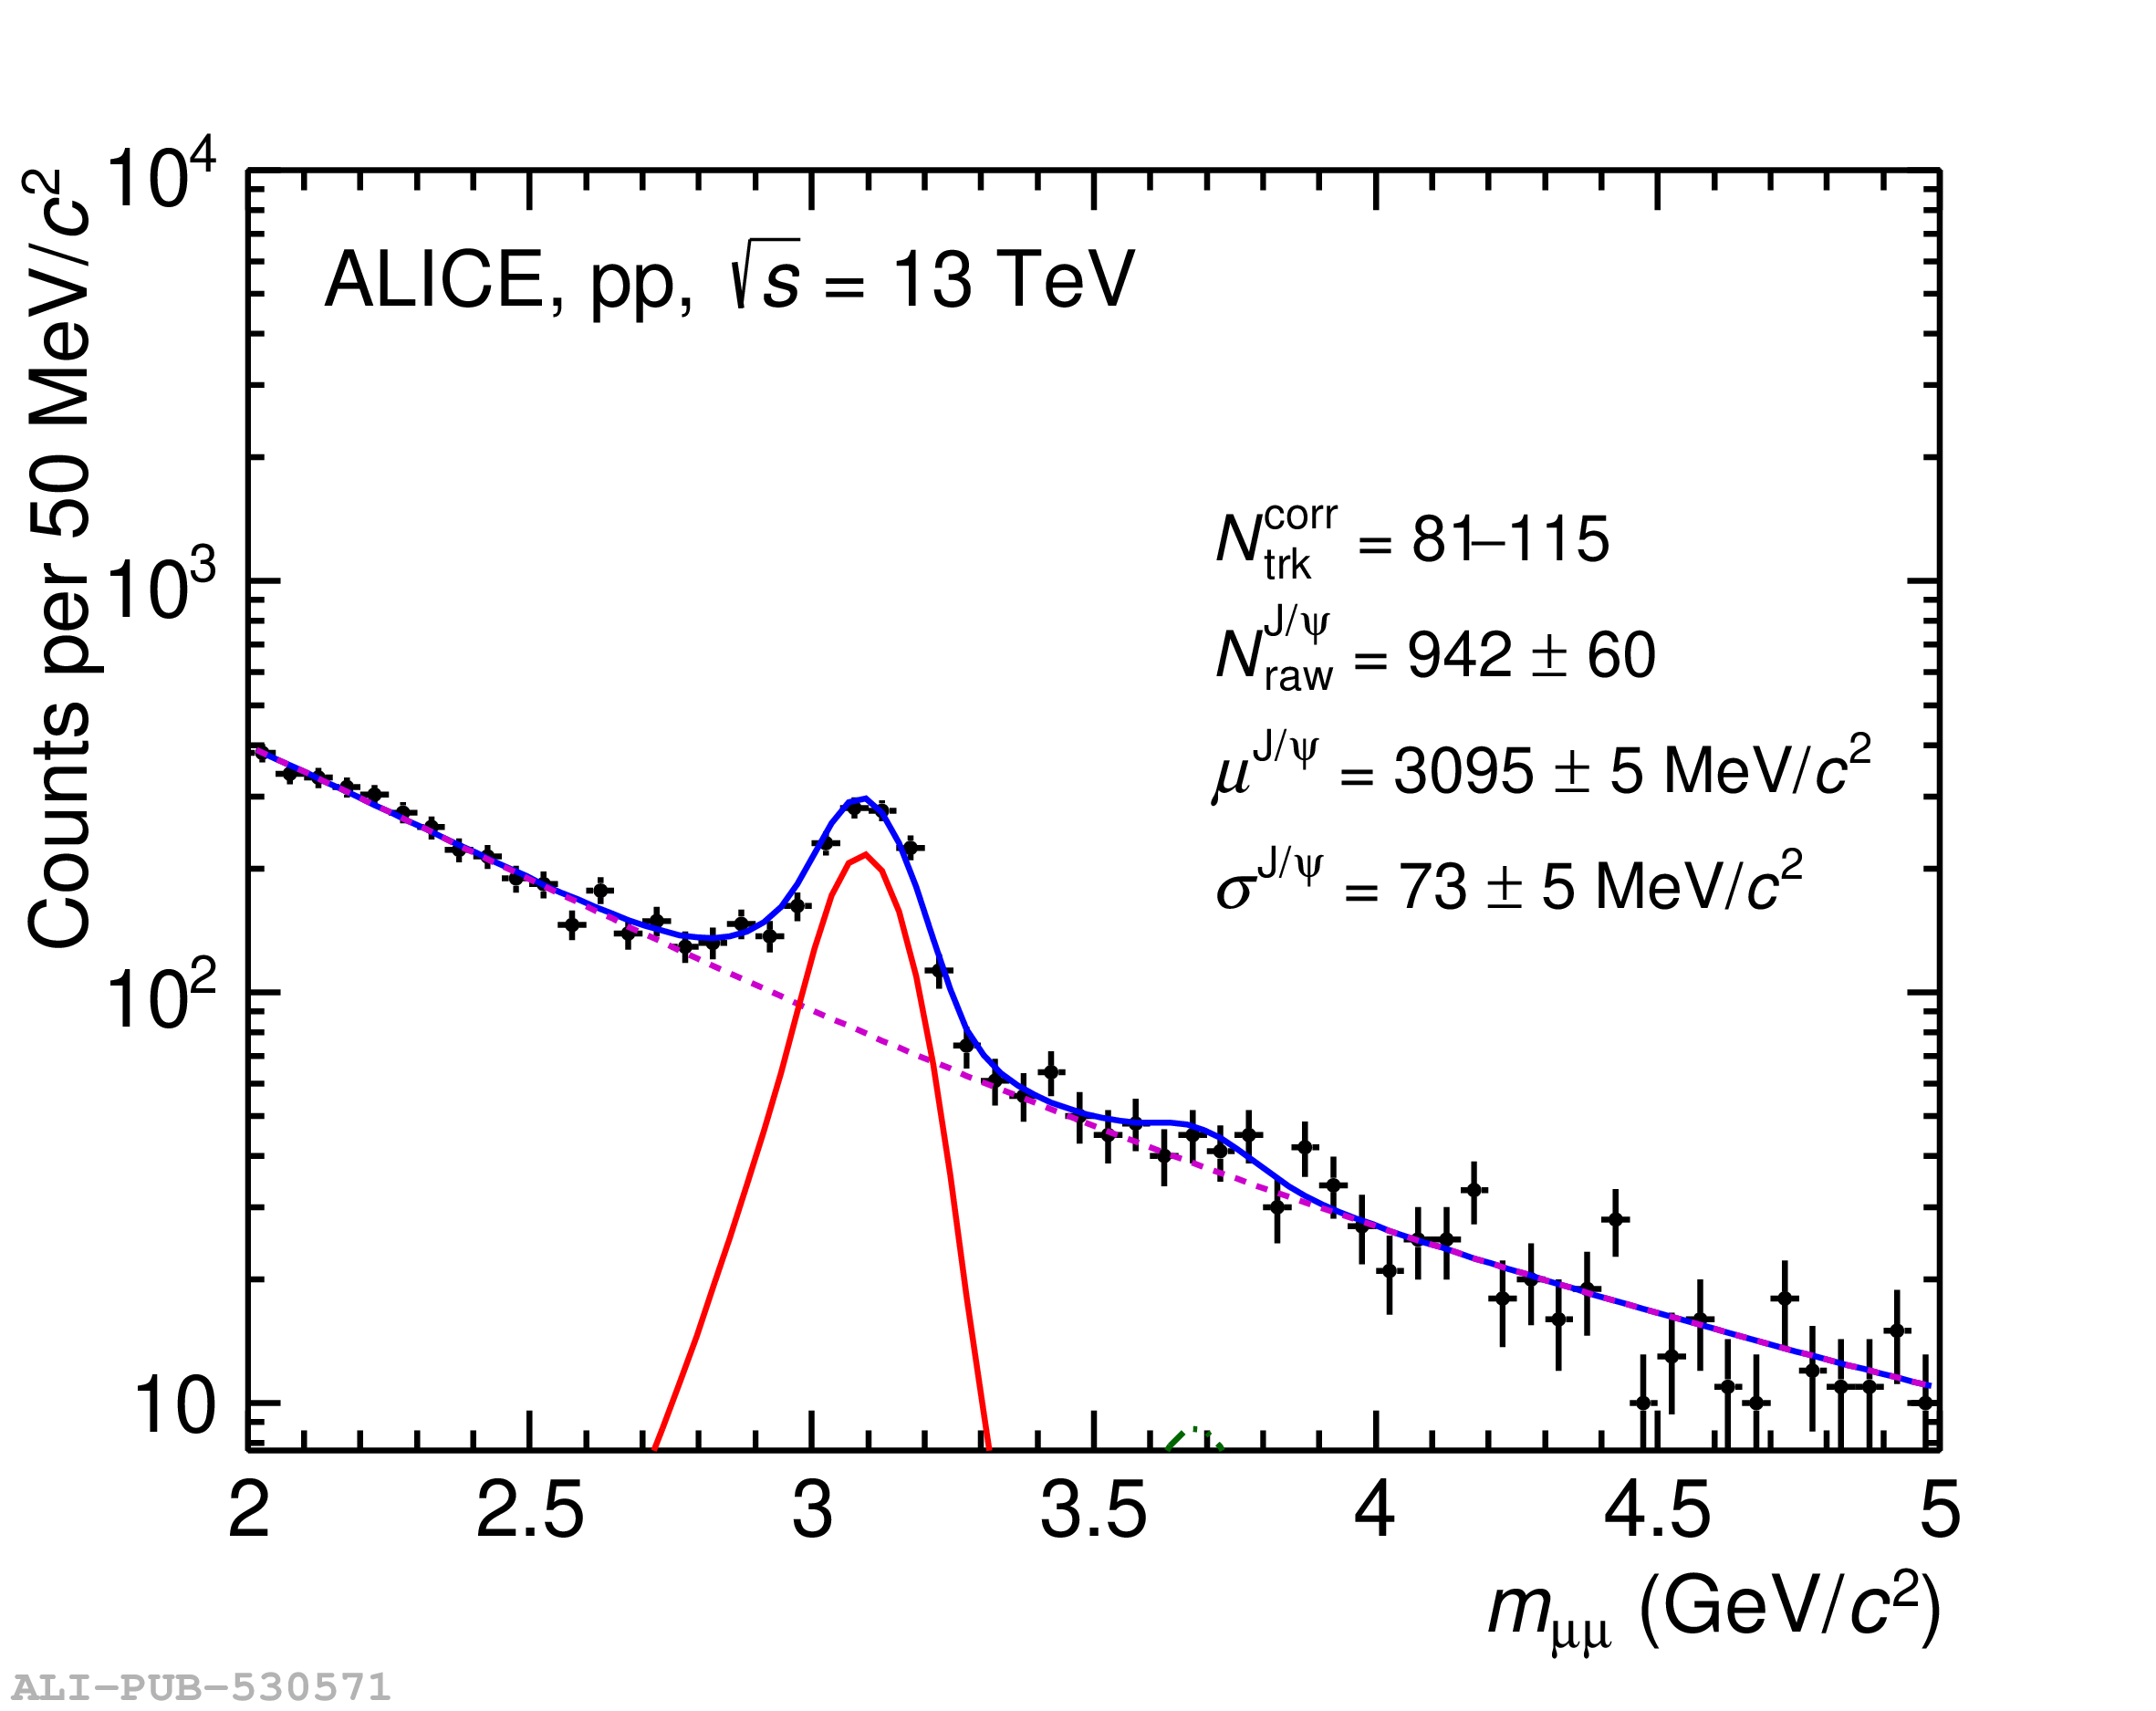 |