Measured correlation function of \pap pairs. Statistical (bars) and systematic (boxes) uncertainties are shown separately. The results assuming the \Ledn model with Coulomb included, as in , are shown by the violet band. The scattering parameters used as input for the \Ledn calculations include only the \nan contribution as coupled-channel . The model completely underestimates the \ks region from 50 to 150 \MeVc. As can be seen in Fig. \ref{fig:pApCFs}, the annihilation channels play a role in this intermediate region and a better description of the data is achieved when using the Migdal-Watson approximation to include them. This is a clear indication that the multi-meson channels are explicitly needed to model the current measured \pap correlation function. The \Ledn calculation also overestimates the coupling to the \nan channel, as can be seen from the large cusp structure at $\ks\approx50$ \MeVc not present in the data. Lower panel: $n_\sigma$ deviation between data and model in terms of numbers of statistical standard deviations. | 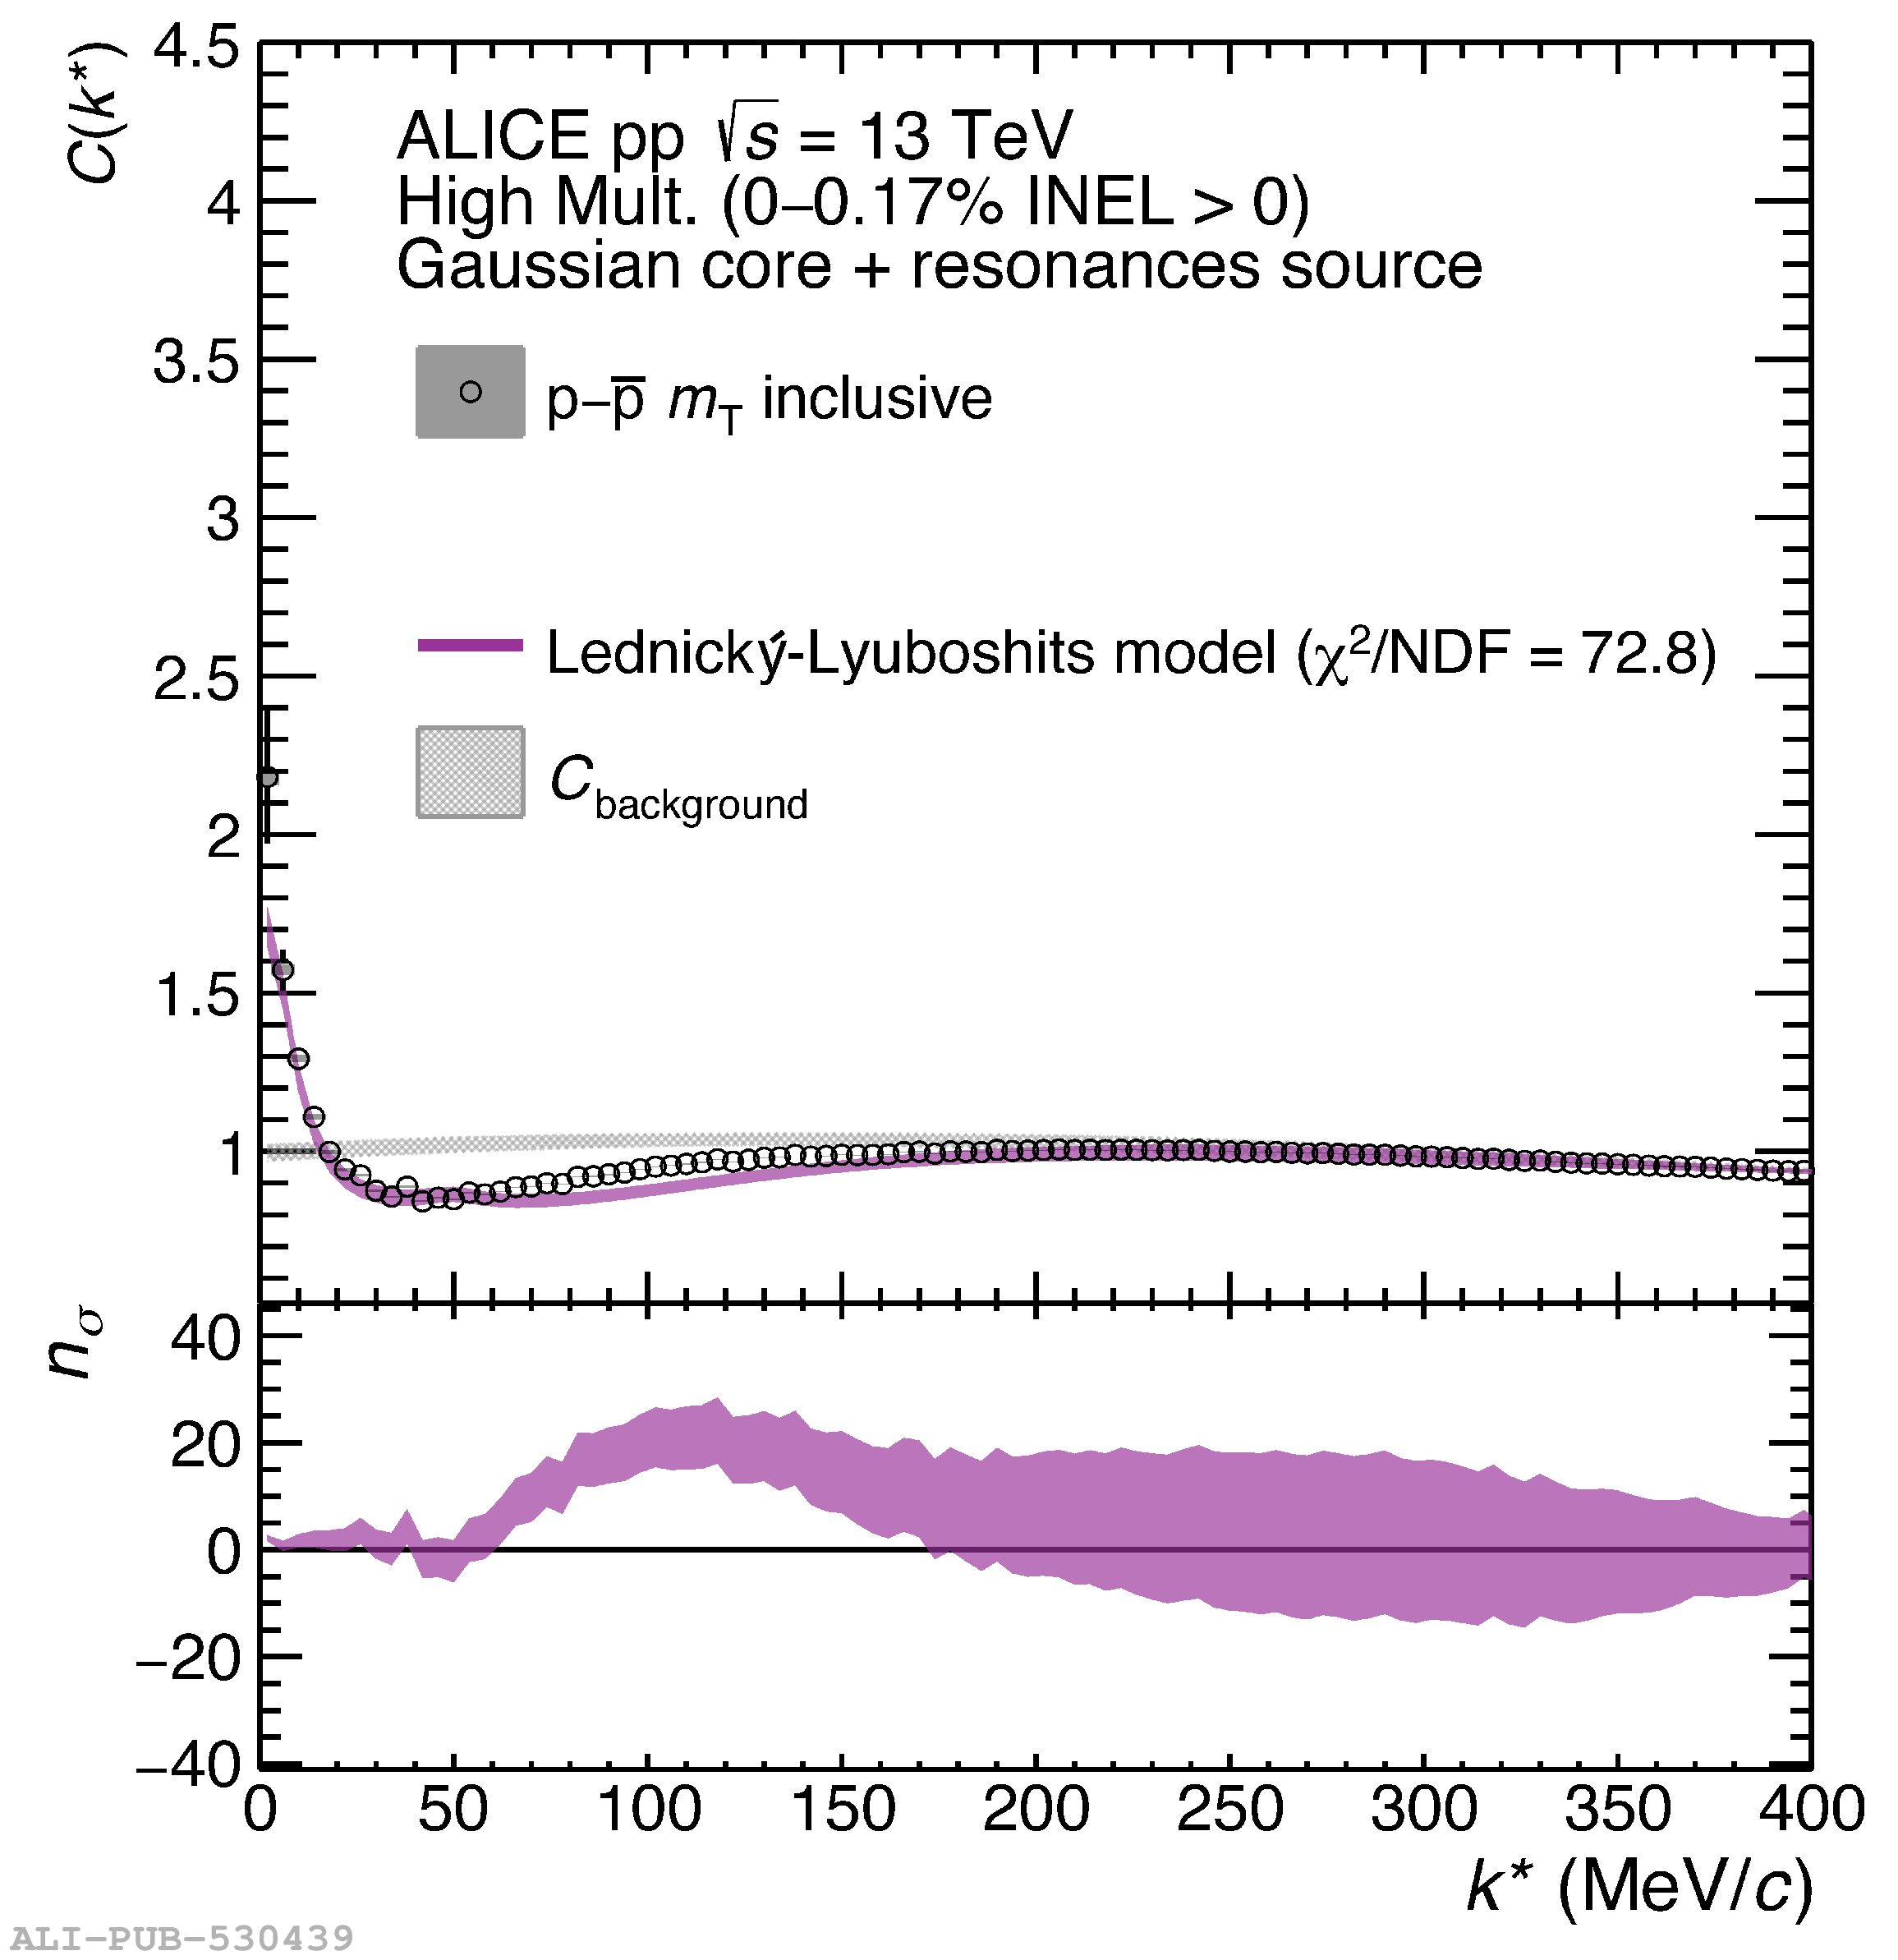 |