Measured correlation function of $p-\overline{\Lambda}$ (left) and $\Lambda-\overline{\Lambda}$ (right) pairs for two representative $m_T$ bins. Statistical (bars) and systematic (boxes) uncertainties are shown separately. Results using the Lednicky-Lyuboshits formula with $Pb-Pb$ scattering parameters are shown in light green. Orange bands are the results with $d_0$ and $Imf_0$ as free parameters. In grey the corresponding $C_{\rm{background}}(k^*)$, multiplied by the normalization constant $N_D$, is shown. The reported average $\chi^2/\rm NDF$ is evaluated in the $k^*$ interval $[0,400]$ MeV/c and it includes correlations between the data points. Lower panel: same as in Fig.2. |  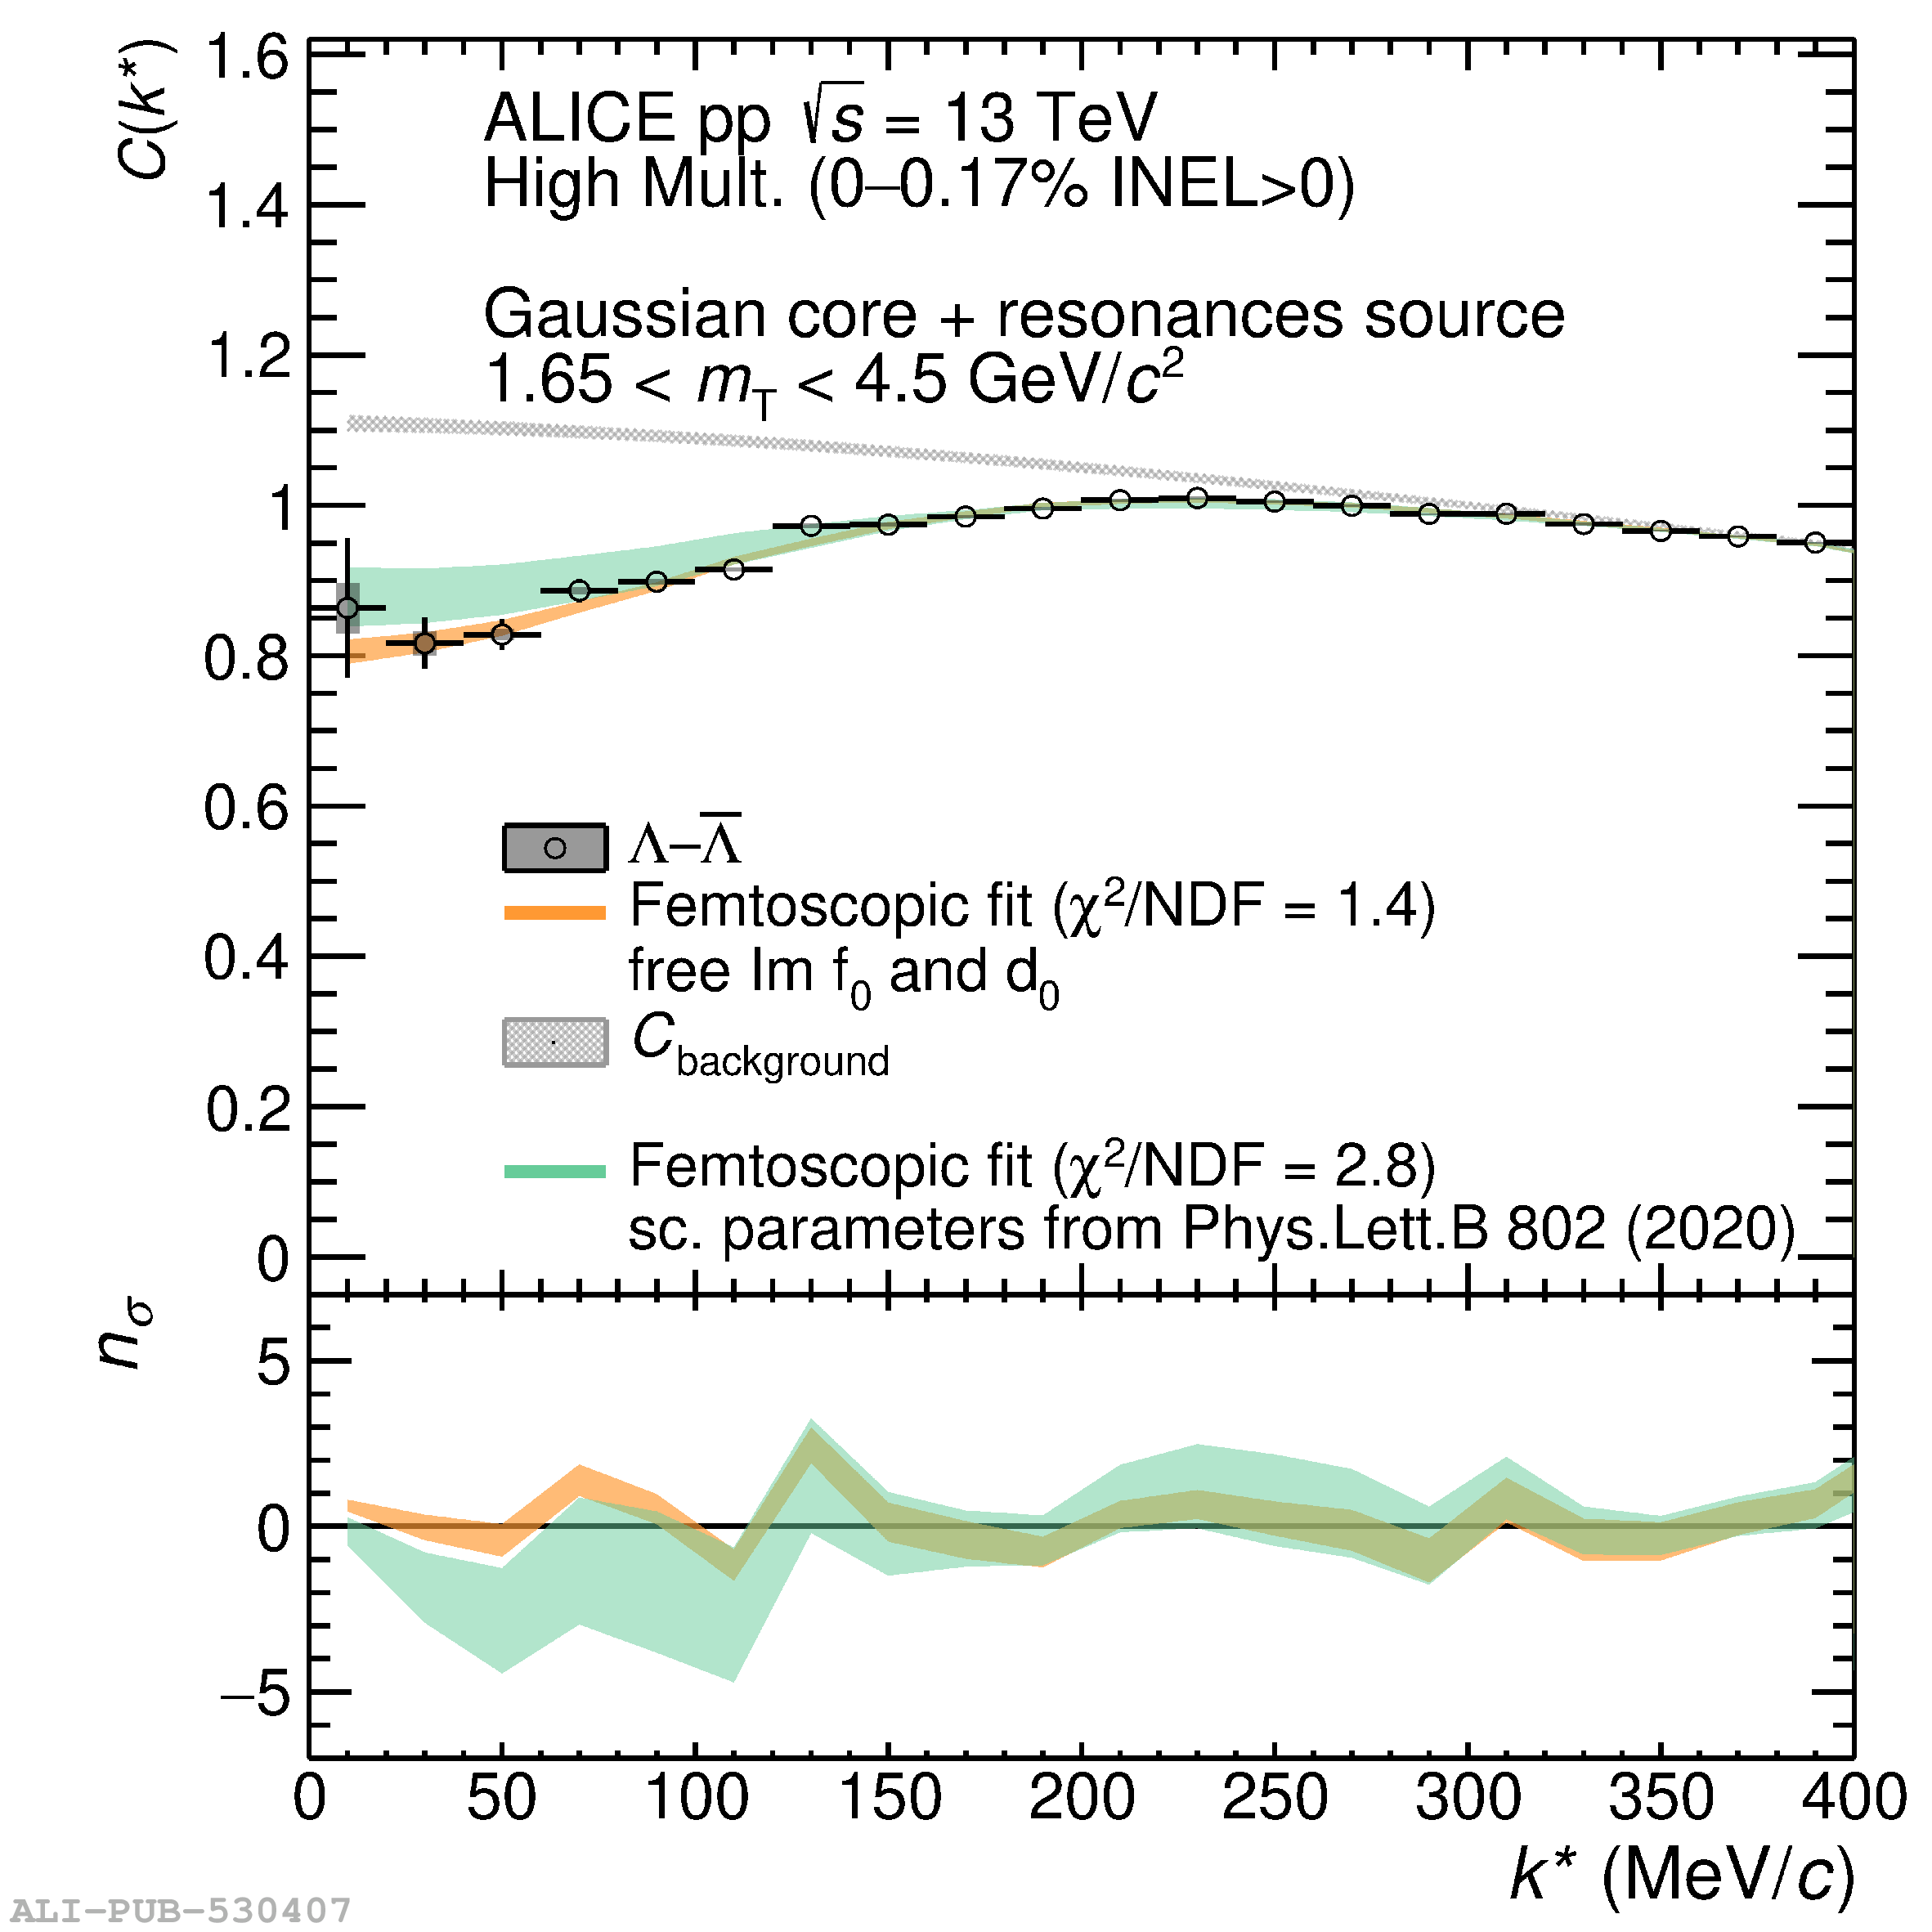 |