Measured correlation function of $p-\overline{p}$ pairs. Statistical (bars) and systematic (boxes) uncertainties are shown separately. The Coulomb only interaction is shown by the green band. The blue band represents the fit performed using $\rm N^3$LO \chiEFT potentials with elastic and $n-\overline{n}$ coupled-channel. The inclusion of annihilation channels is shown by the red band, along with the $C_{\rm{background}}(k^*)$, multiplied by the normalization constant $N_D$ obtained in the fit. The reported average $\chi^2/\rm NDF$ is evaluated in the $k^*$ interval $[0,400]$ \MeVc and it includes correlations between the data points. Lower panel: $n_\sigma$ deviation between data and model in terms of numbers of statistical standard deviations. | 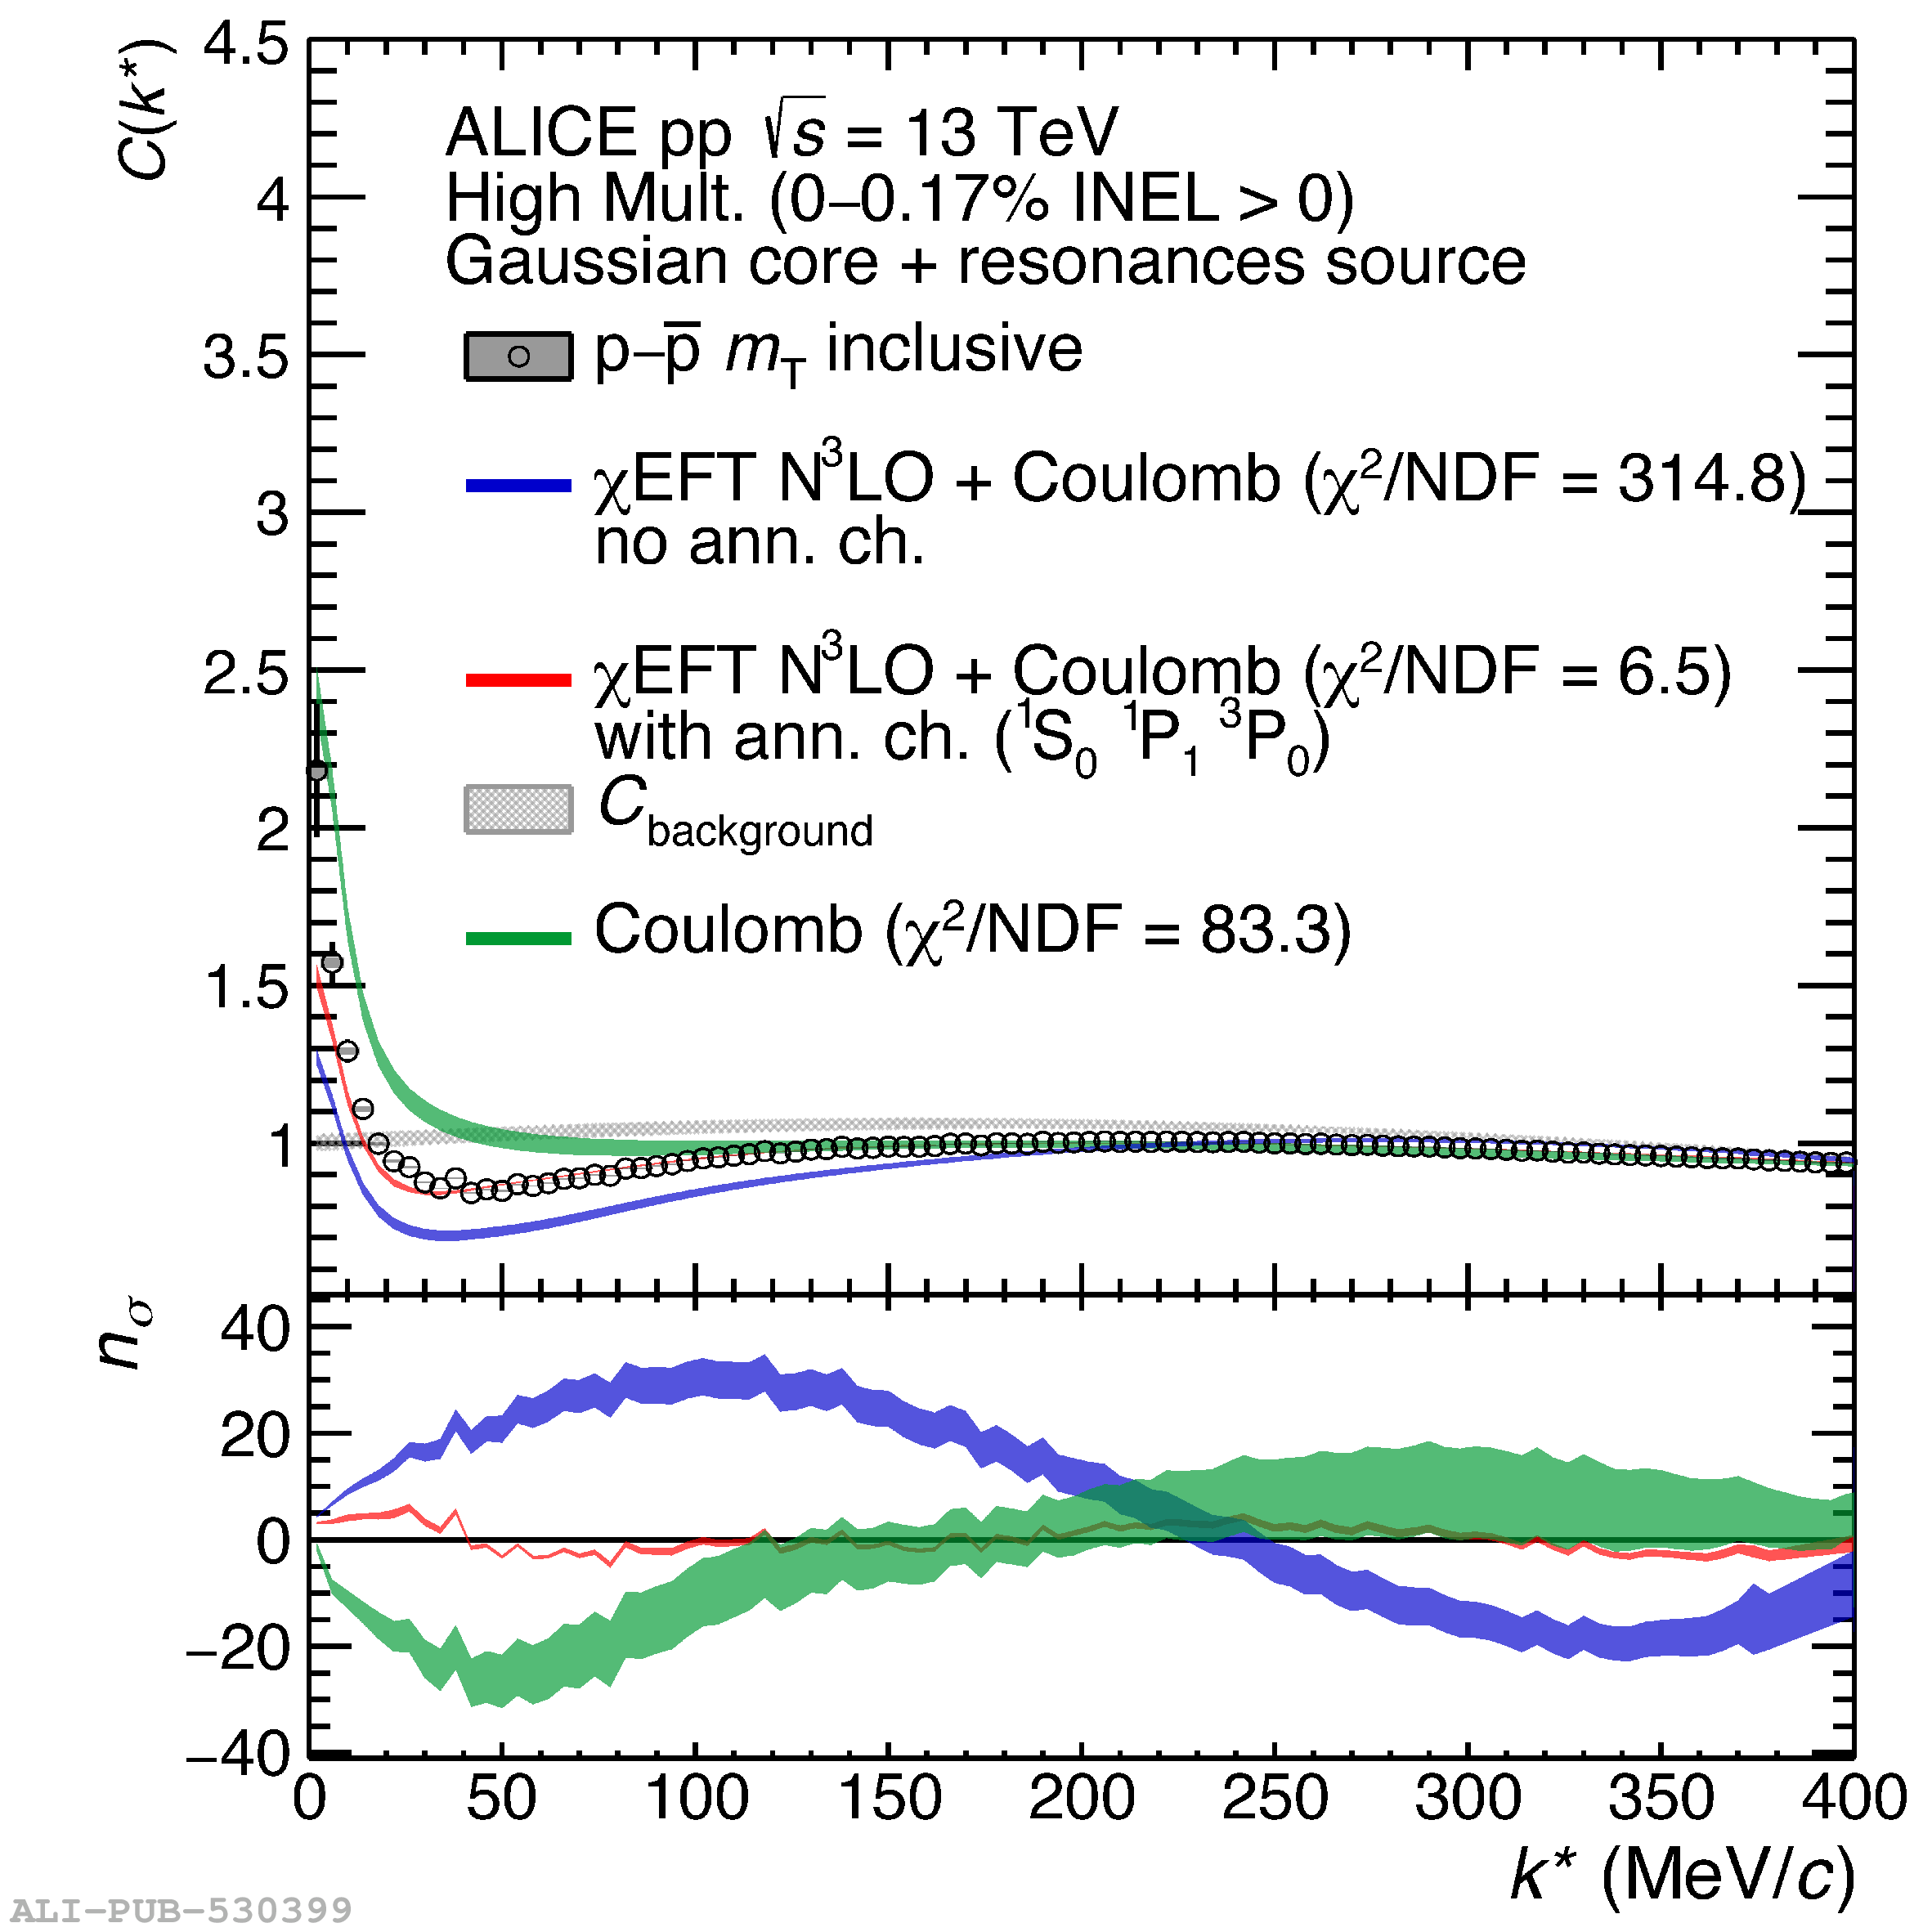 |