Left: experimental \pD correlation function in the range $0<\kstar<2 \gev/c$. Statistical (bars) and systematic uncertainties (shaded boxes) are shown separately. The open boxes represent the bin width. Right: experimental \pD correlation function in a reduced \kstar range together with the contributions from \pKpipi (green band) and \pDstar (red band), and the total background model (purple band). The \pKpipi and \pDstar contributions are not scaled by the respective $\lambda$ parameter. The width of the dark (light) shaded bands depicts the statistical (total) uncertainty of the parametrized background contributions. | 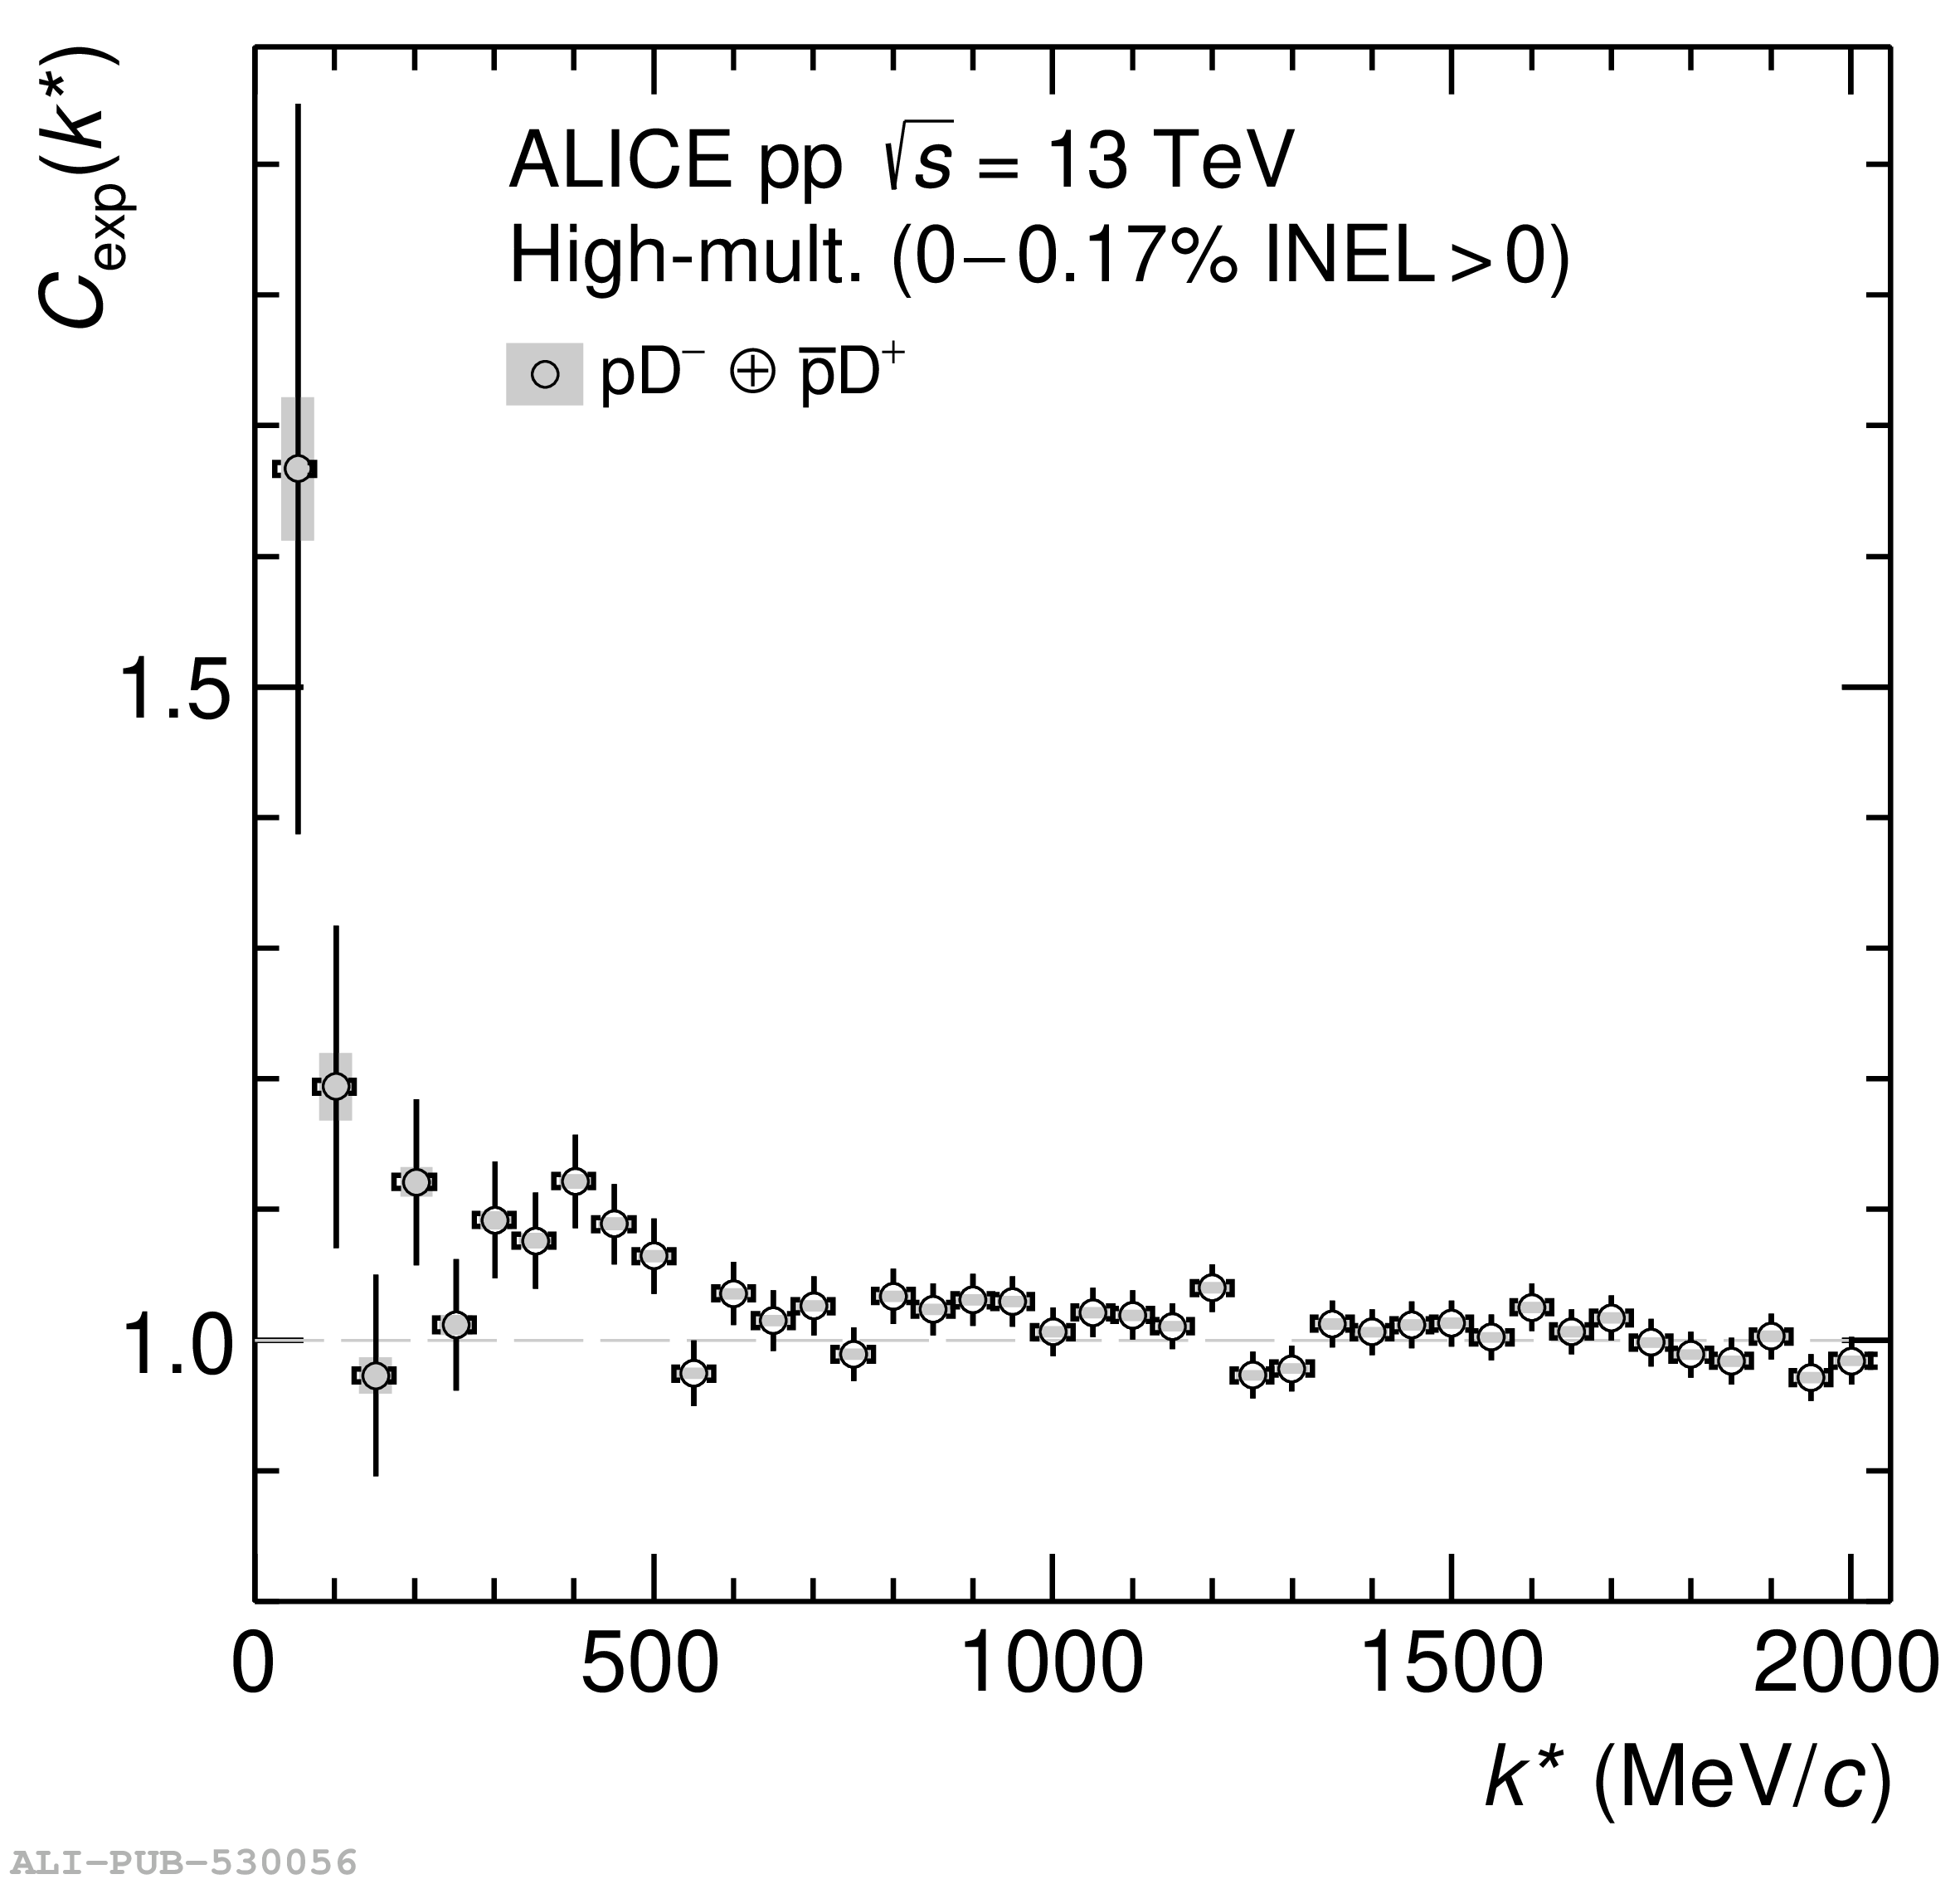 |