Comparison of self-normalised jet yields as a function of the self-normalised charged-particle multiplicity in four selected jet $\pt$ intervals ($5\leq p_{\rm T,jet}^{\rm ch}< 7\ {\rm GeV}/c$, $9\leq p_{\rm T,jet}^{\rm ch}< 12\ {\rm GeV}/c$, $30\leq p_{\rm T,jet}^{\rm ch}< 50\ {\rm GeV}/c$, and $70\leq p_{\rm T,jet}^{\rm ch}< 100\ {\rm GeV}/c$) for a given jet radii: a) $R = 0.2$, b) $R = 0.4$, c) $R = 0.6$ between data and PYTHIA8 predictions. The charged-particle multiplicities are taken from Ref. . Statistical and systematic uncertainties are shown as vertical error bars and boxes around the data points, respectively. | 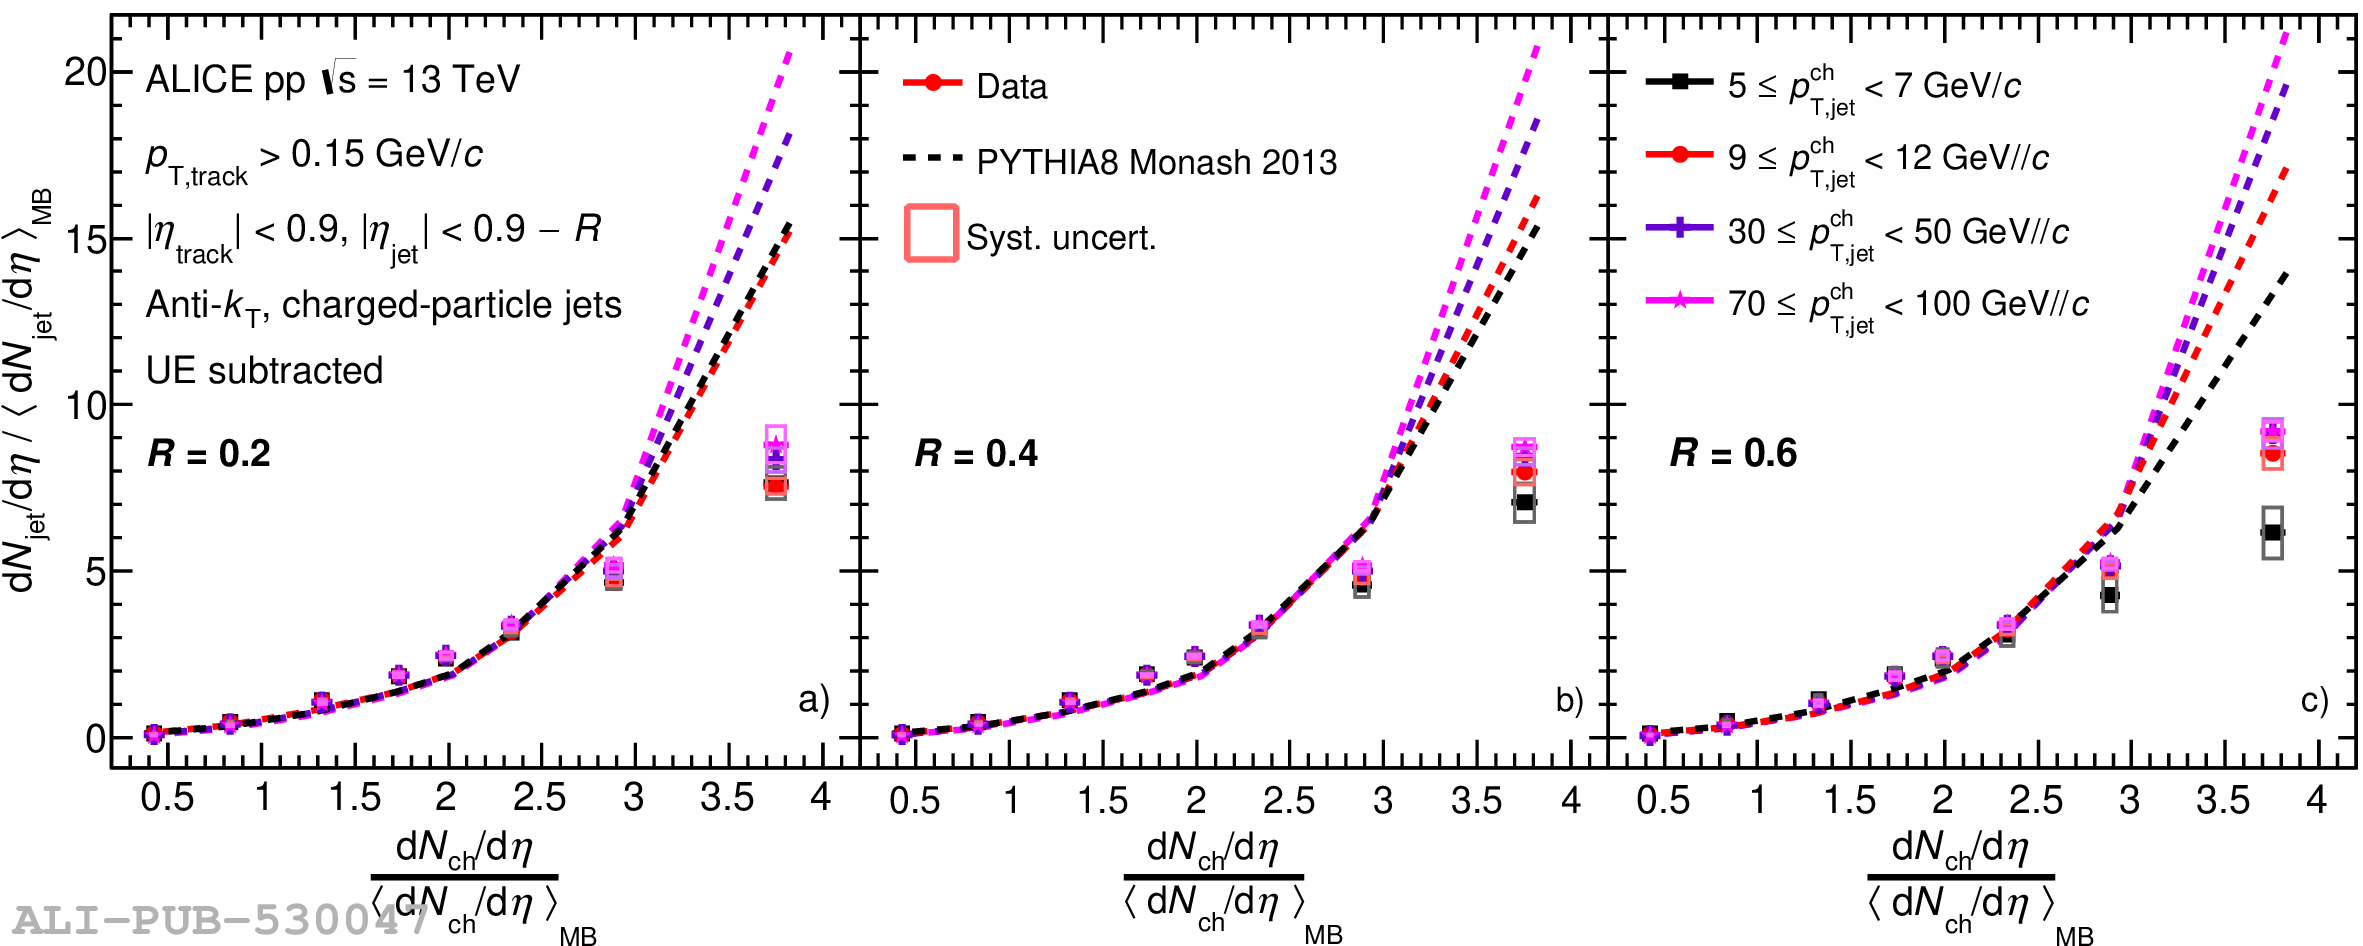 |