Comparison of jet spectra ratios of $R = 0.2$ to $R =$ a) $0.3$, b) $0.5$, c) $0.7$ in three multiplicity intervals (0--1\%, 10--15\% and 60--100\%) and compared with PYTHIA8 simulations. Statistical and systematic uncertainties are shown as vertical error bars and boxes around the data points, respectively Results for other radii can be found in Appendix Fig. \ref{fig:MultJetCSRatioCompMC02046}. | 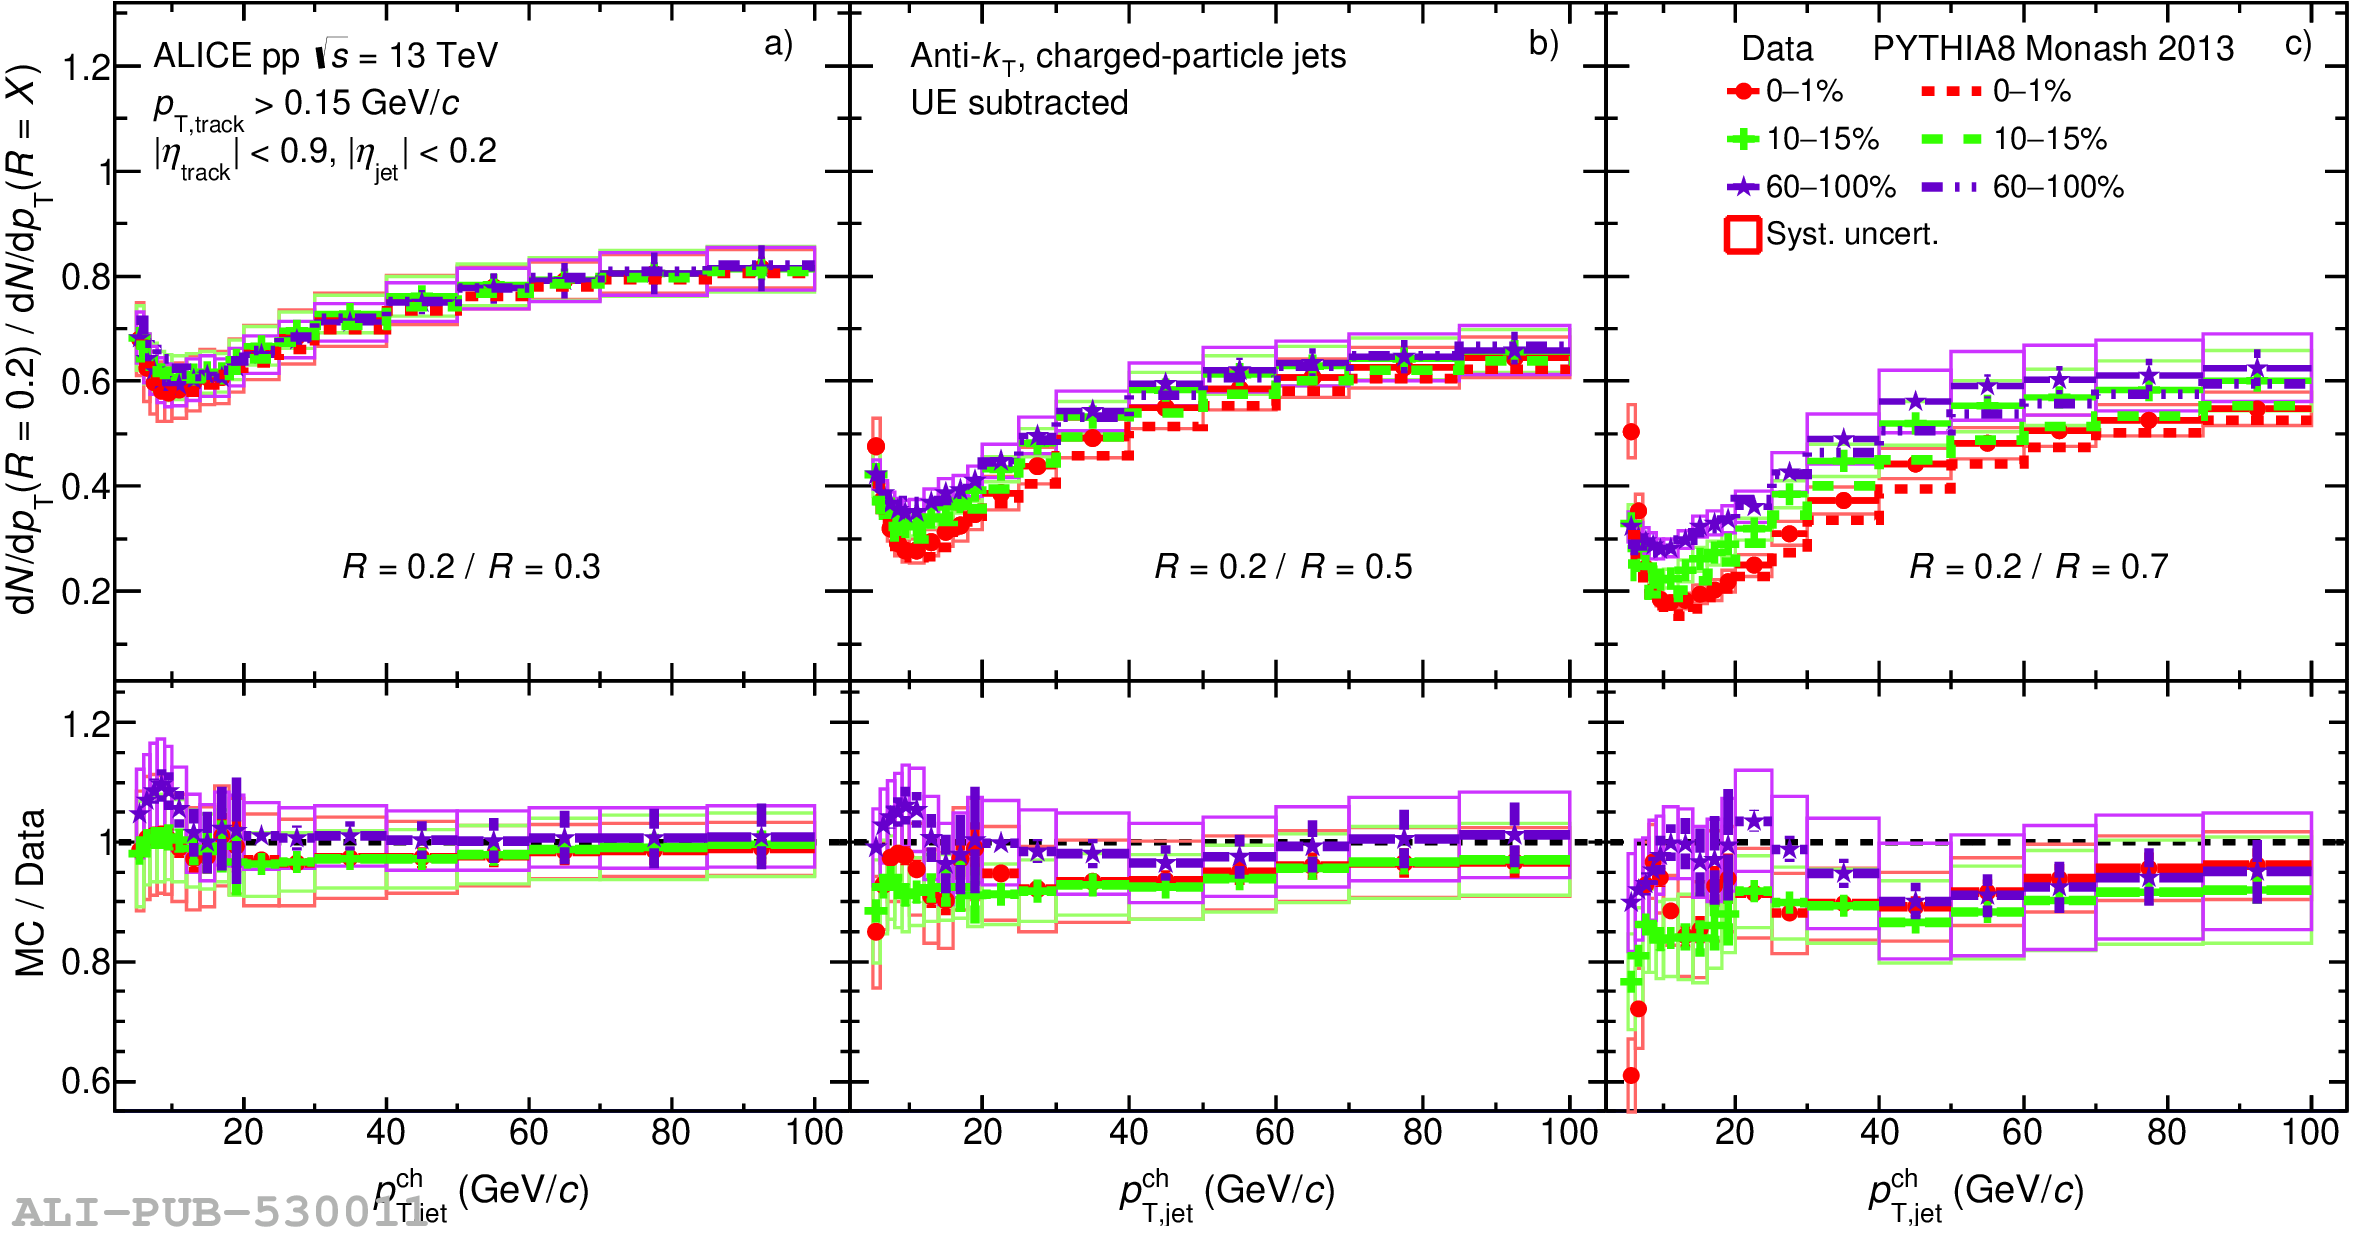 |