Top: Invariant mass distribution of electron-positron pairs for MB (left), HM (middle) and EMCal (right) triggers, together with combinatorial background estimation from the track-rotation method (blue lines in the left and middle panels) and the full background estimation (black squares). In the lower panels, the \jpsi signal obtained after background subtraction is shown together with the \jpsi signal shape from Monte Carlo simulations The entries contain a correction for the relative efficiency (see text) The vertical lines indicate the mass range for the signal counting. | 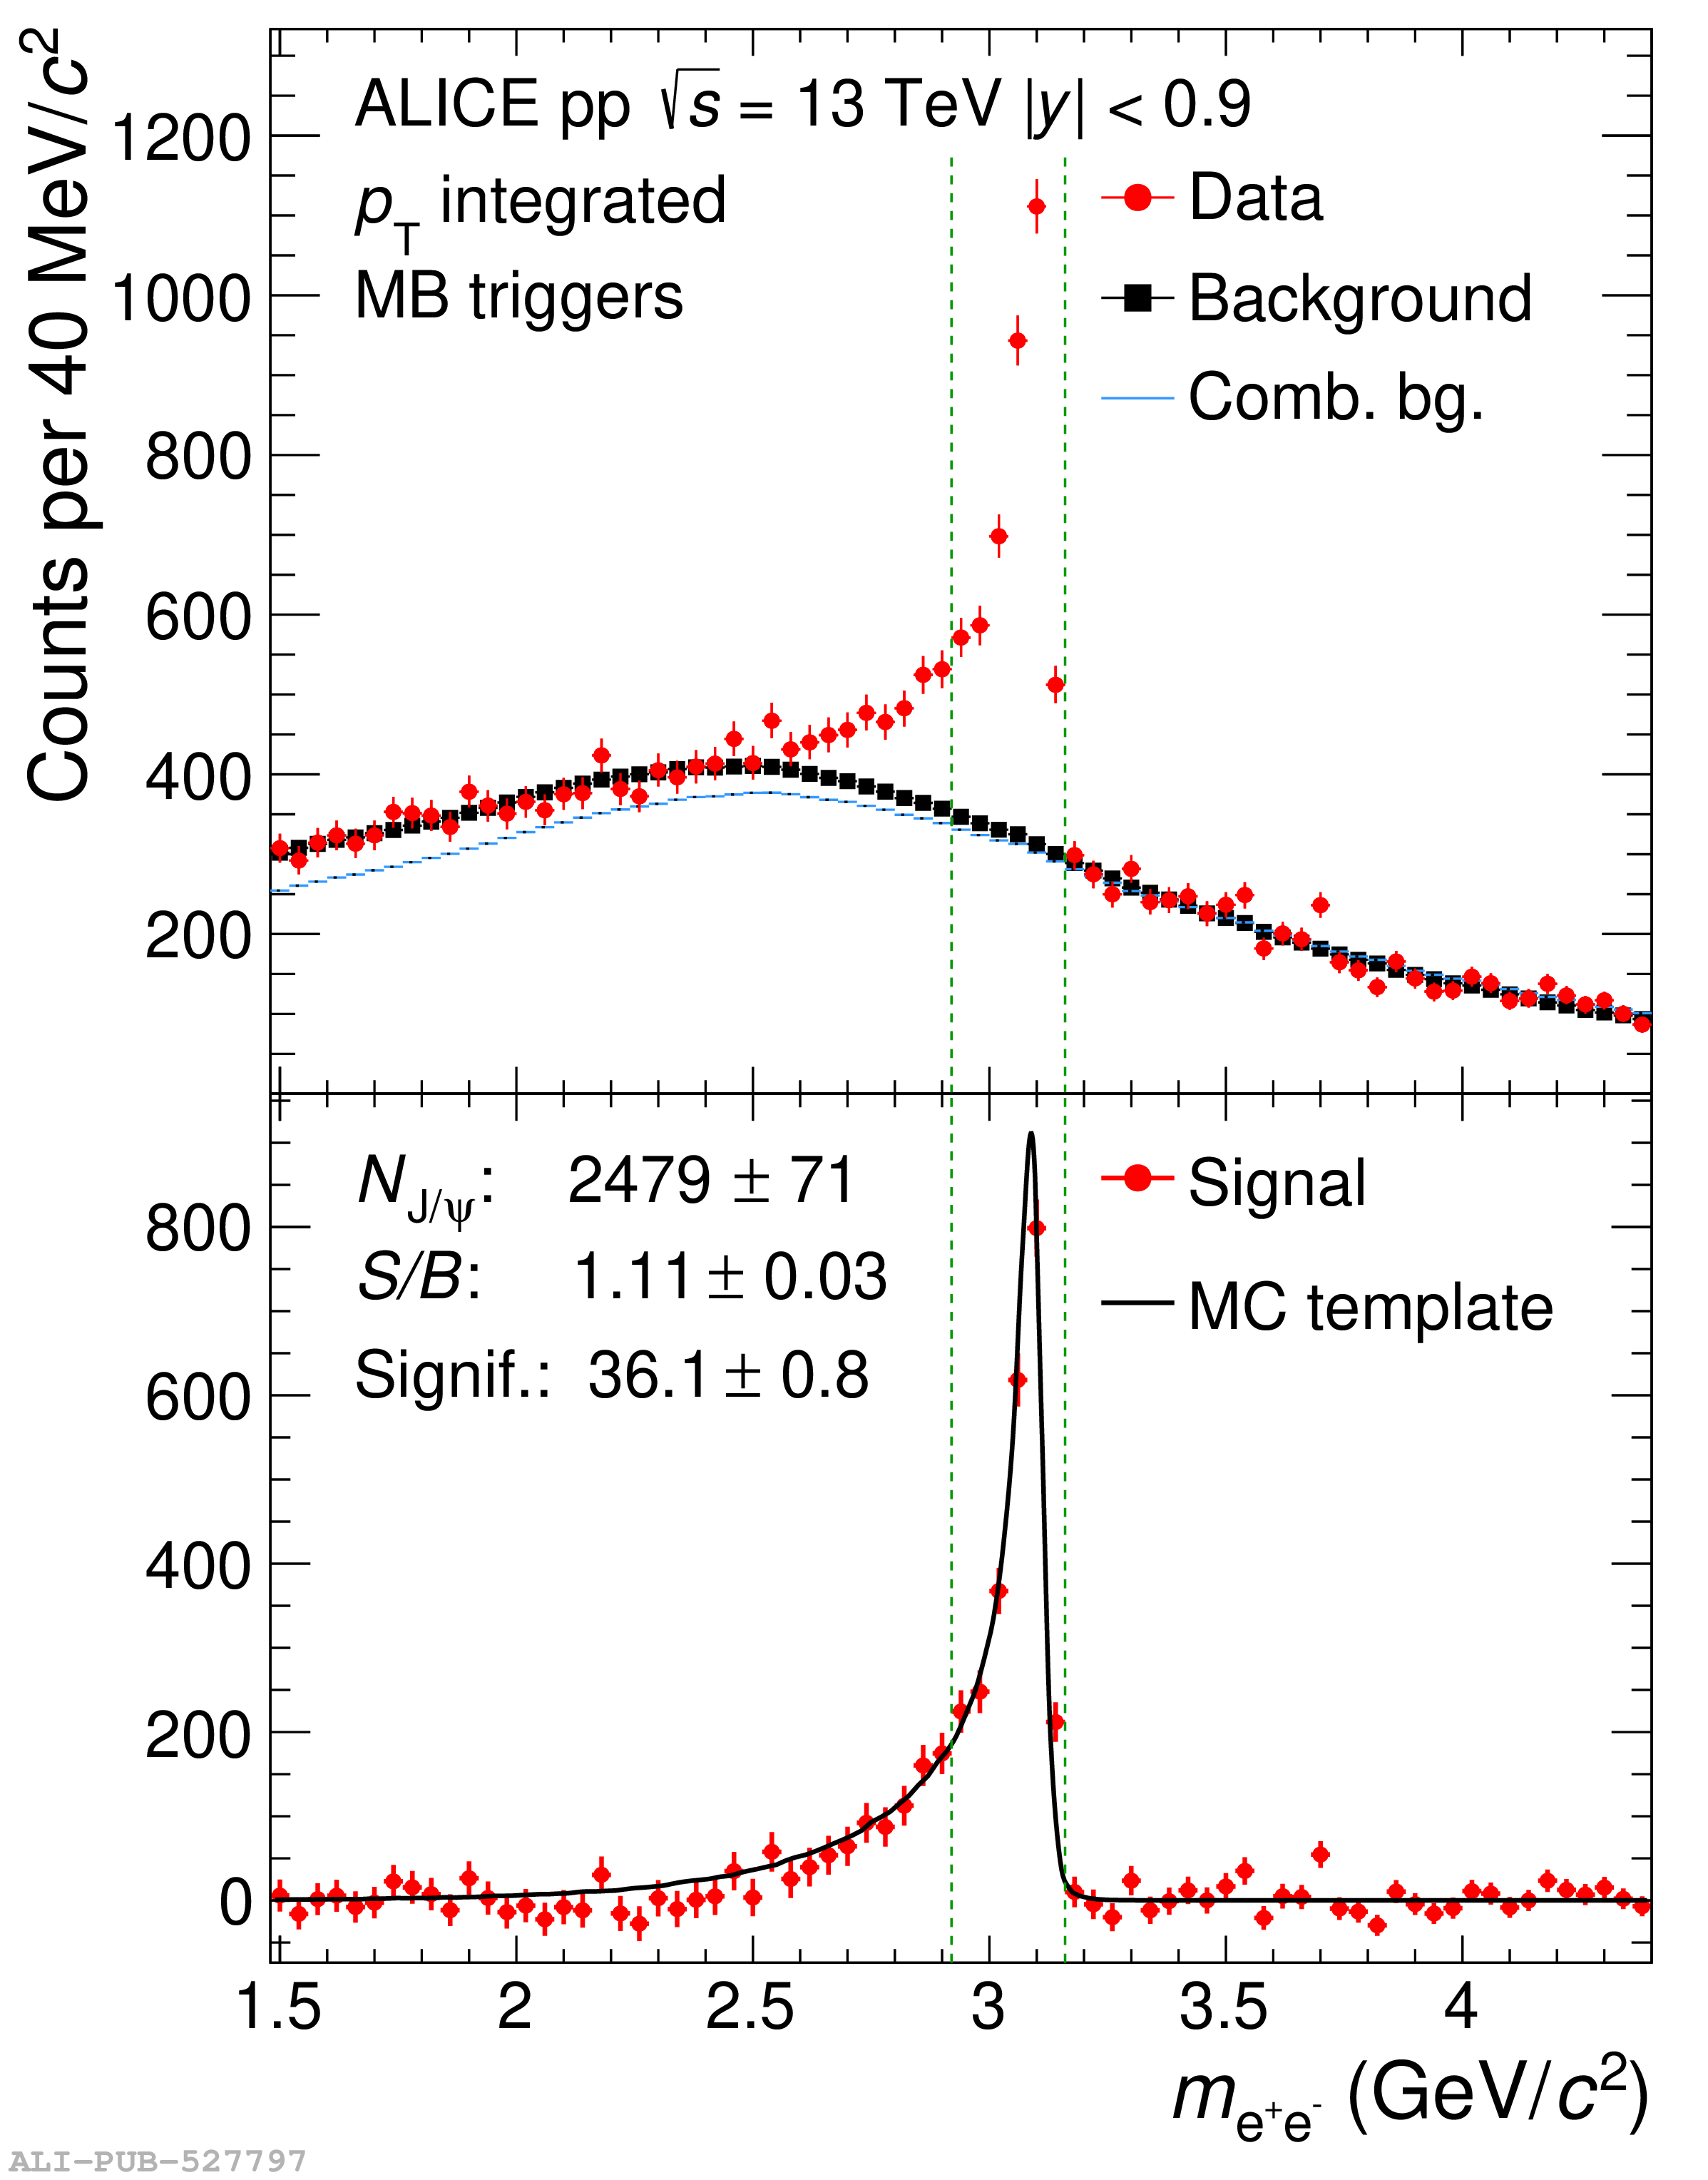 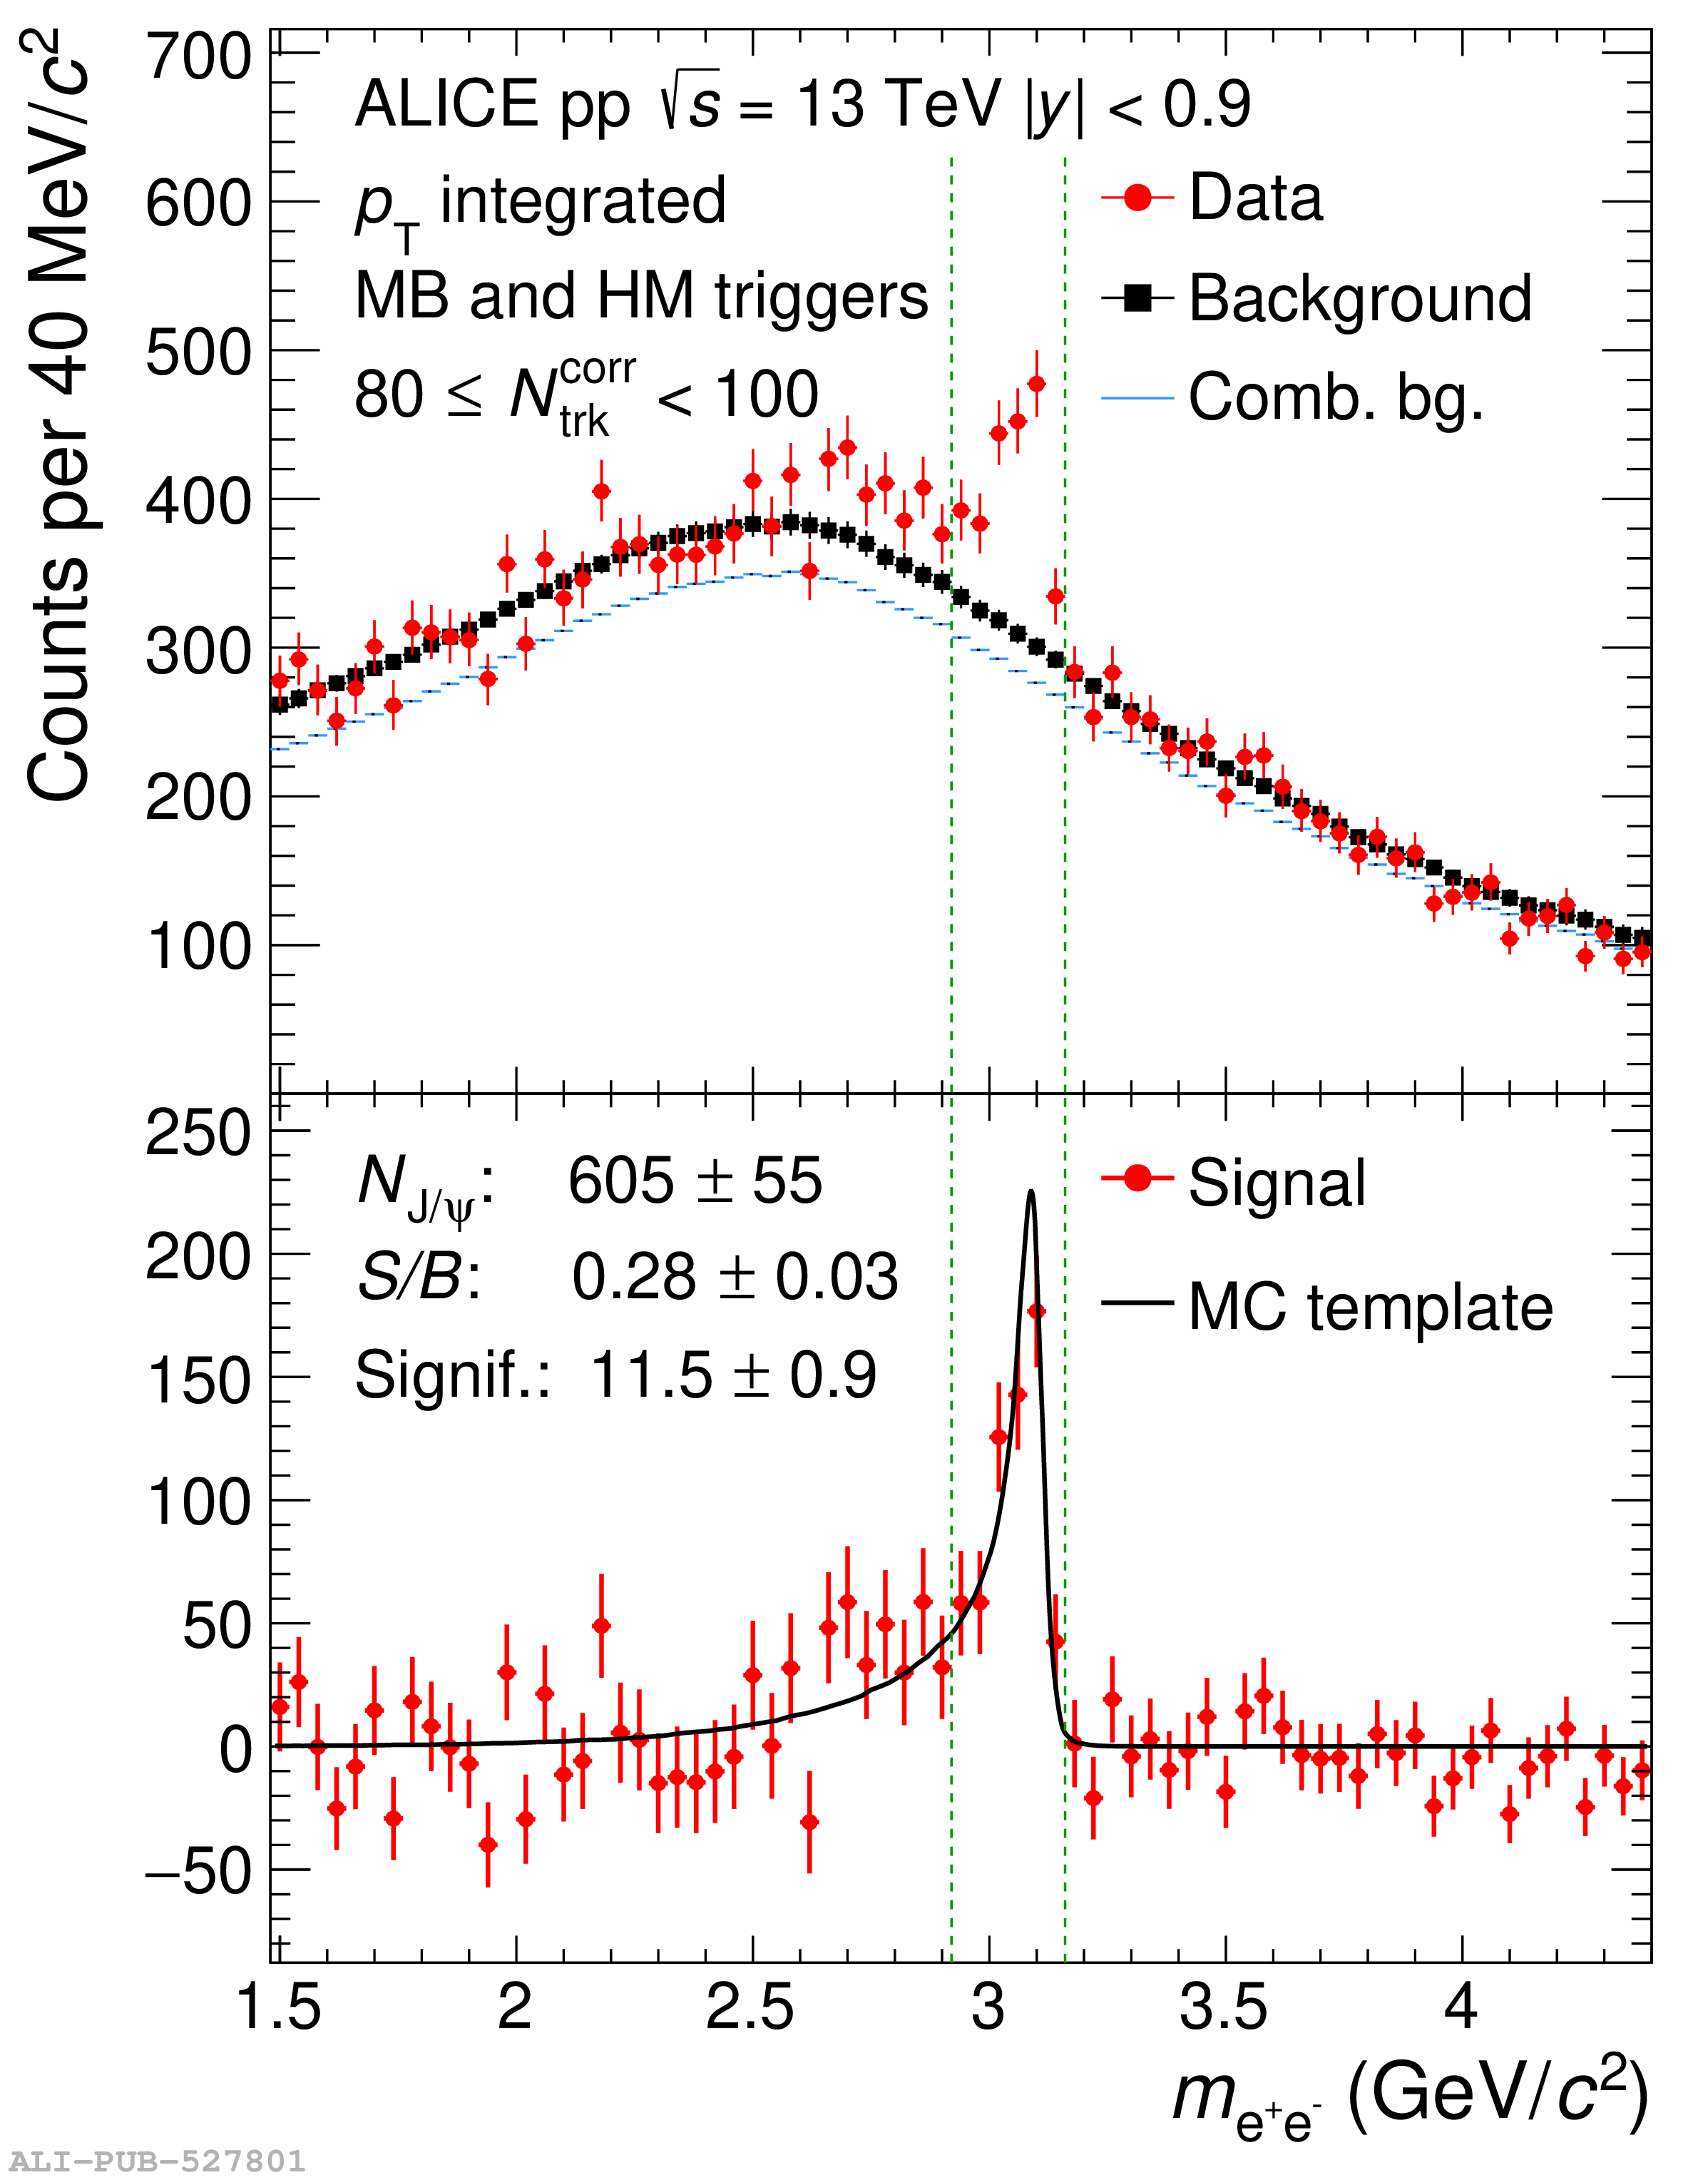  |