Distribution of the corrected SPD tracklets \ntrcorr (left) and V0 amplitude (right) for the MB events as well as the HM- and EMCal-triggered events used in the analysis. The vertical lines indicate the used multiplicity intervals (see Table \ref{tab:mult}; the first bin spans from 0 to the position of the first line). For the HM-triggered events, the V0 amplitude distribution for a single data taking period is included for illustration (open squares). | 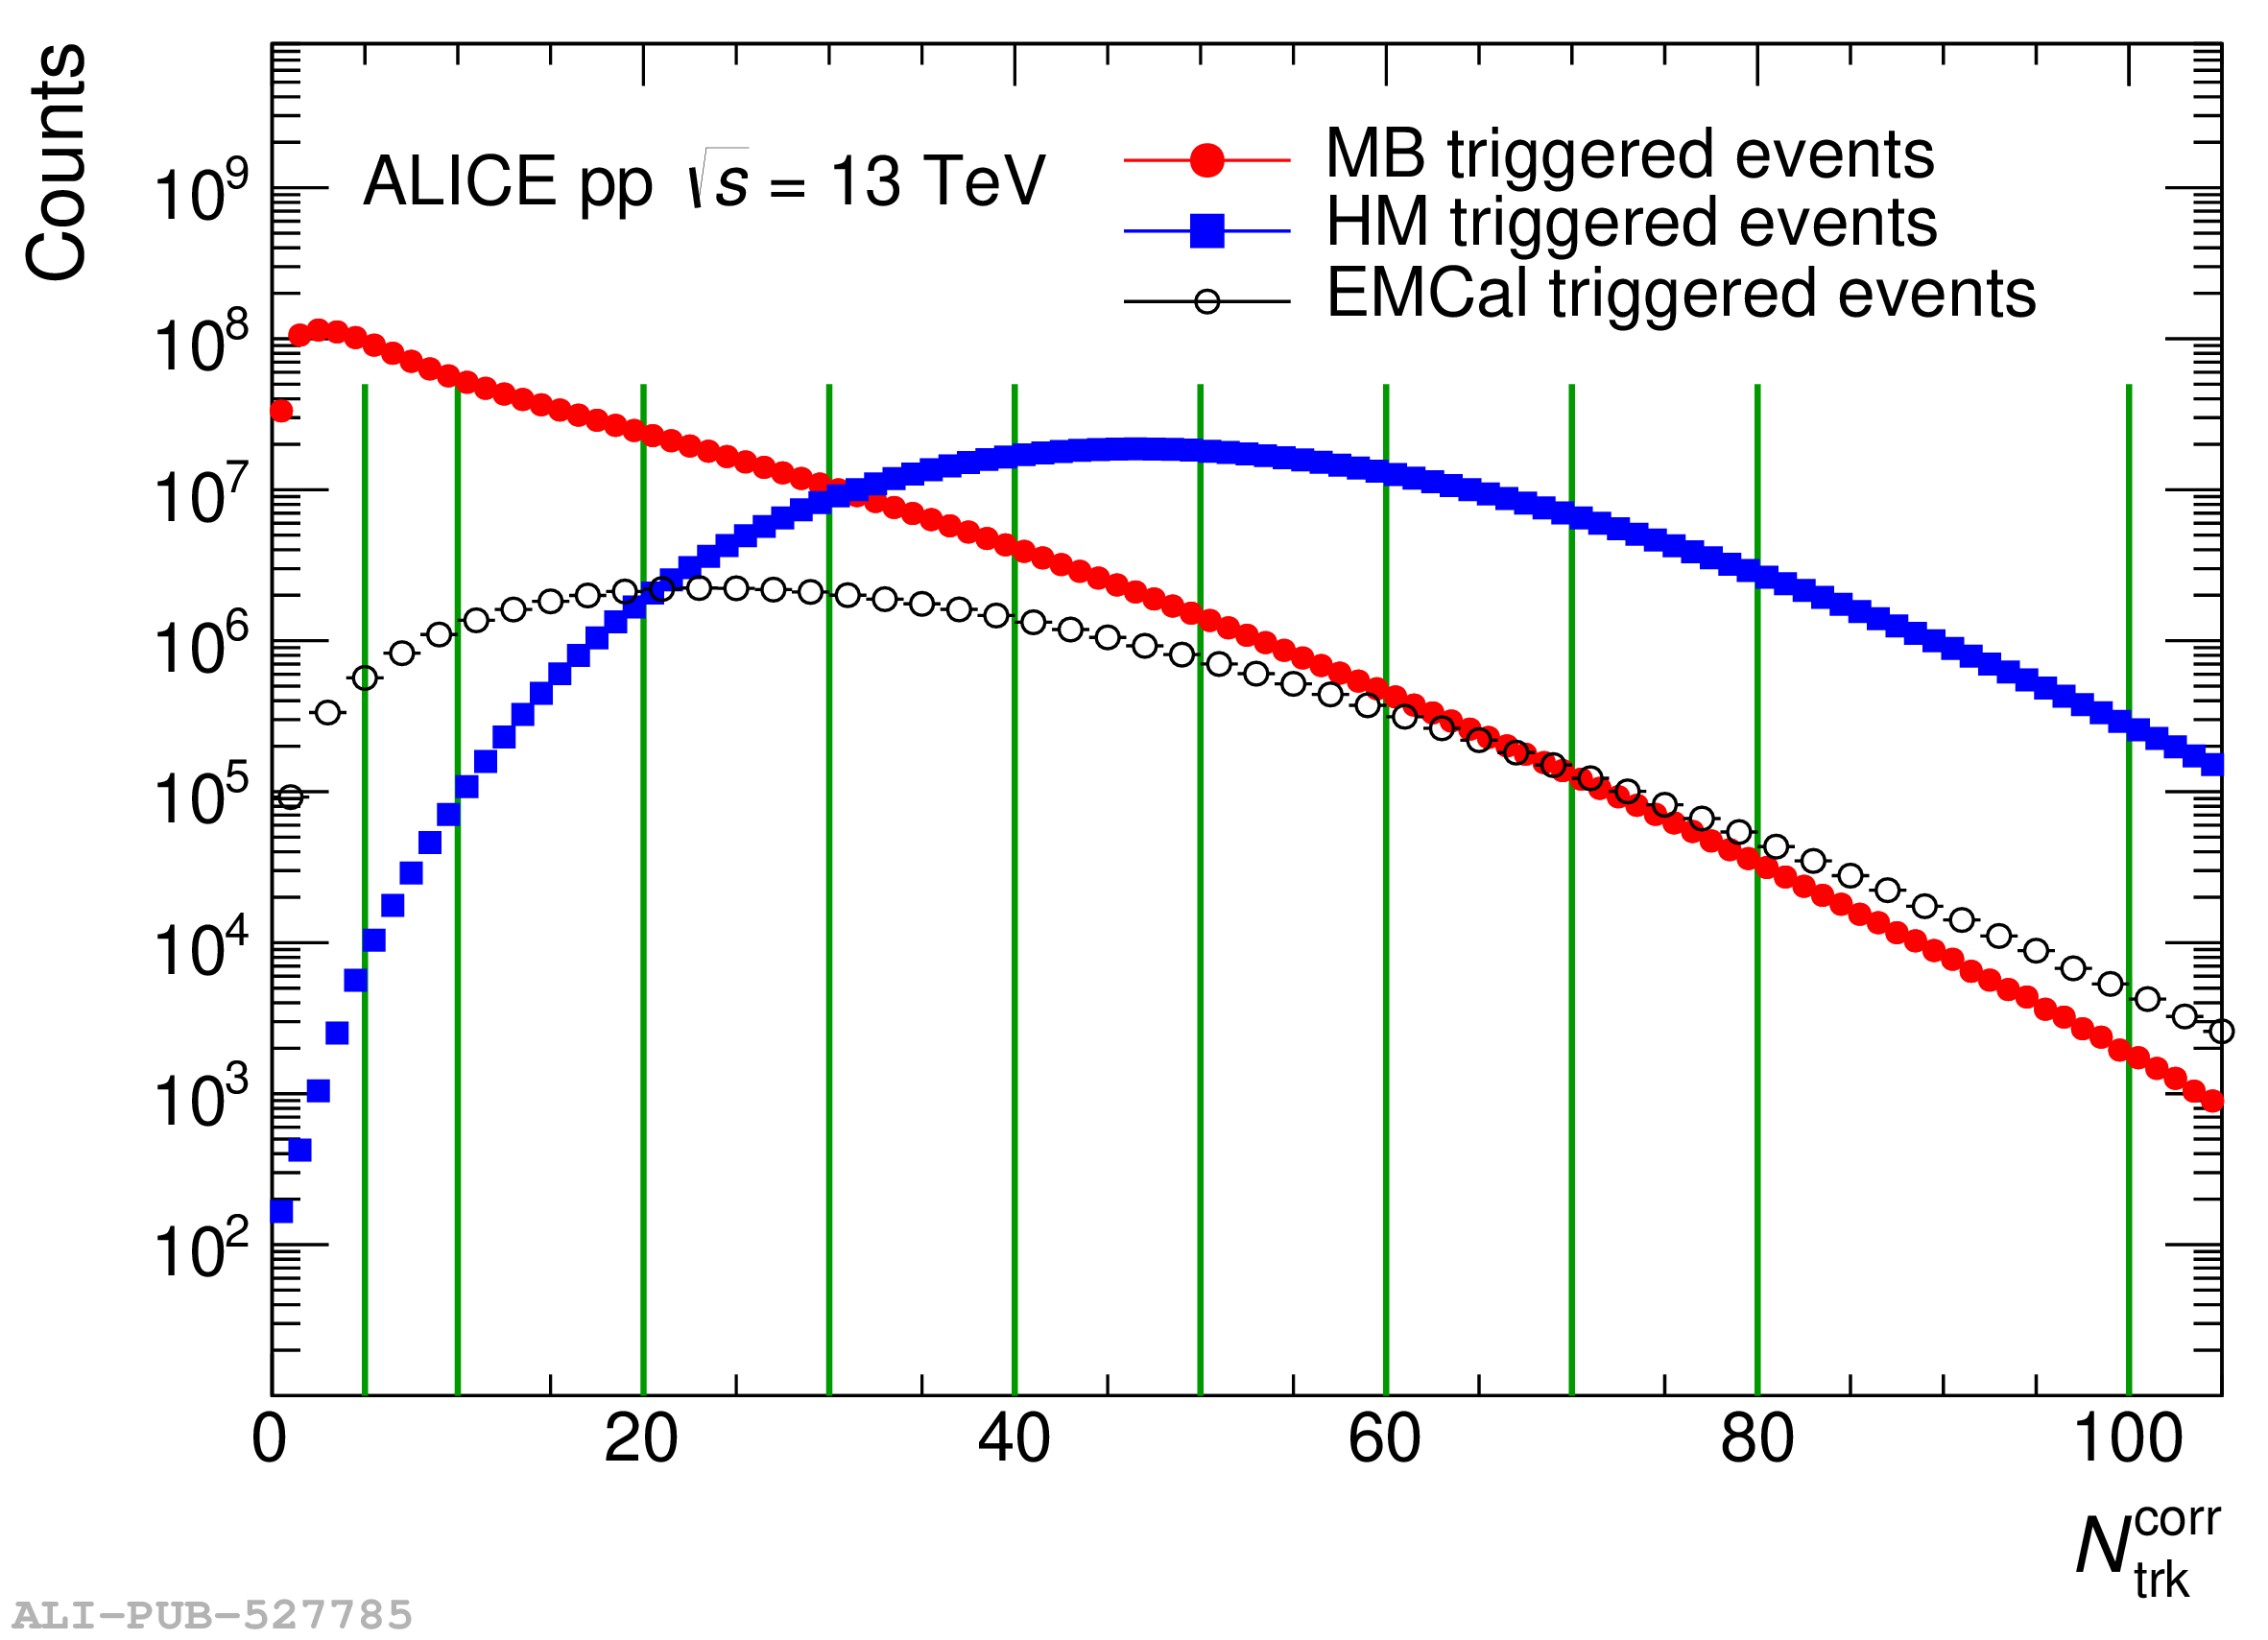 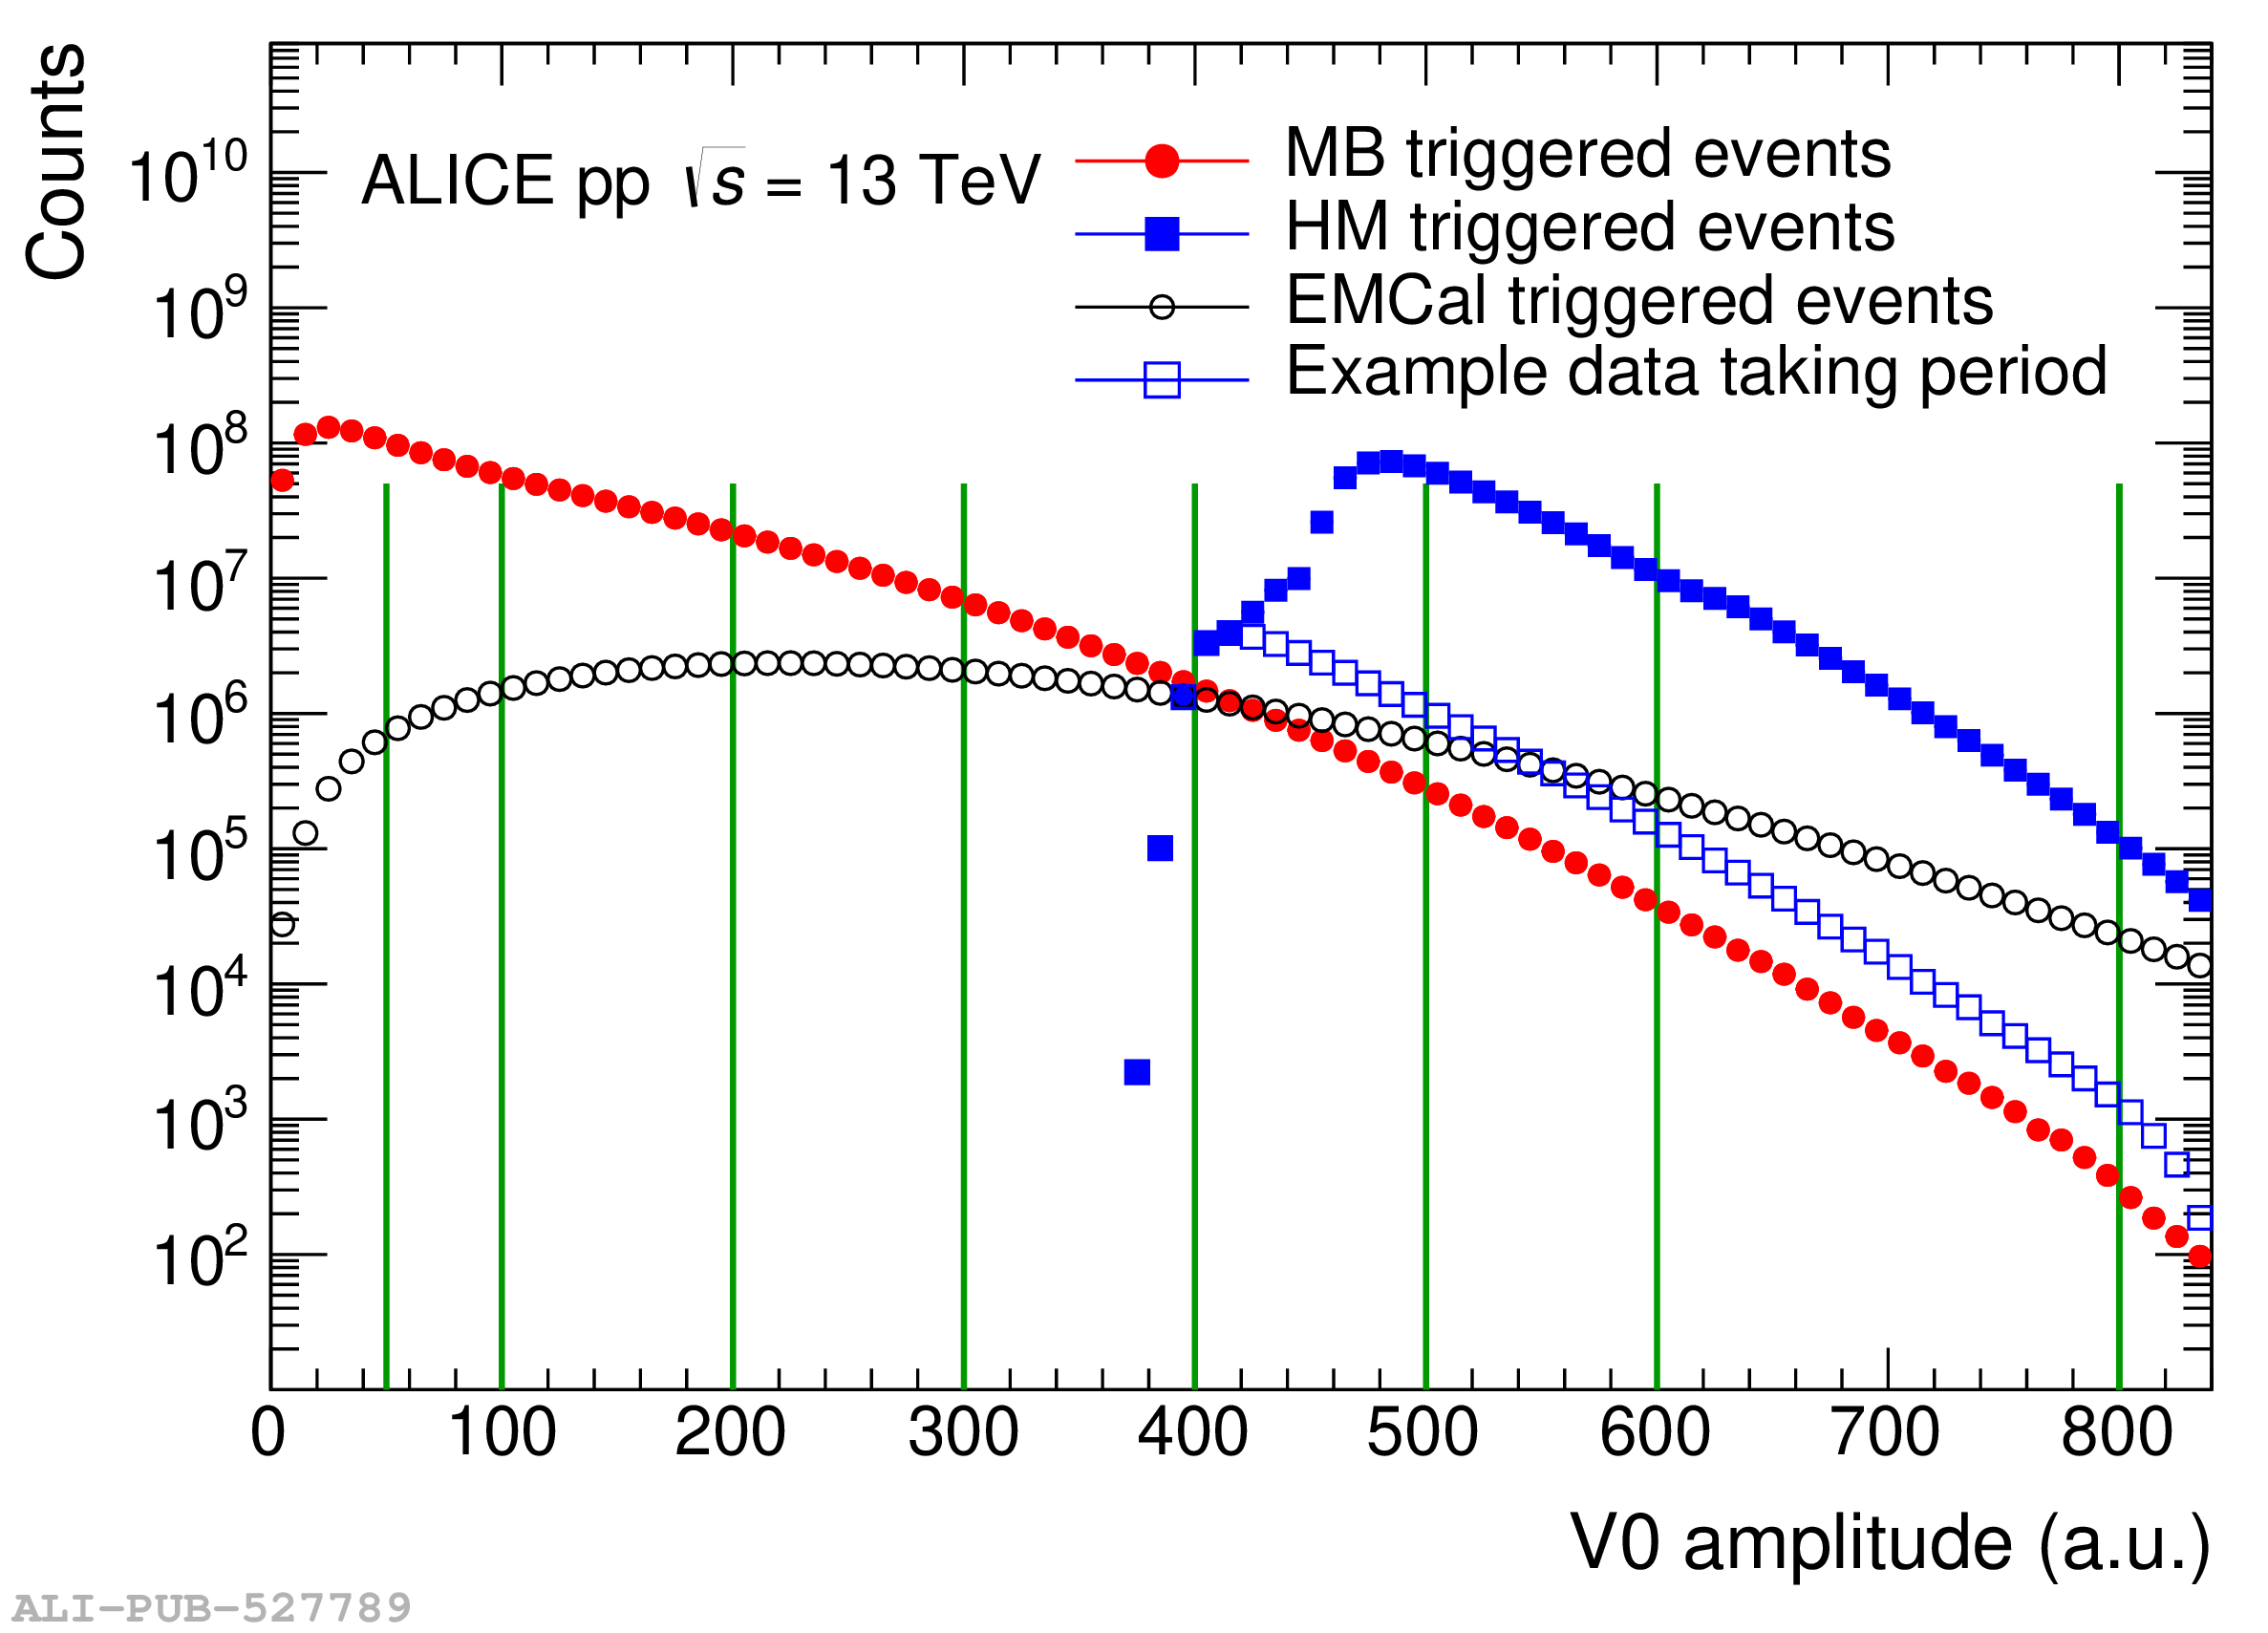 |