Comparison of $\langle N_{\rm ch} \rangle$, $\omega_{\rm ch}$, and$\sigma_{\rm ch}^2/\langle N_{\rm ch} \rangle^2$ measured in this workbased on the acceptance of the PHENIX experiment with results reported by PHENIX as a function of number of participating nucleons, shown in panels(a), (b), and (c), respectively The statistical uncertainties are smaller than the size of the markers. The systematic uncertainties are presented as filled boxes. | 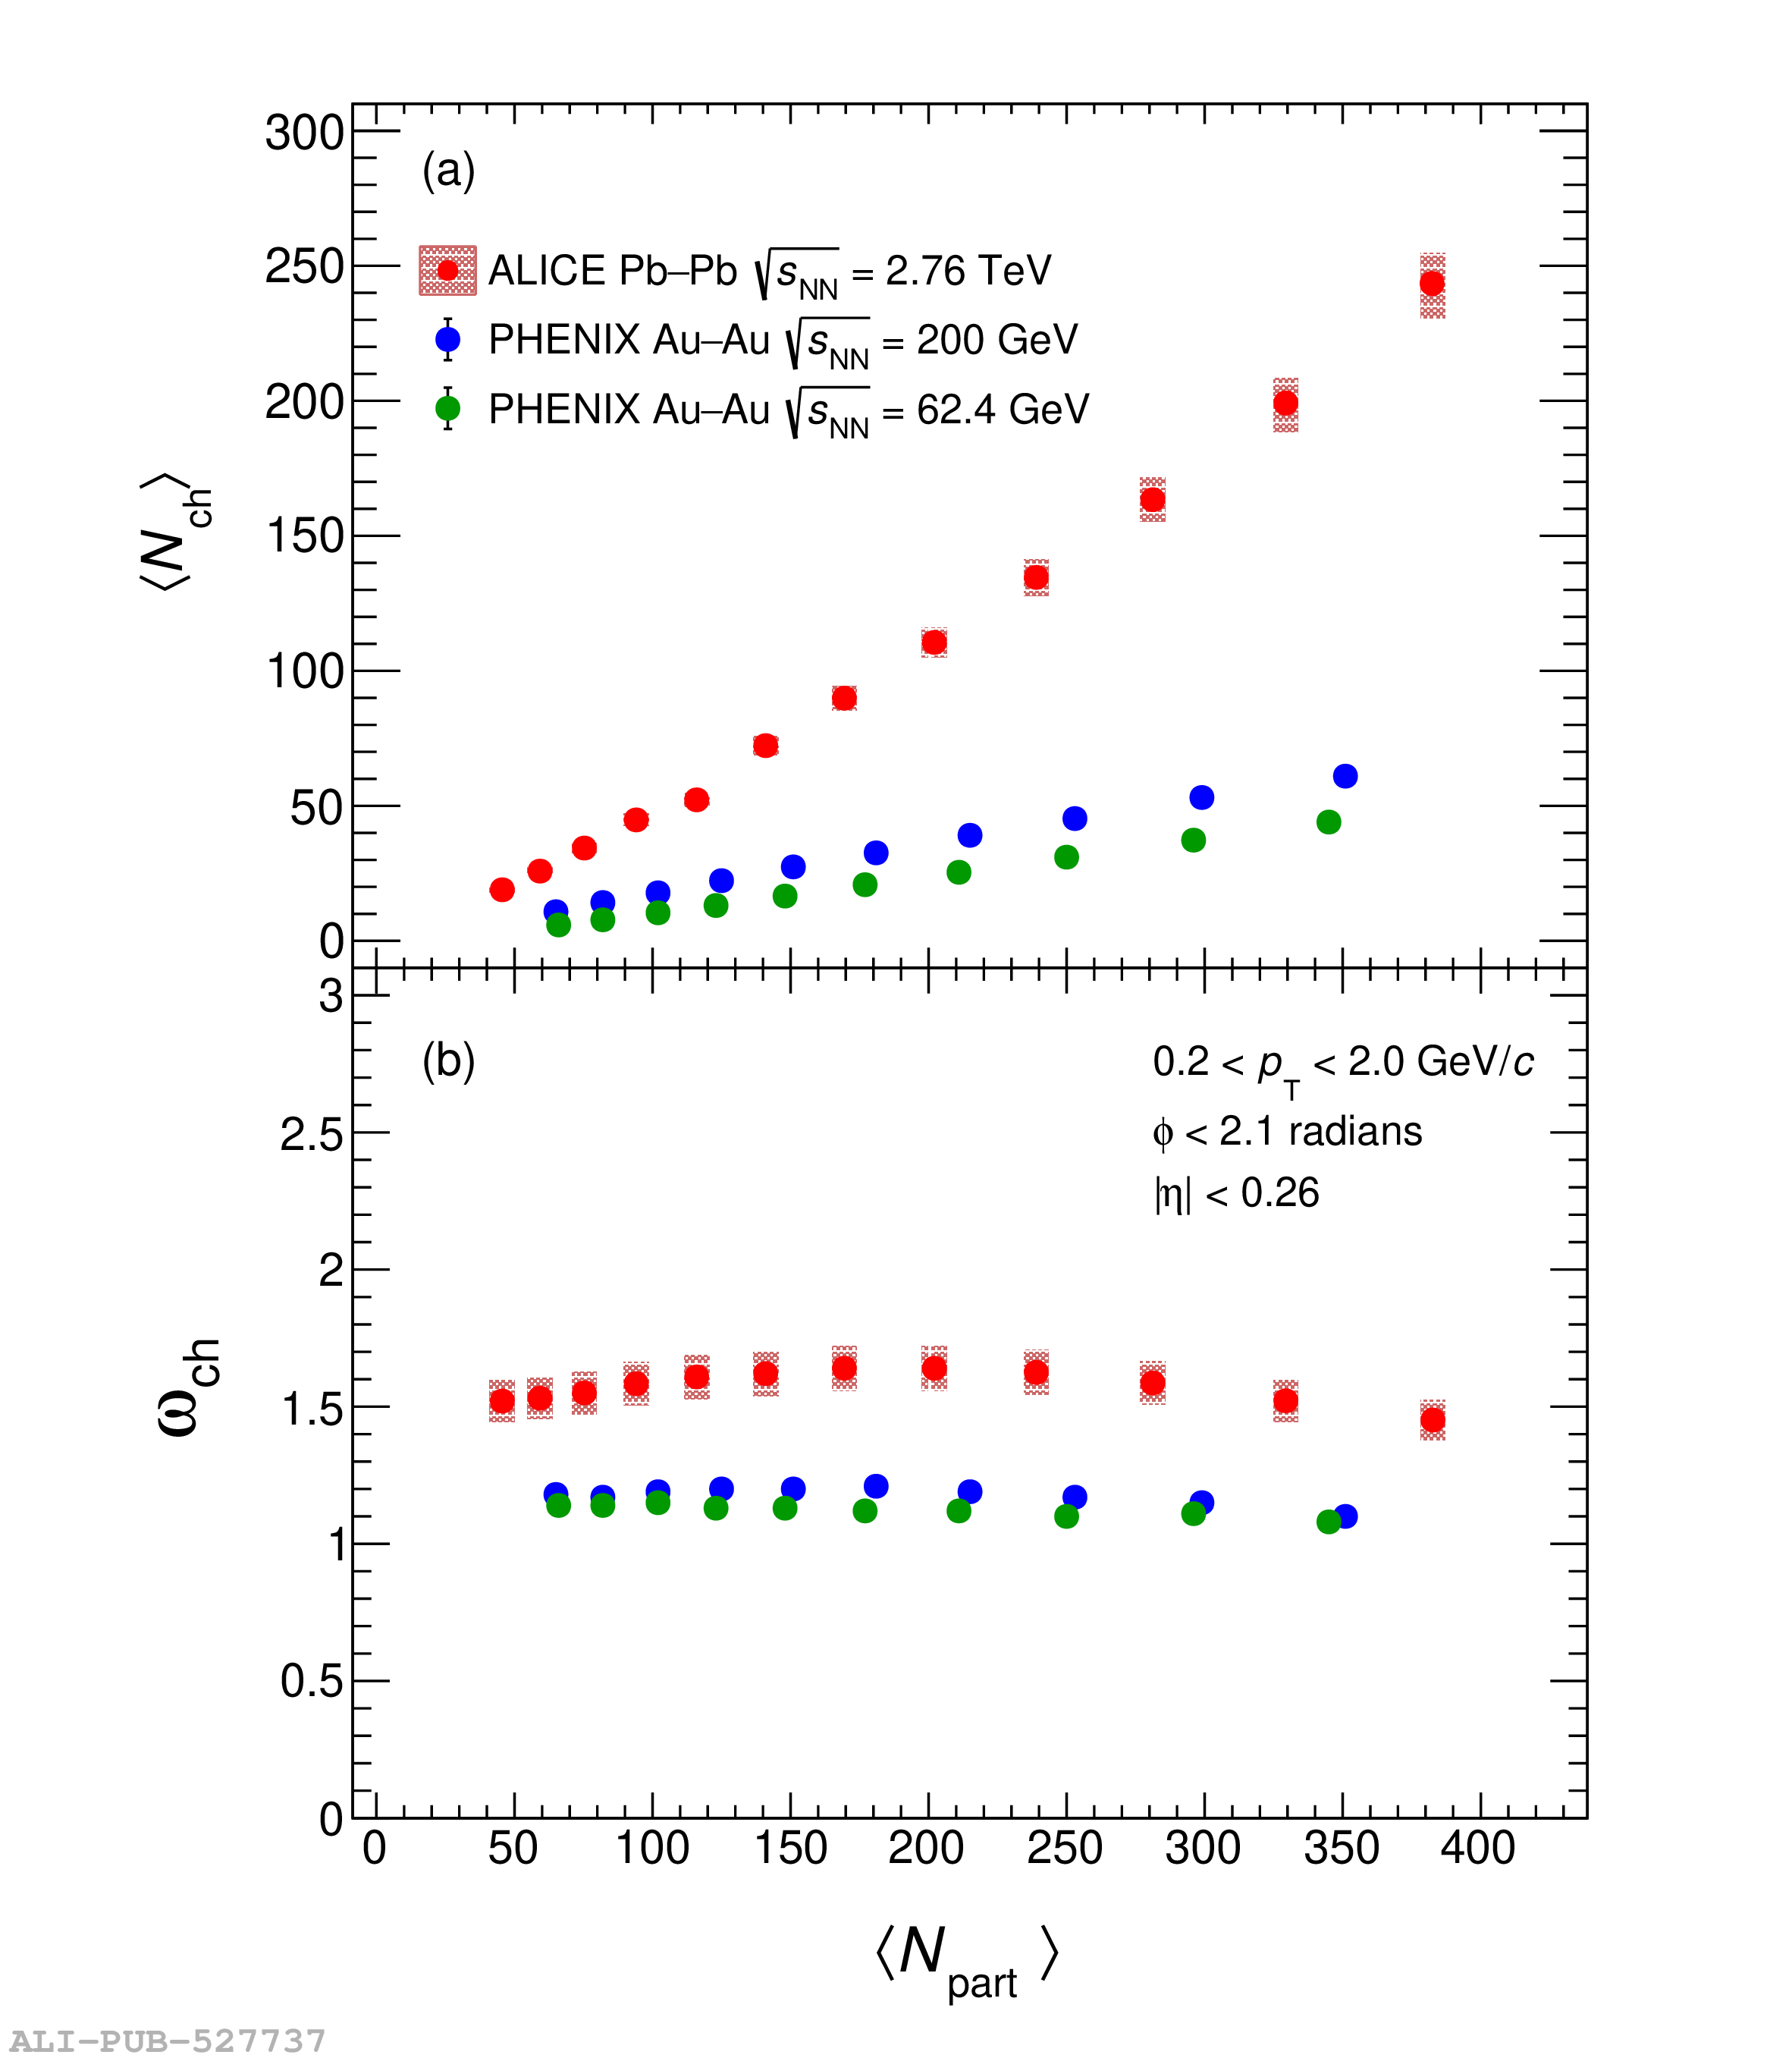 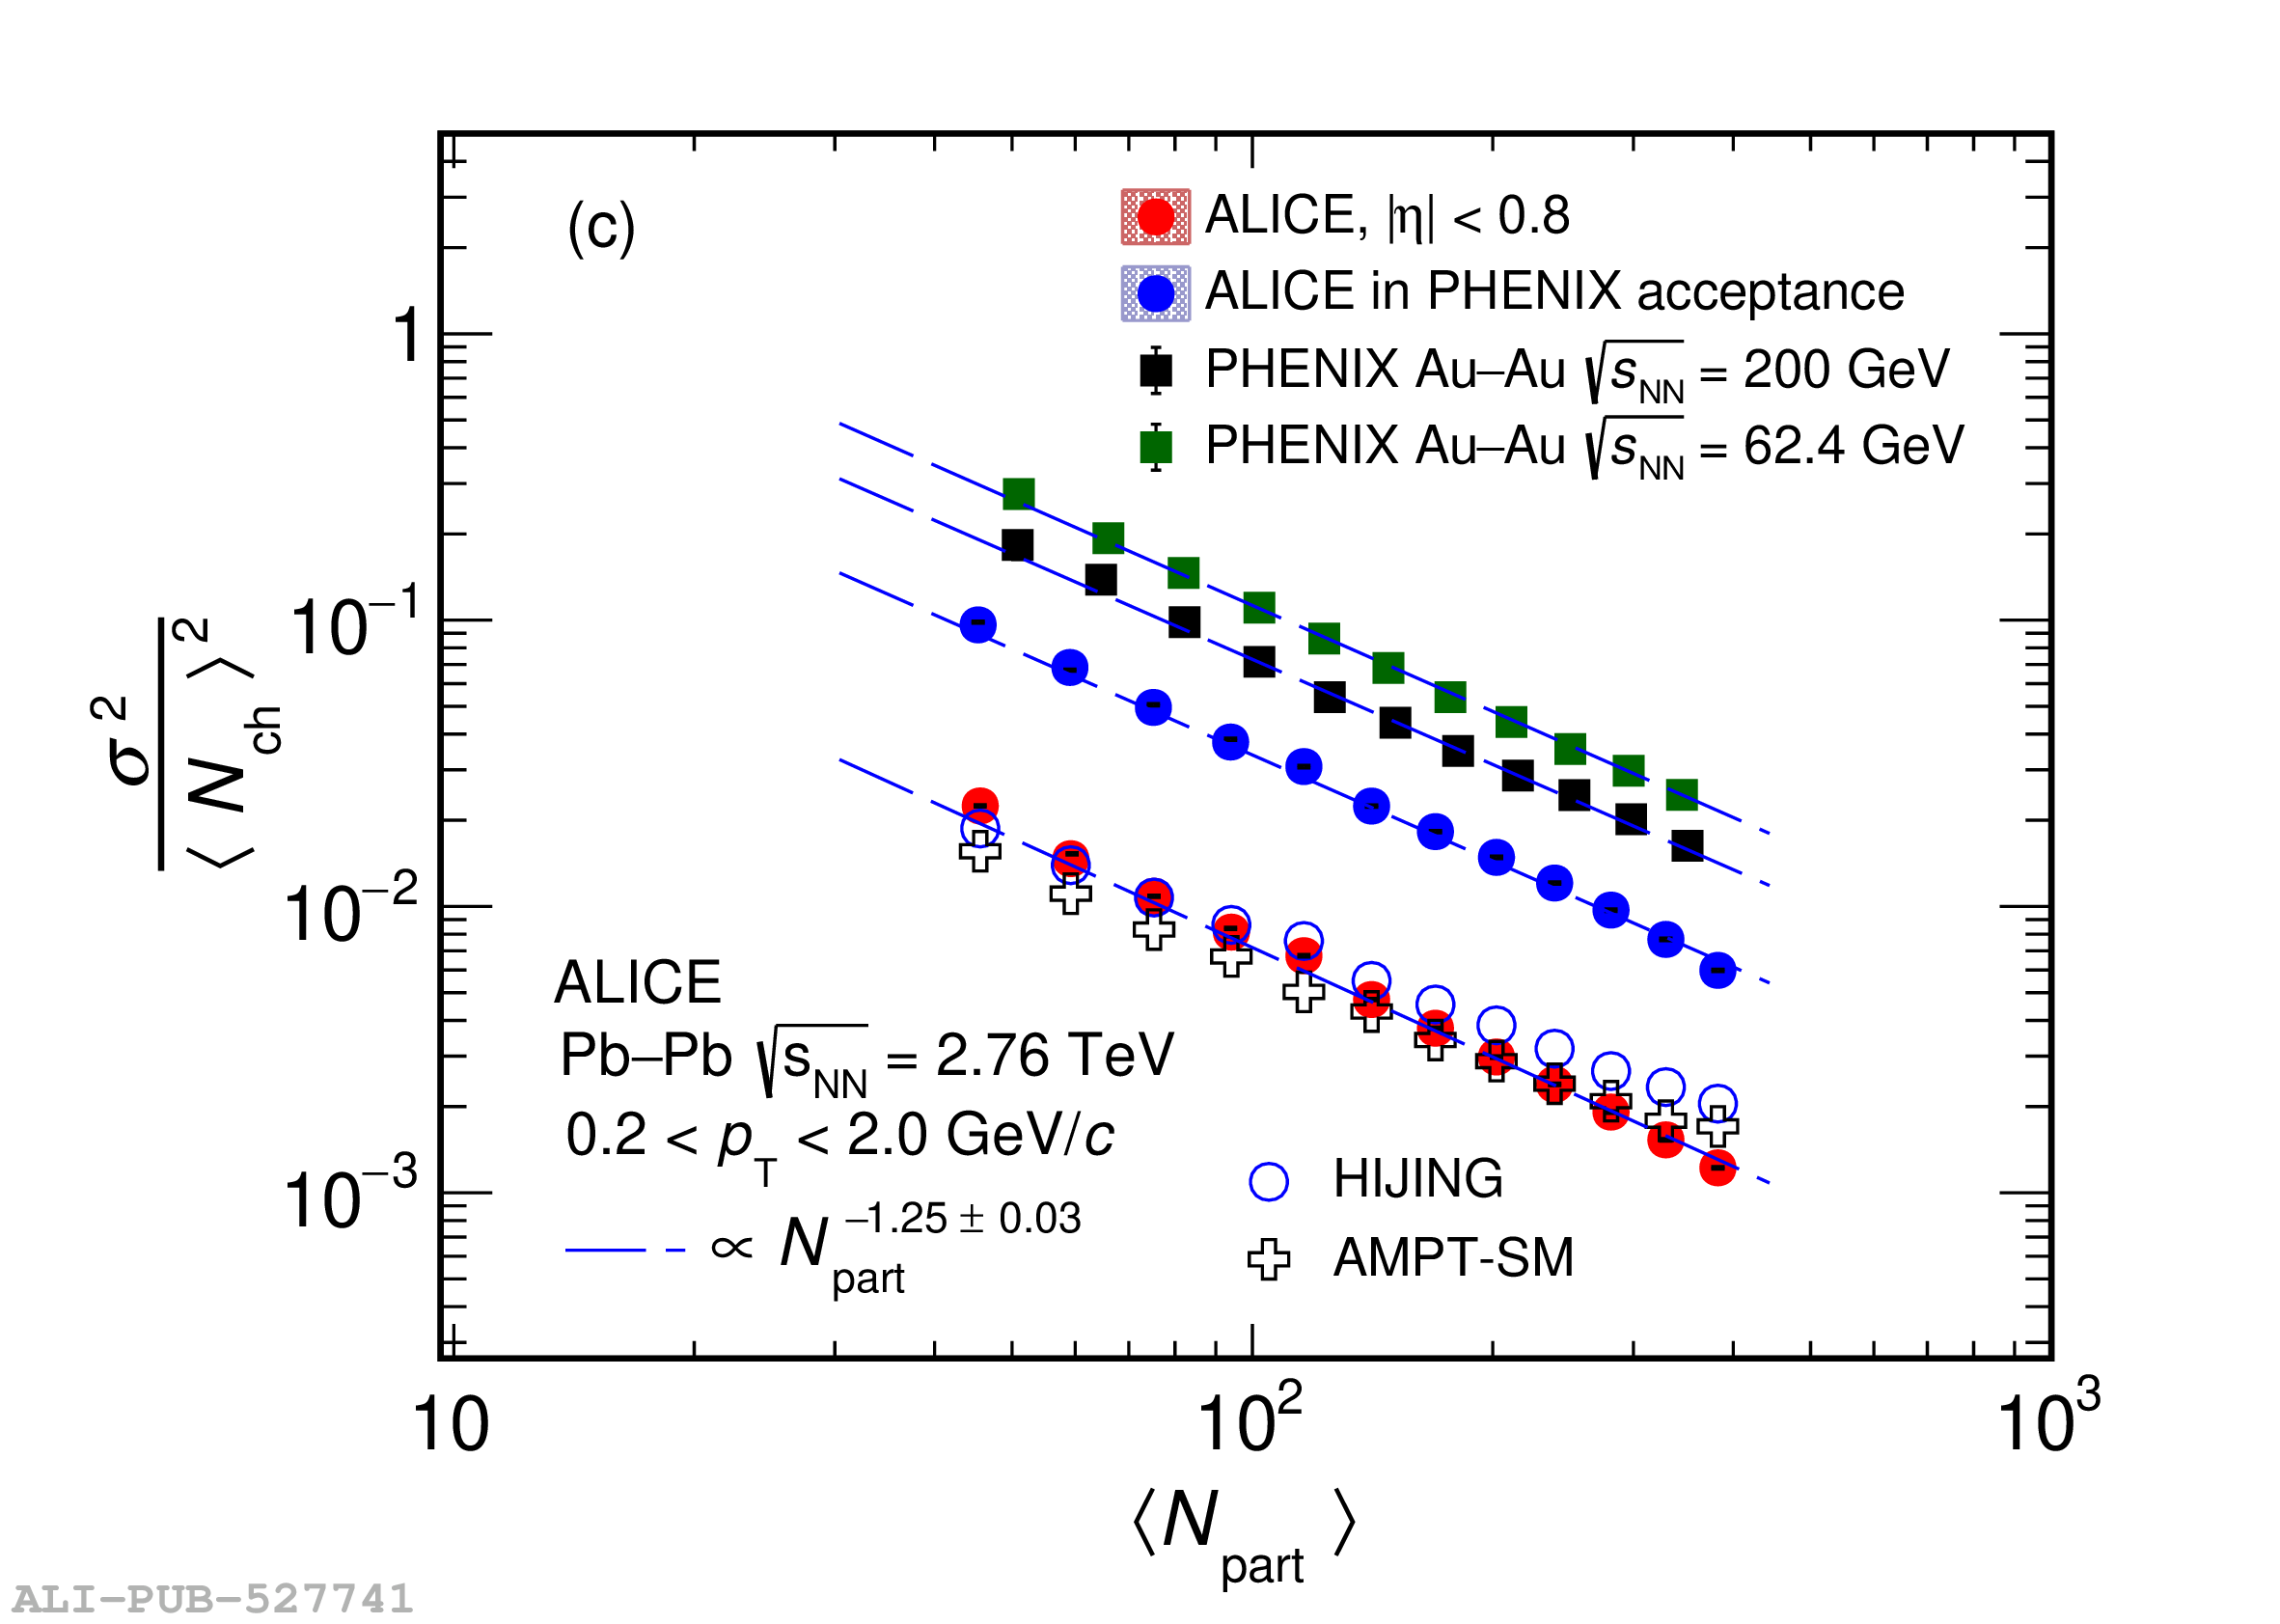 |