Per-trigger yield ratios of \K-h (left column) or \lam-h (right column) to h-h at the near-side as a function of \pttrig in the left plot and as a function of \ptassoc in the right plot, compared with the PYTHIA8 calculation of the quark and gluon jets. Error bars and colored boxes represent statistical and systematic uncertainties, respectively. The bands around model curves stand for their statistical uncertainty. |  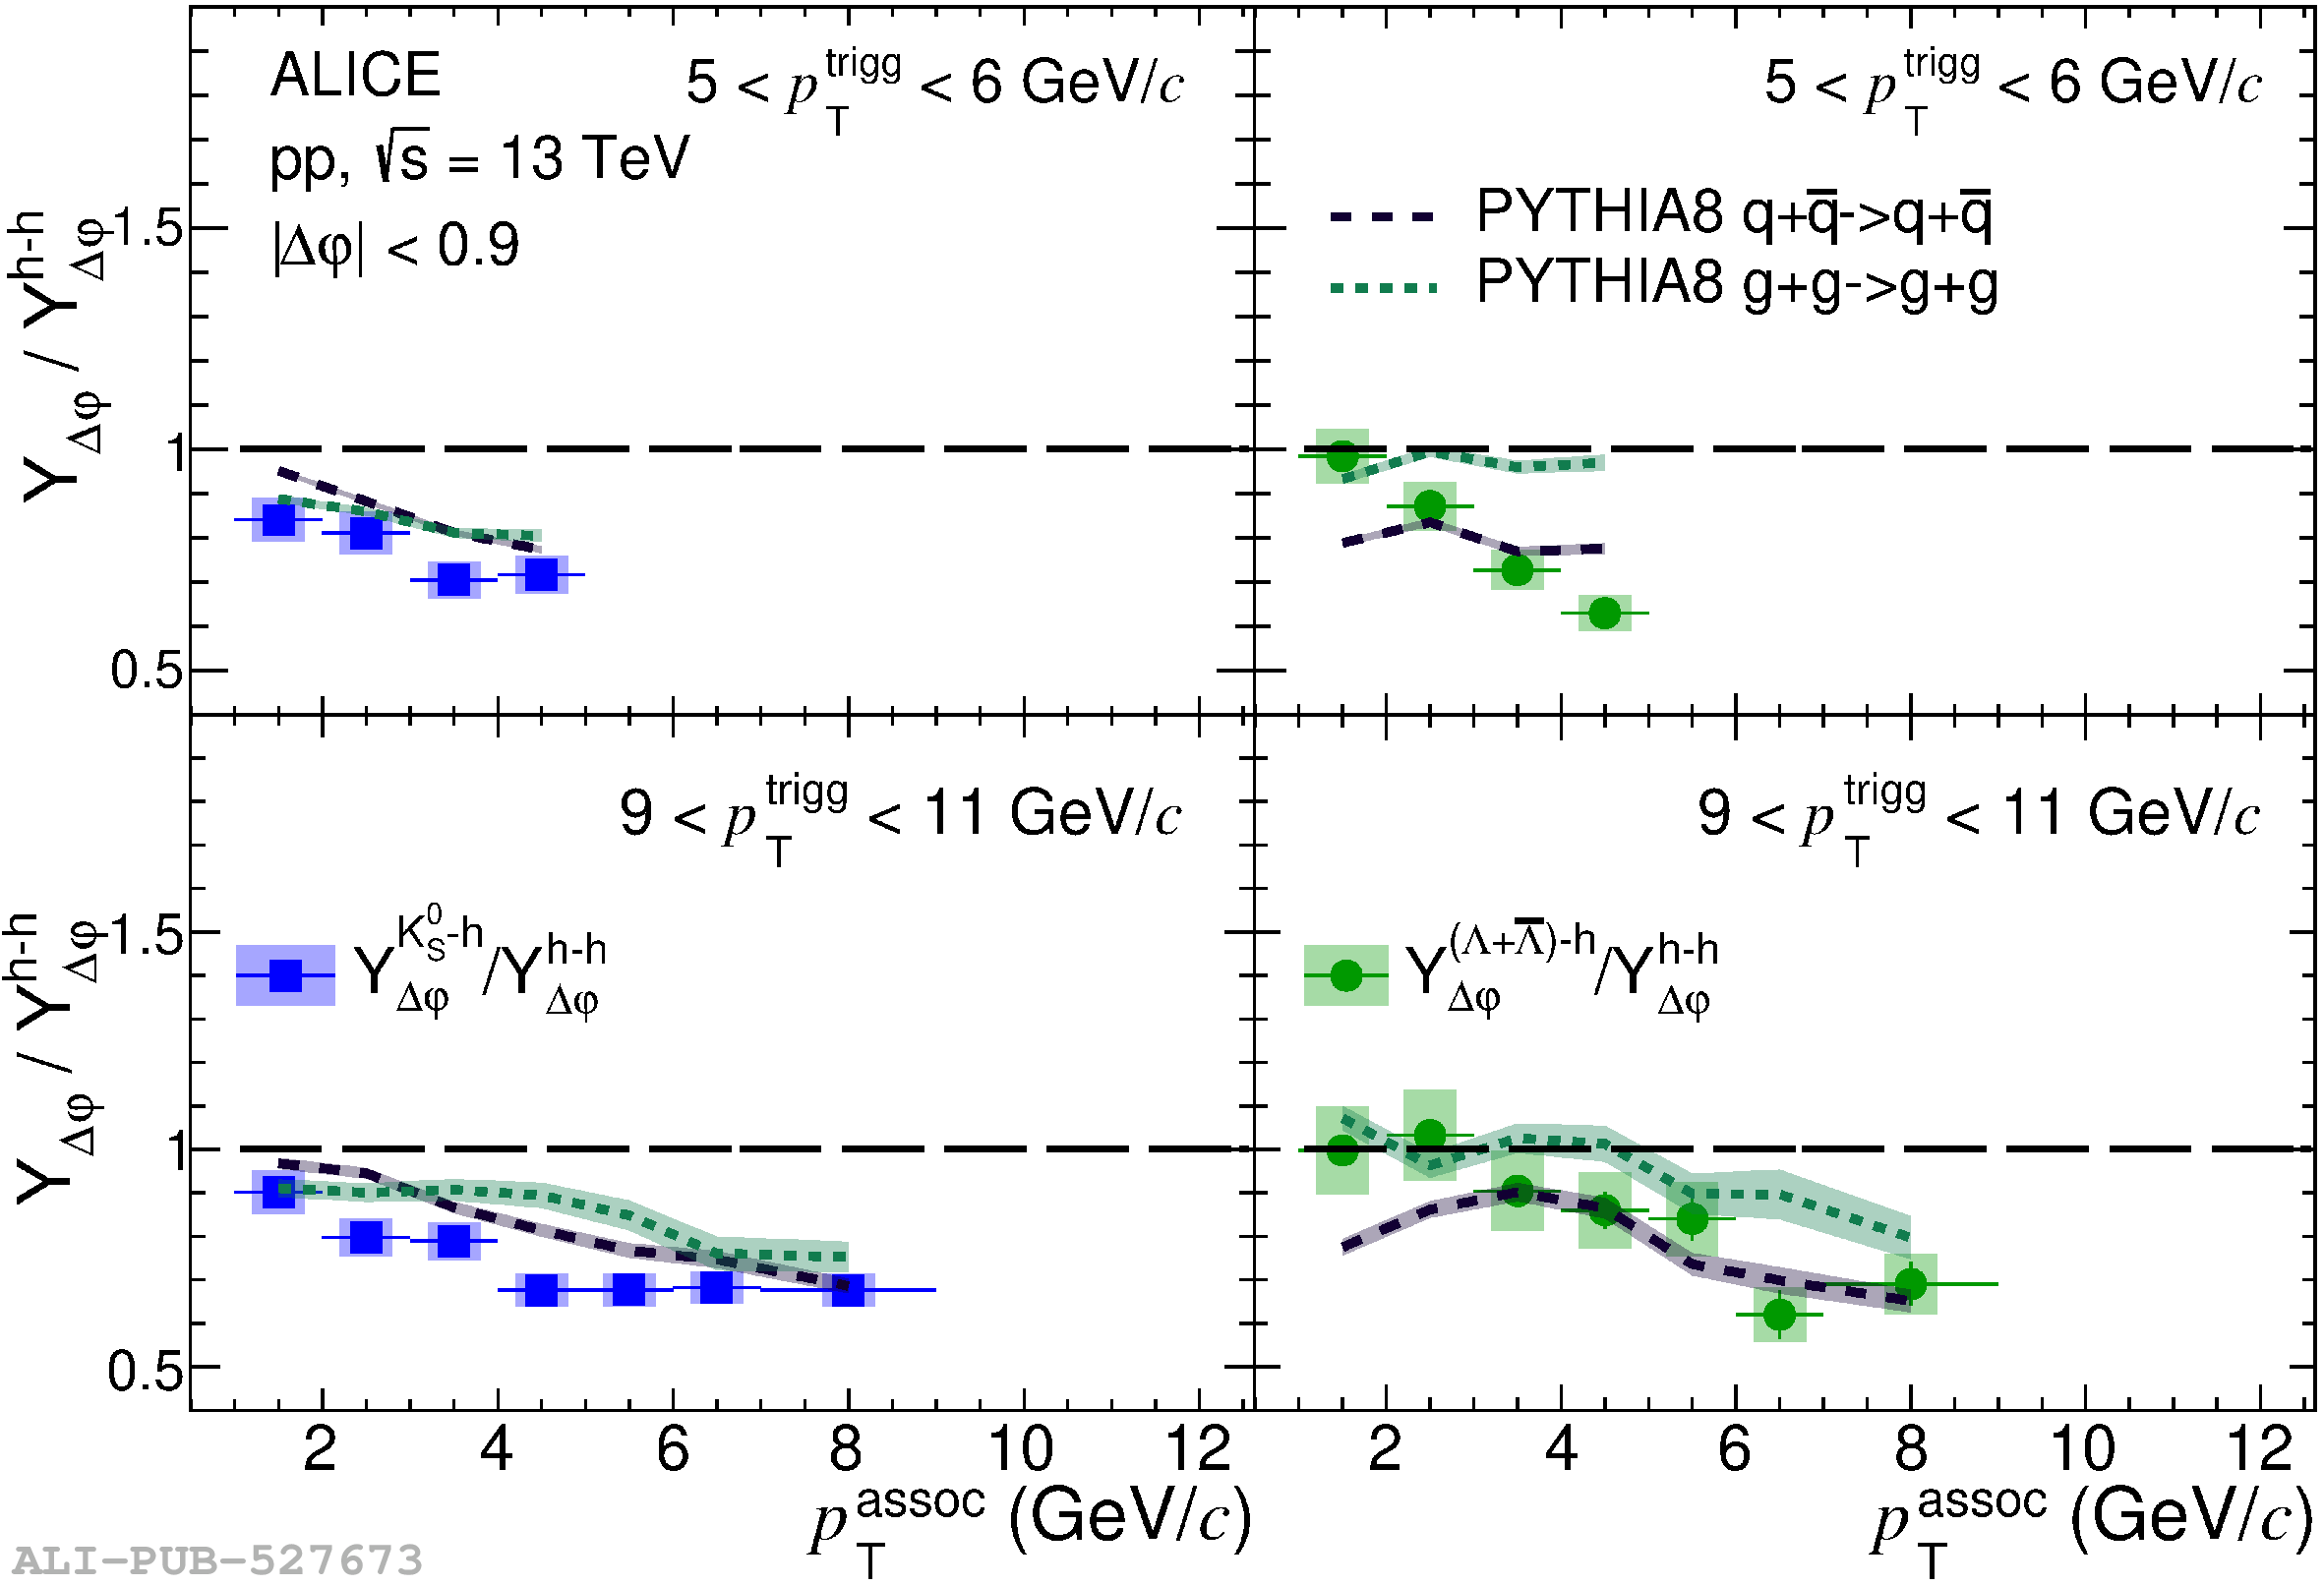 |