Ratios of integrated per-trigger yield of \K-h (left column) or \lam-h (right column) to h-h as a function of \pttrig, for the near-side in the left plot and for the away-side in the right plot, for different event multiplicity classes. Error bars and colored boxes represent statistical and systematic uncertainties, respectively. The bands around model curves stand for their statistical uncertainty. | 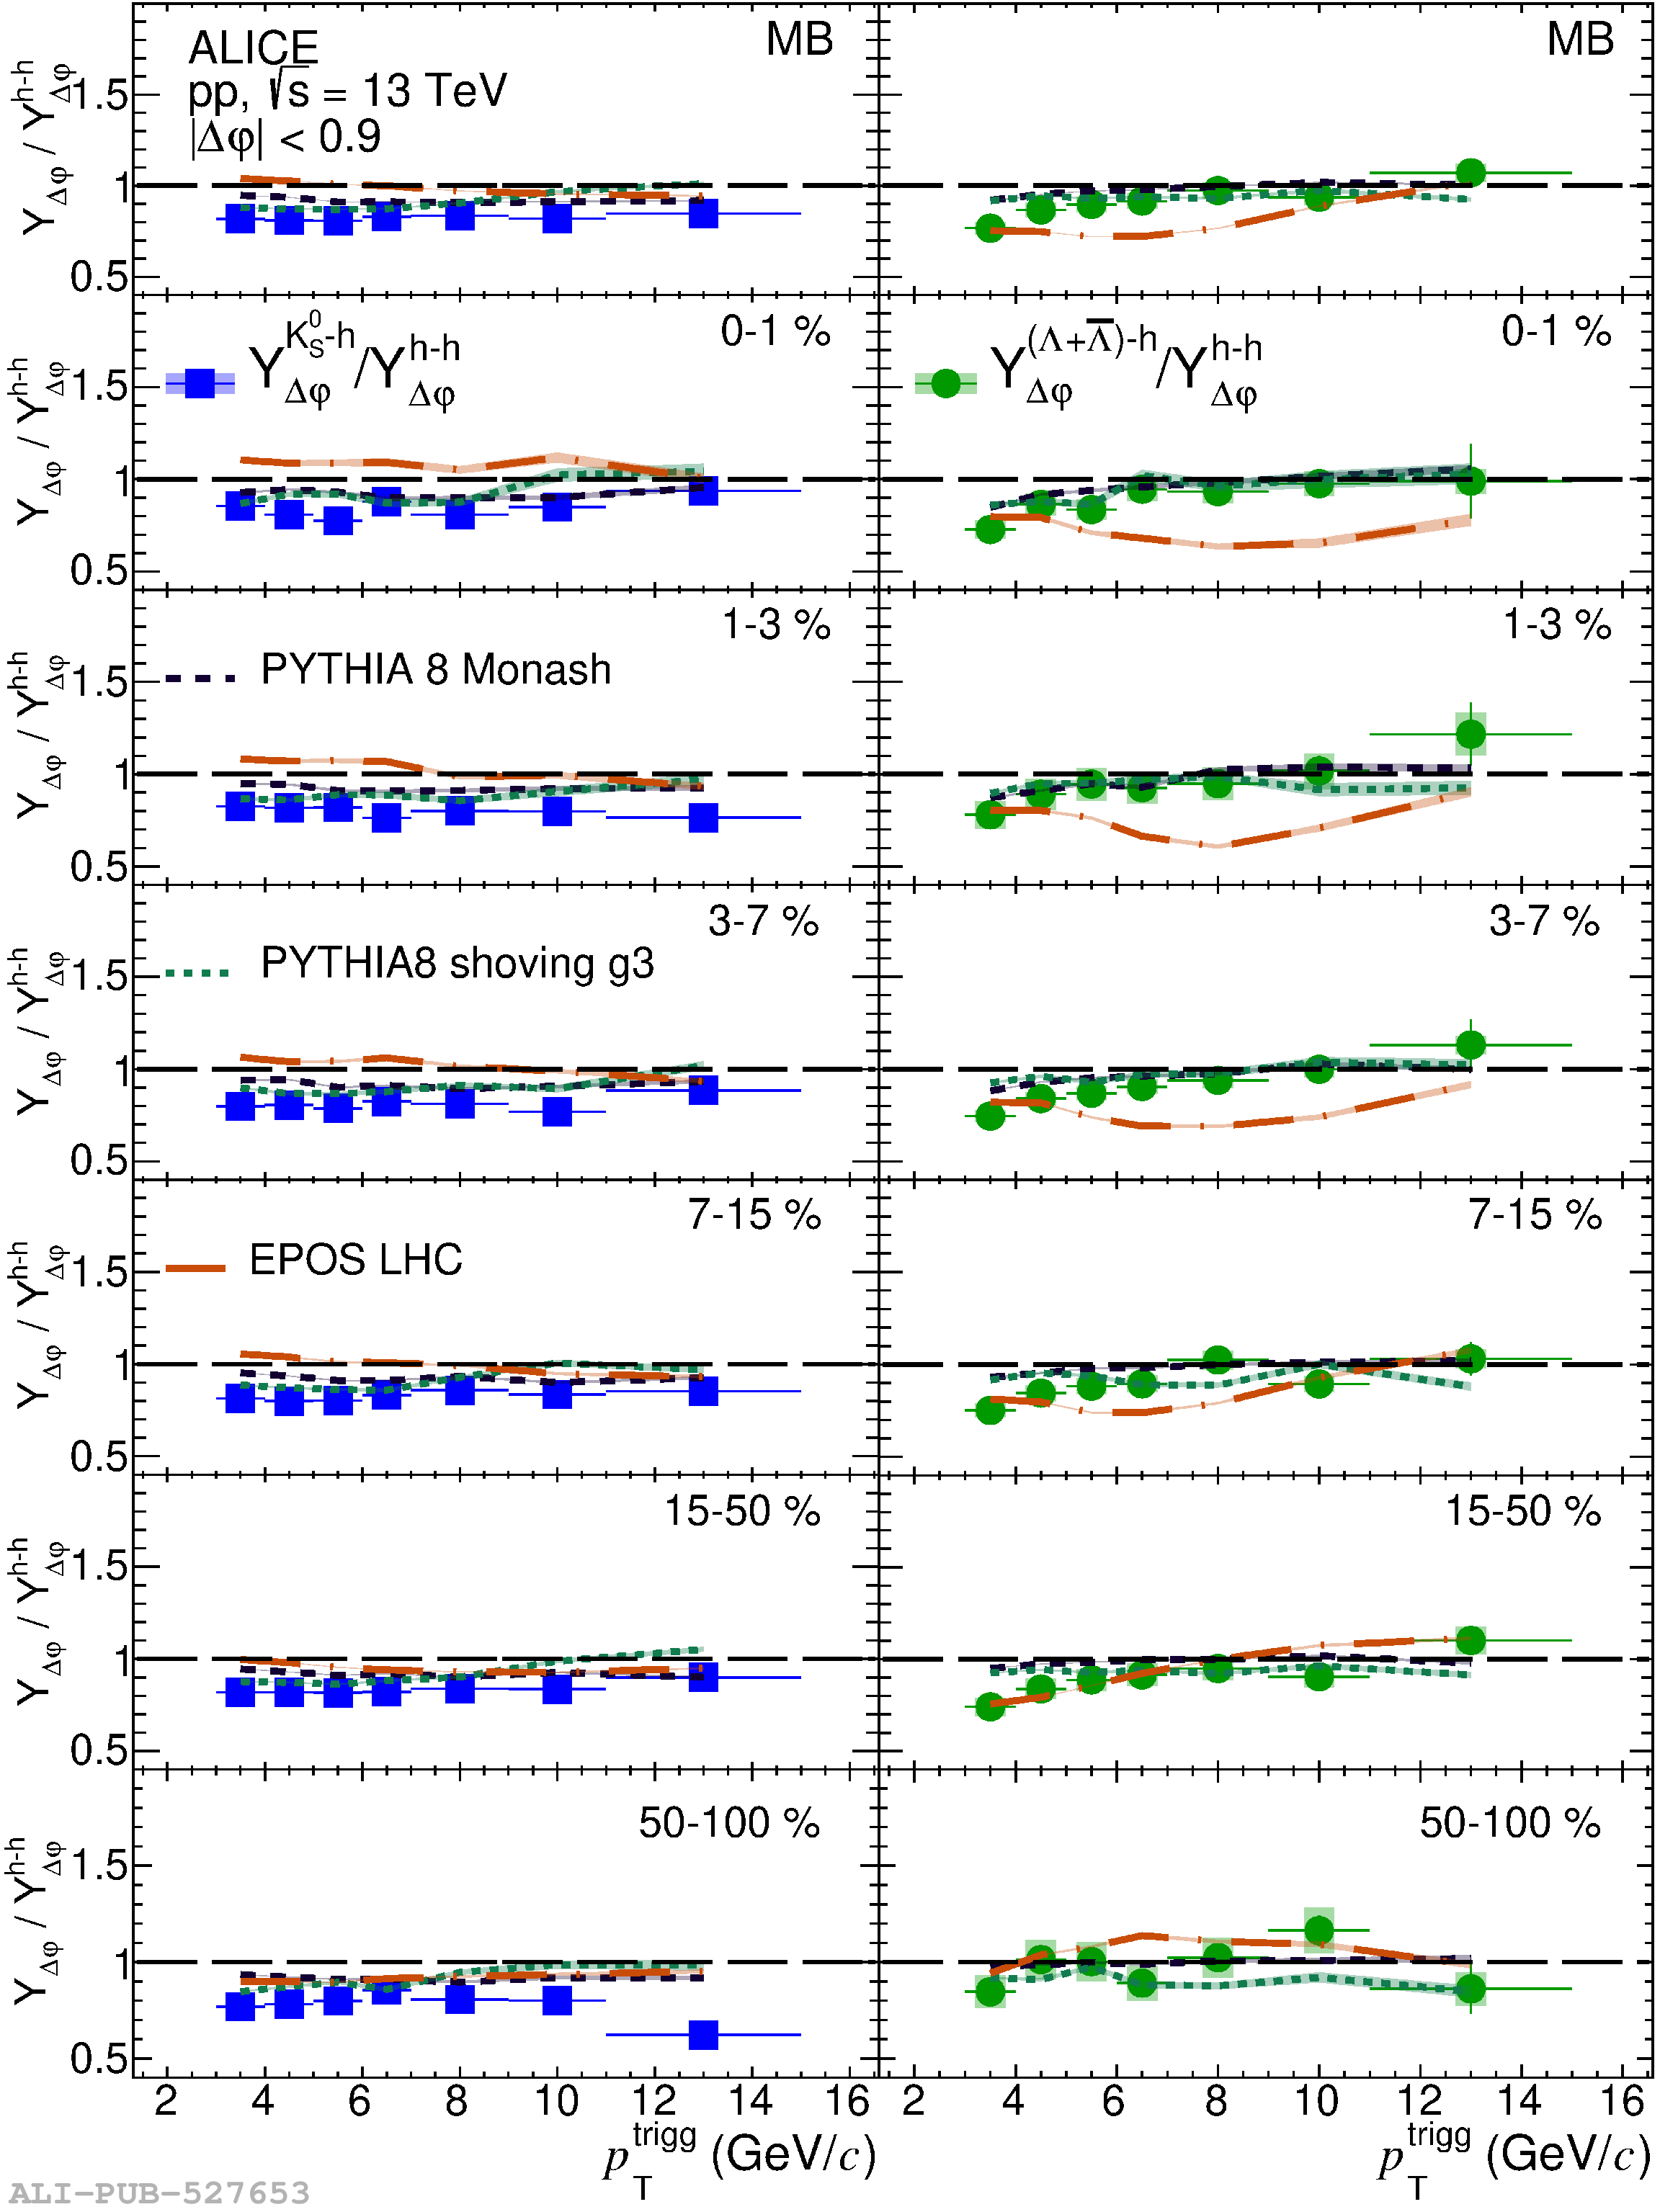 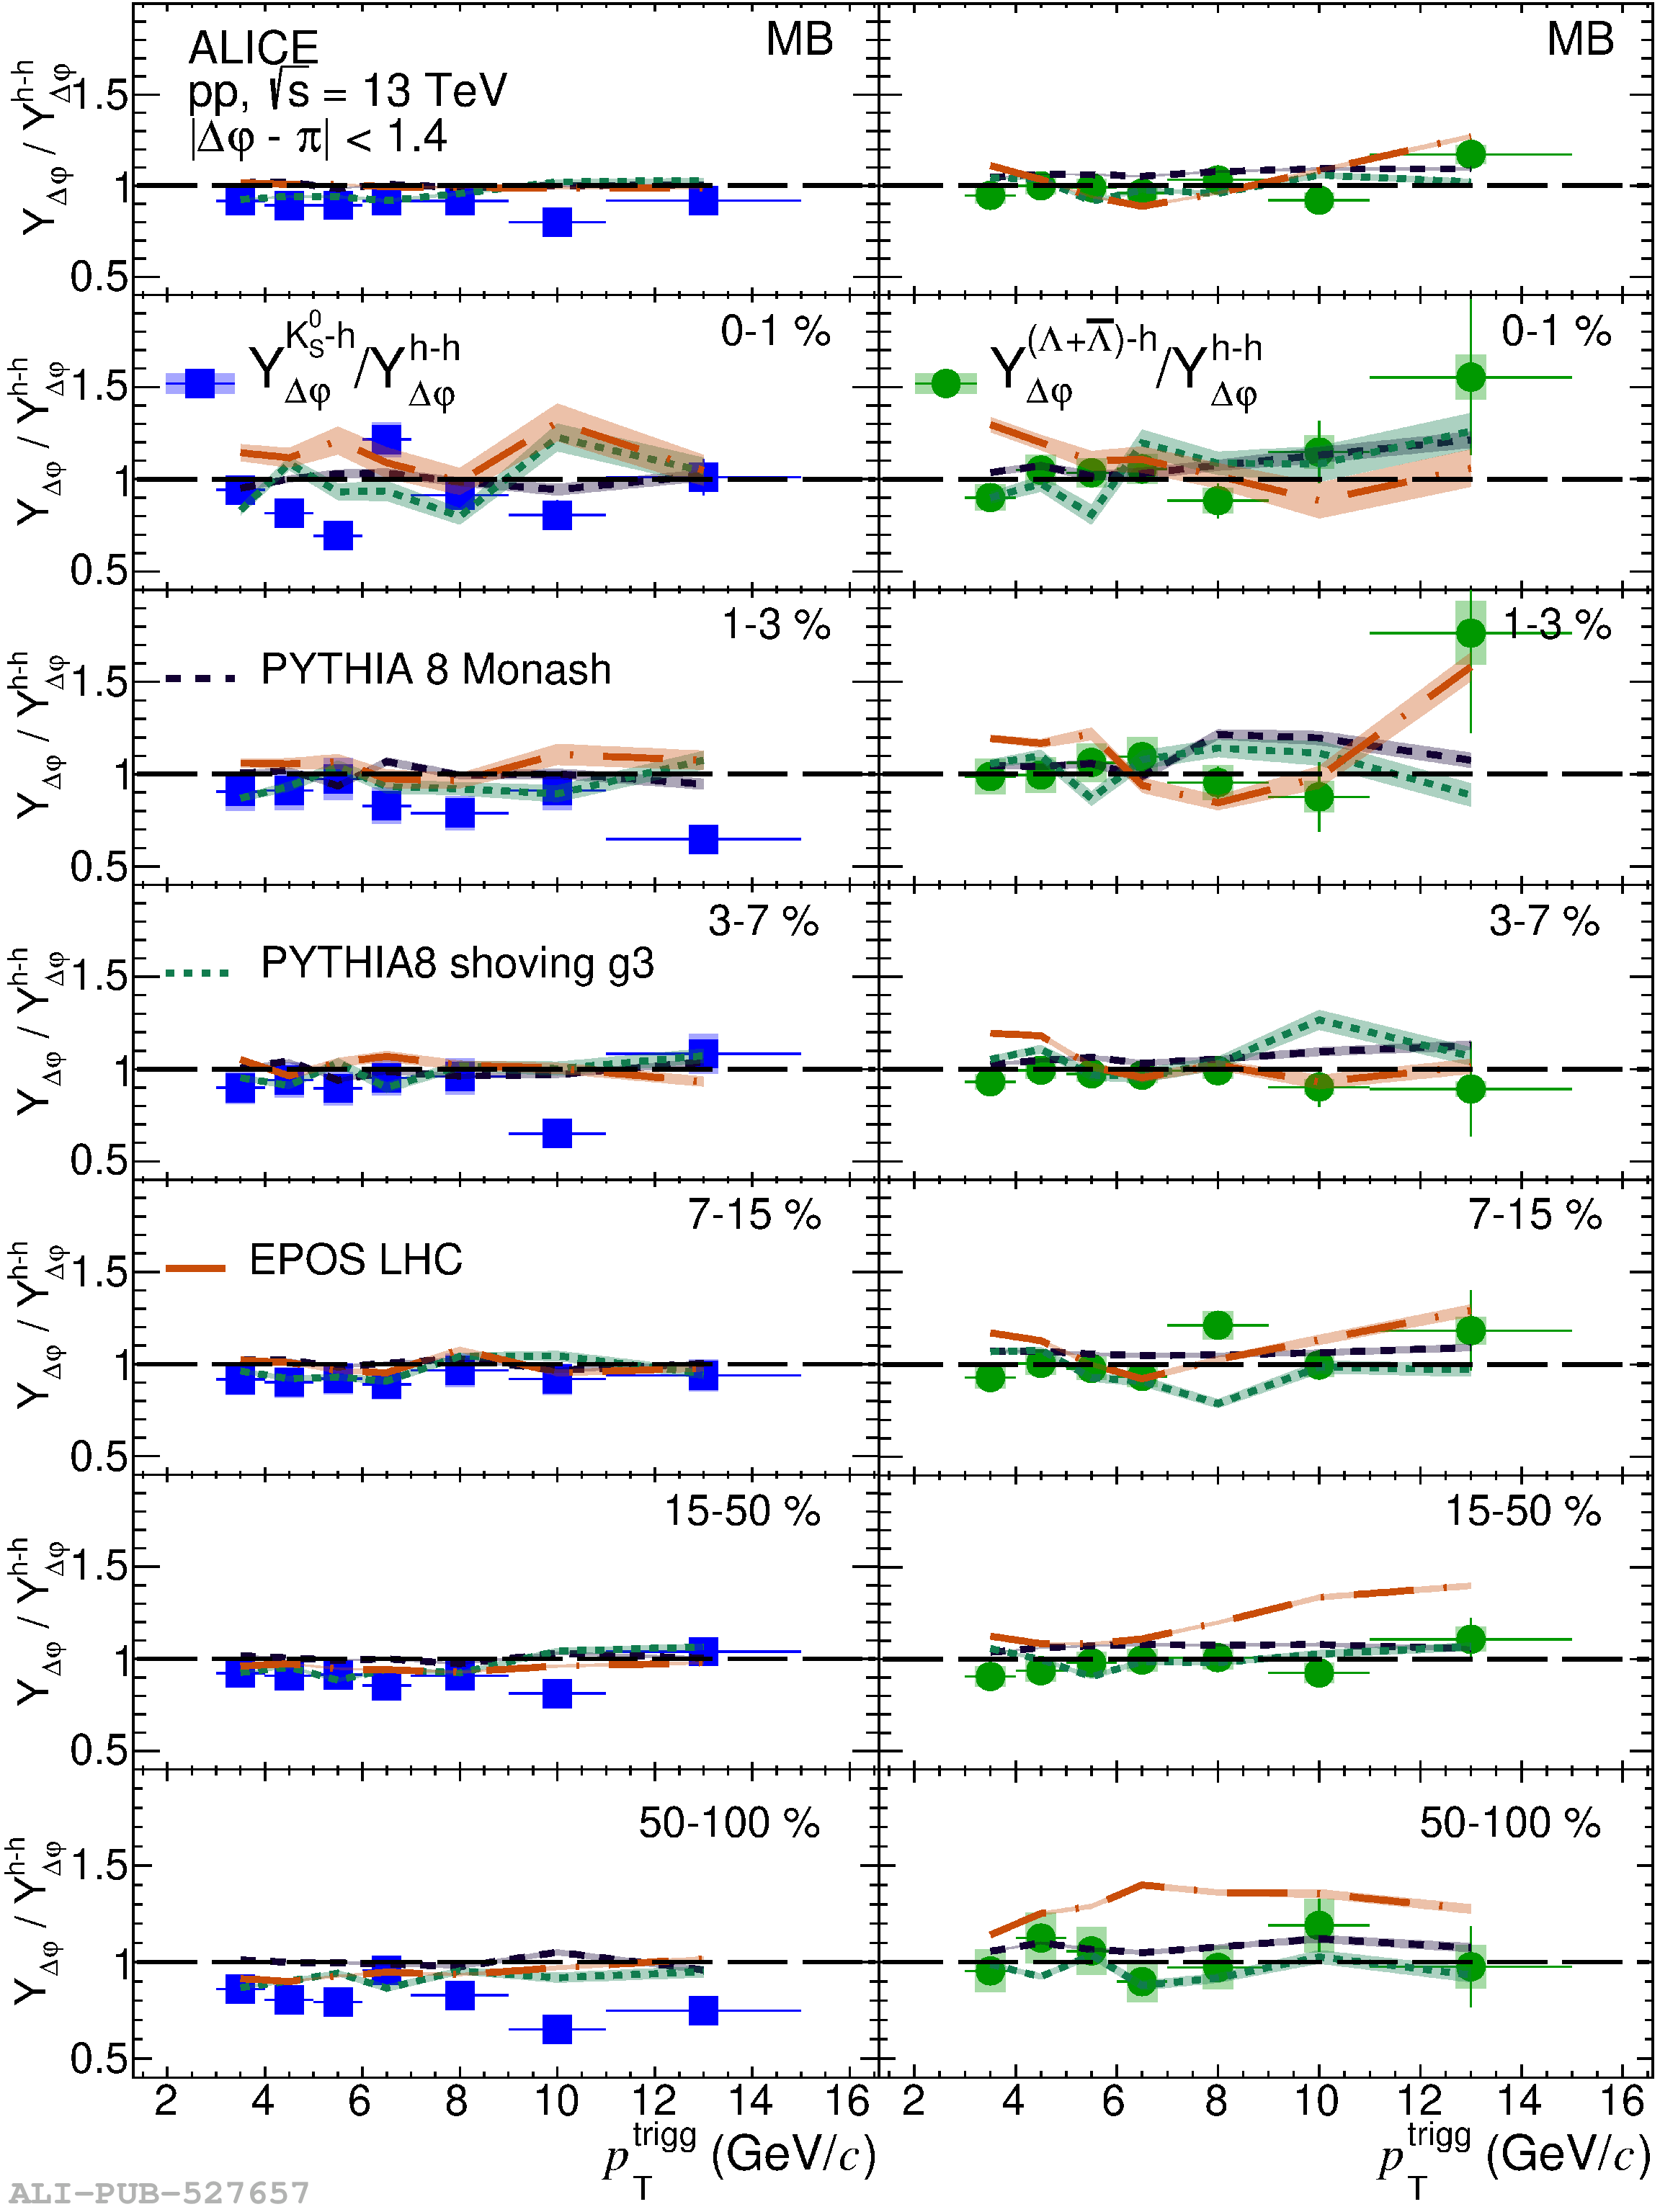 |