Models to data ratio of integrated per-trigger yields for minimum bias collisions as a function of \ptassoc for different \pttrig intervals on the near-side (top panels) and away-side (bottom panels) for three MC models: PYTHIA8 Monash with colour re-connection (left), PYTHIA8 with shoving (middle) and EPOS LHC (right). Note that for plotting purpose, the arbitrary shifts for the vertical axis are given in the legend. The bands represent combined systematical and statistical uncertainties for data and statistical for models. | 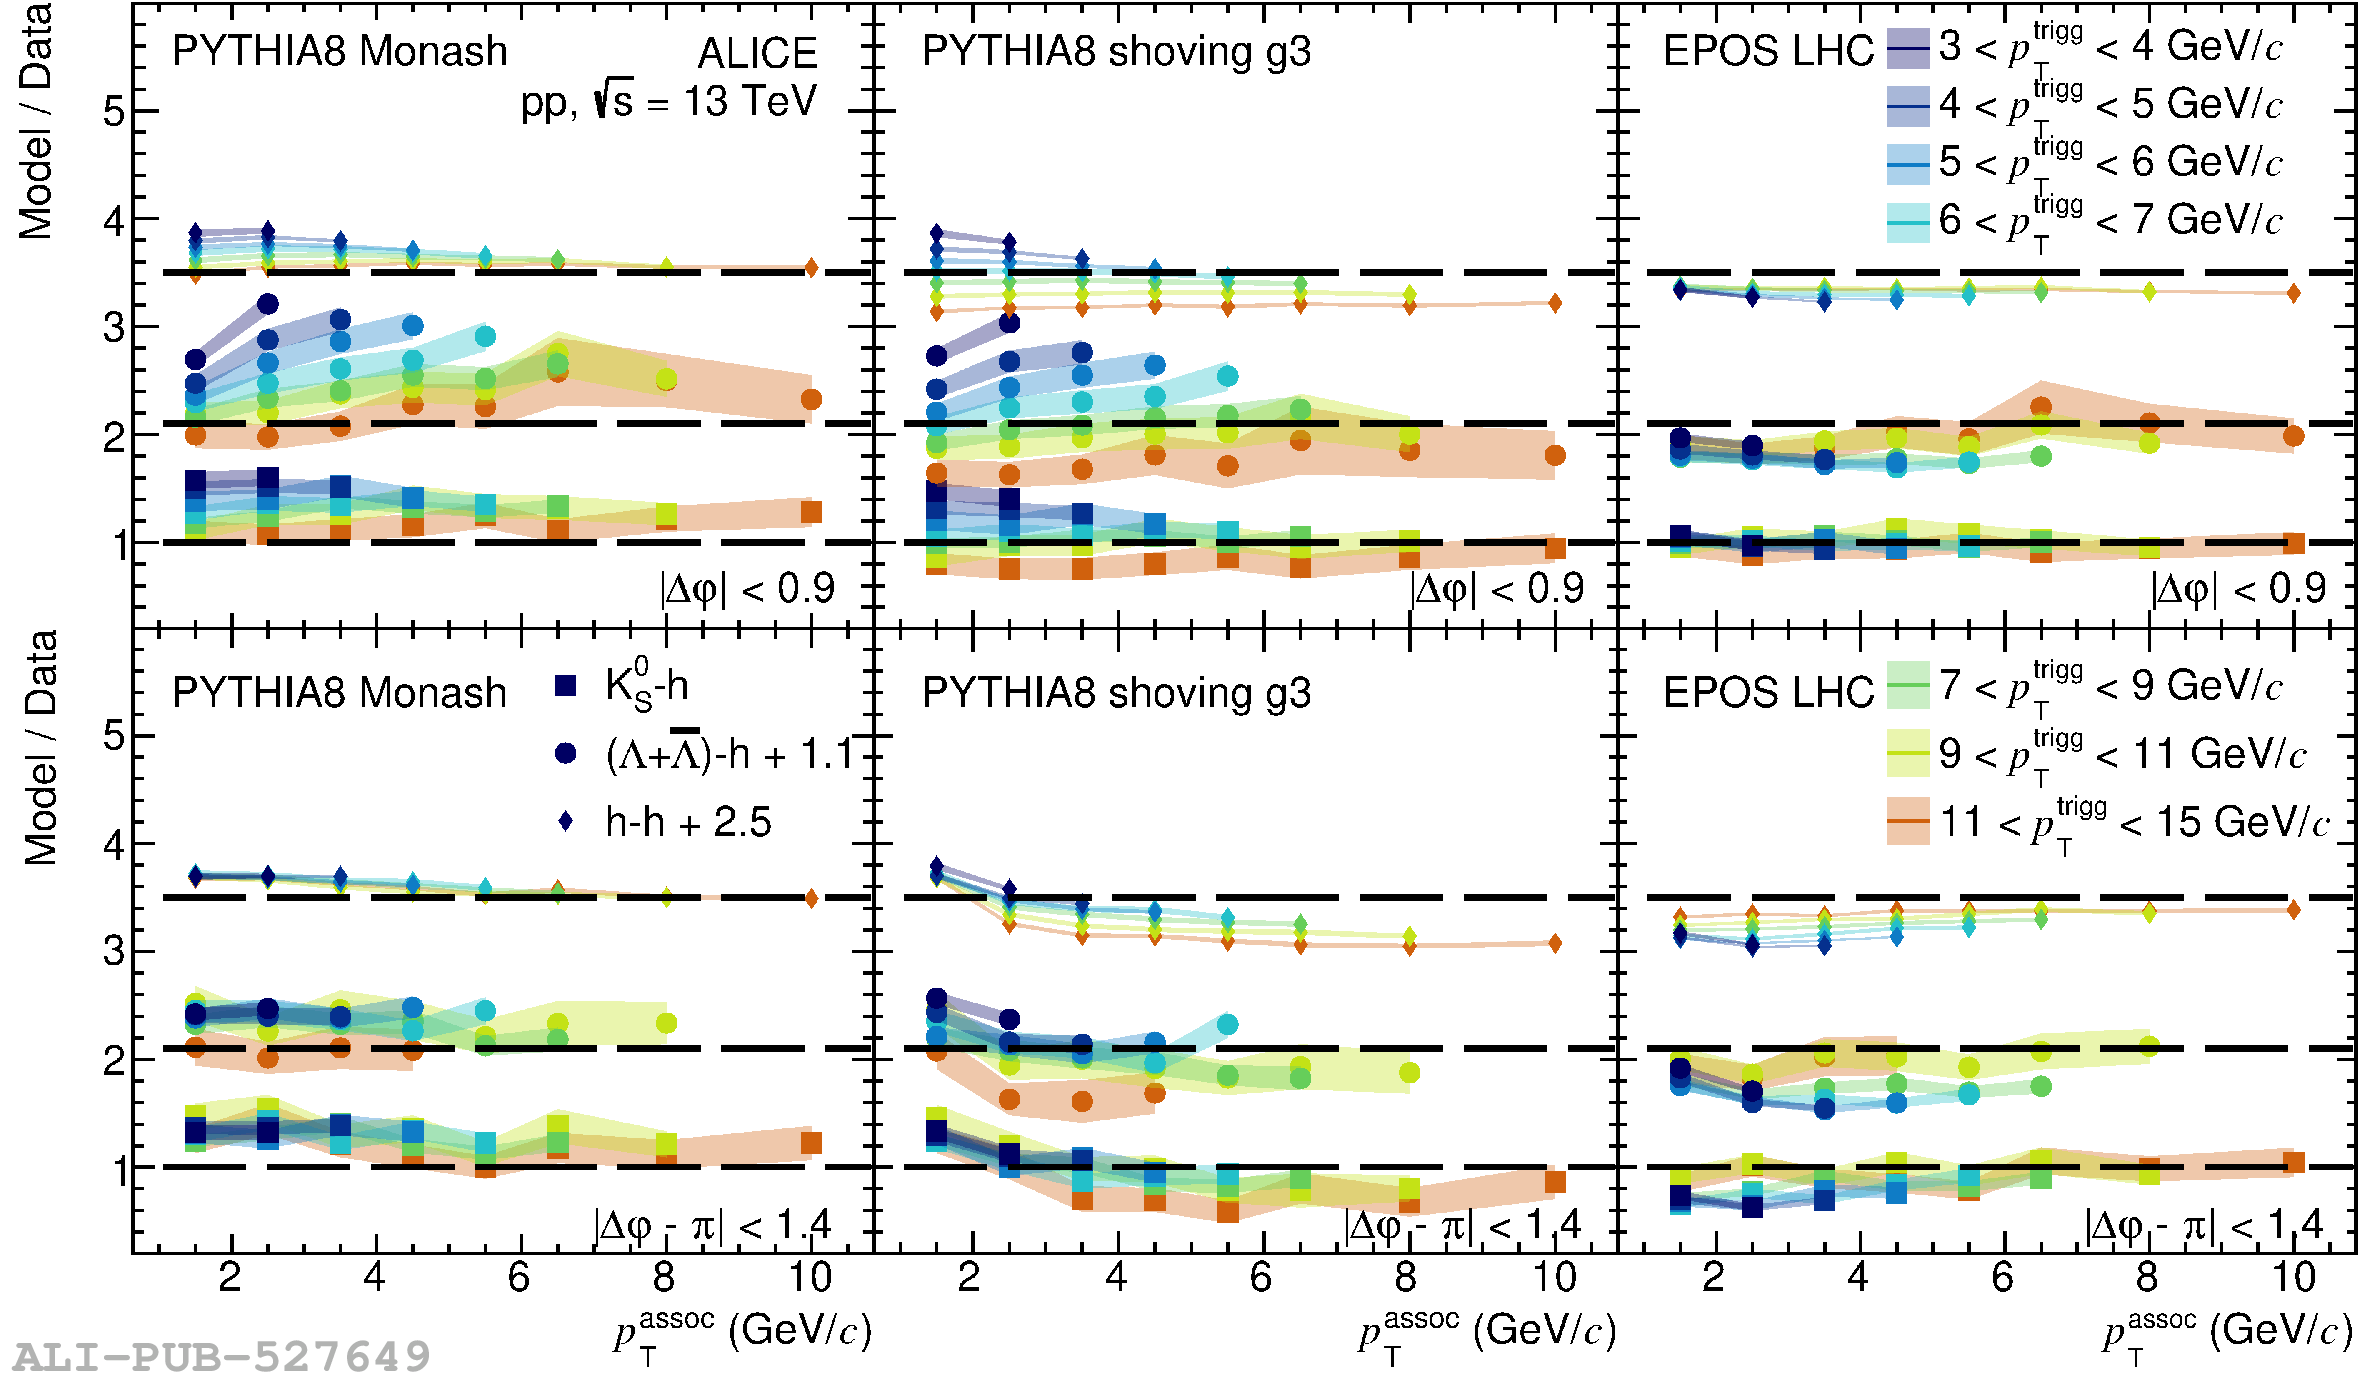 |