Per-trigger yields of h-h (left), \K-h (middle) and \lam-h (right) correlation functions as a function of \pttrig on the near-side (upper row) and away-side (lower row) for different multiplicity classes. For visibility, the values in the various event classes are scaled with the factors indicated in the legend. Error bars and colored boxes representstatistical and systematic uncertainties, respectively, which are in most cases within the data points. | 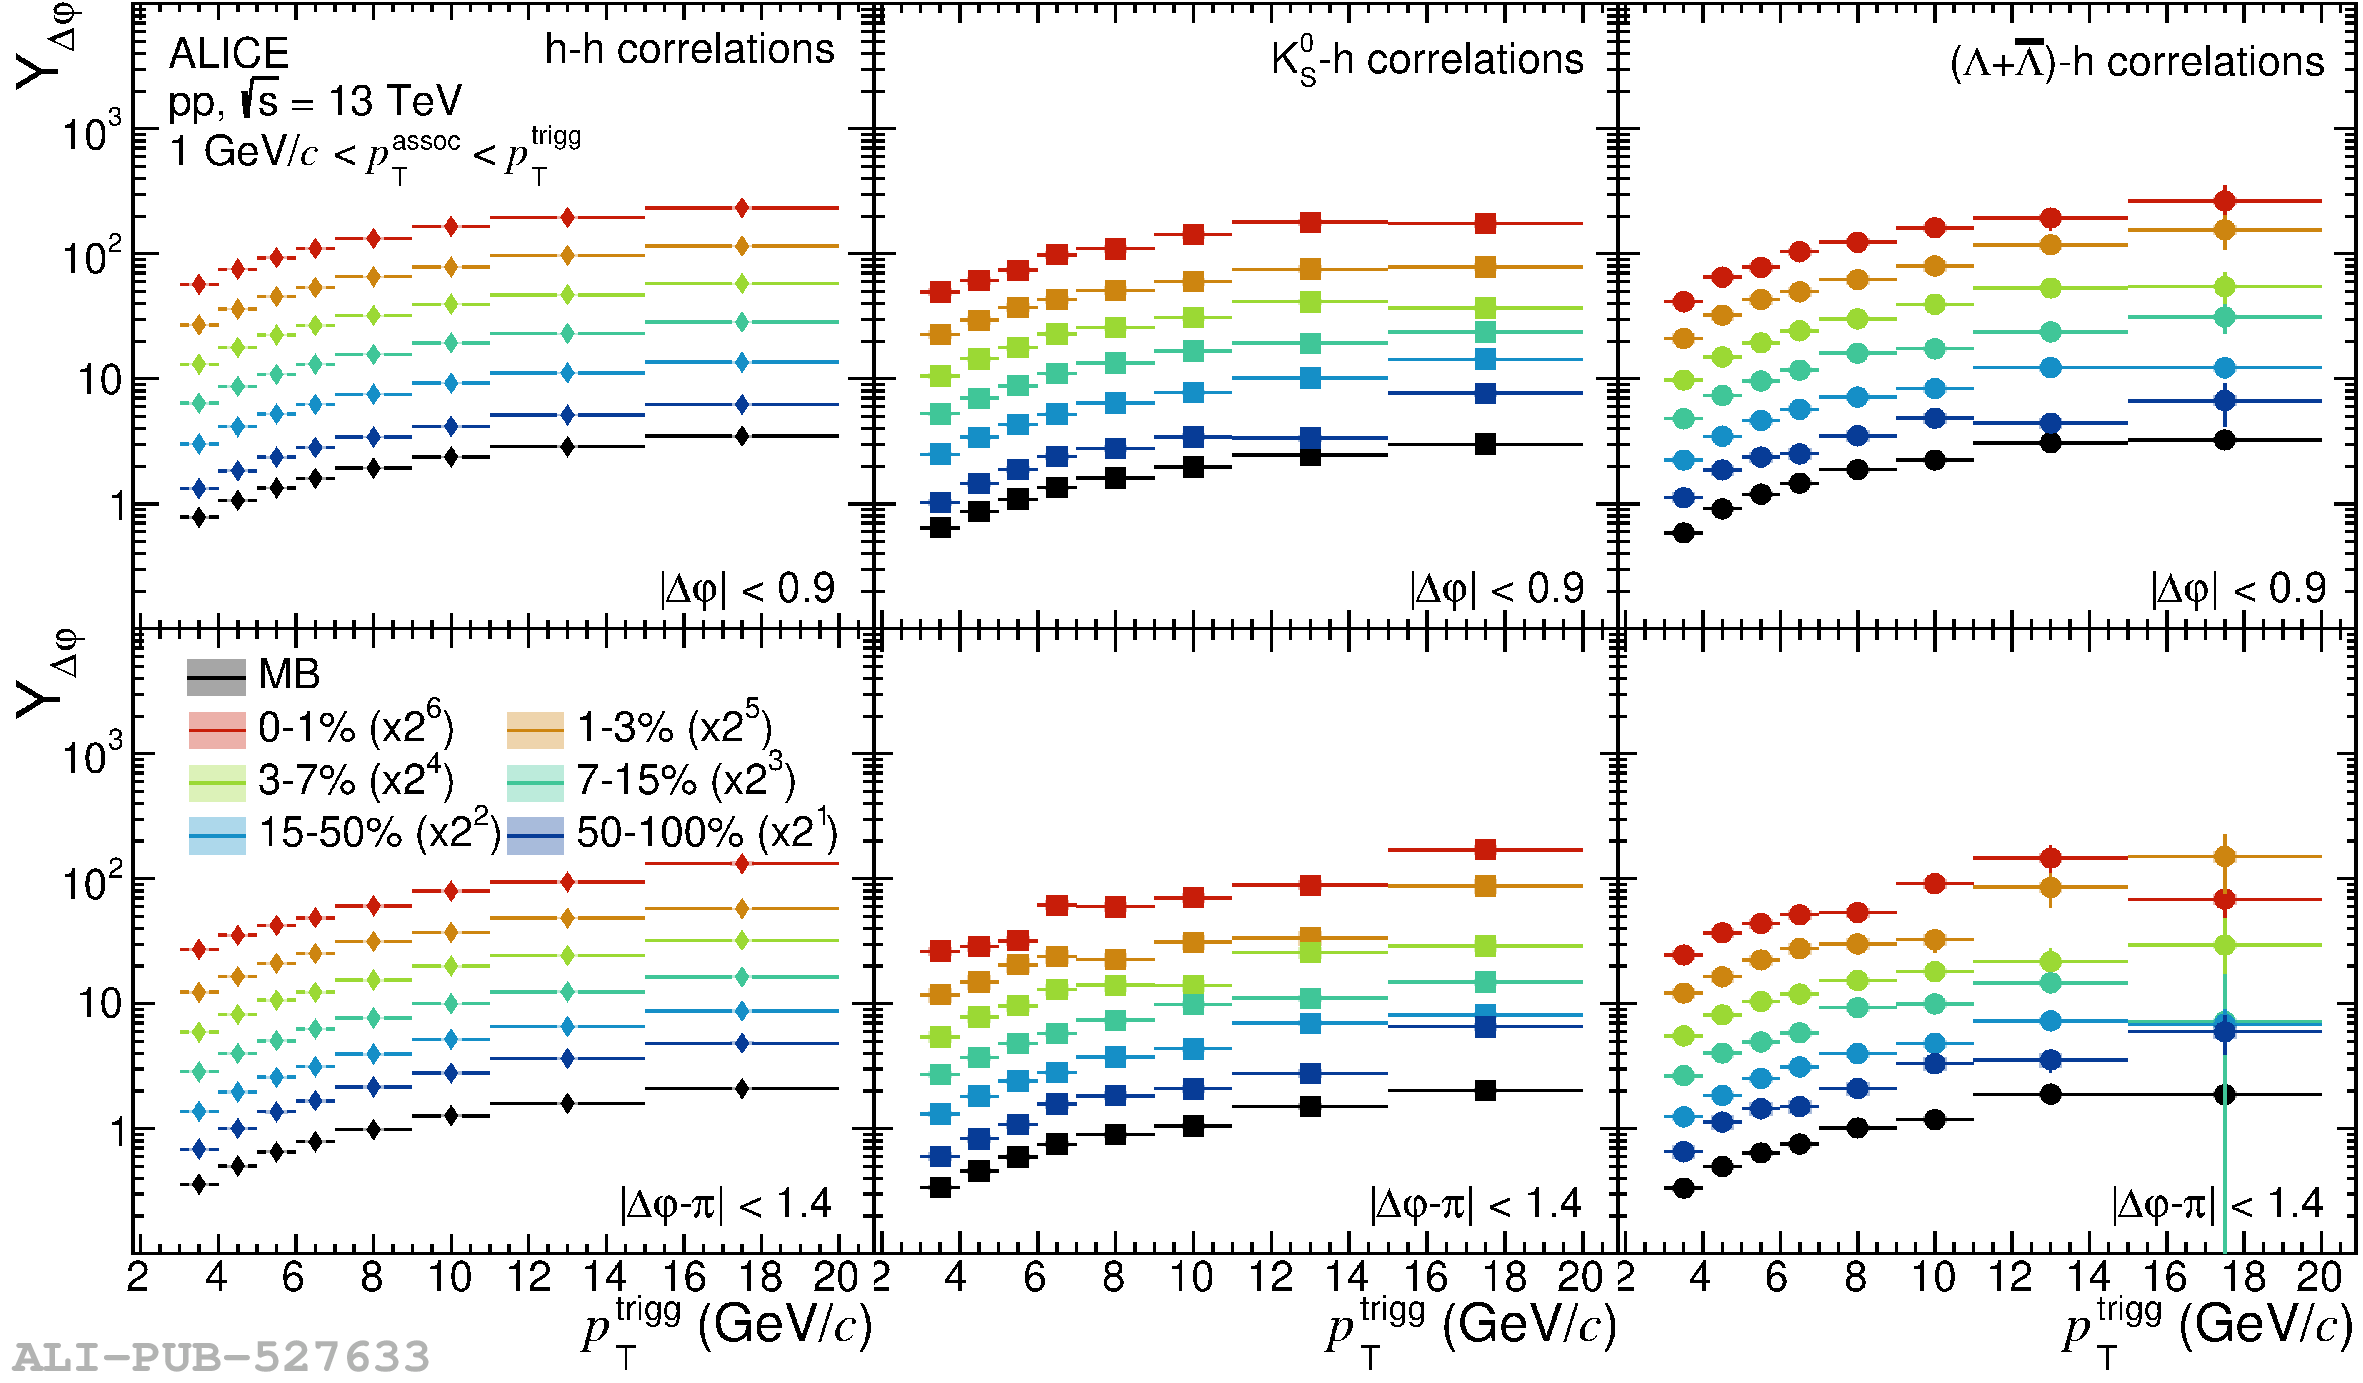 |