The per-trigger associated-deuteron integrated yield for trigger particles above $5$ GeV/$c$ on the near side versus \pt\ of the associated deuterons and anti-deuterons Vertical bars show statistical uncertainties, open boxes systematic uncertainties, and shaded (blue) boxes show the uncertainty related to the subtraction of the uncorrelated background using the ZYAM method Square markers are calculations using PYTHIA 8.2 (Monash) with a coalescence afterburner, displaced by 30 MeV/$c$ for better visibility.. | 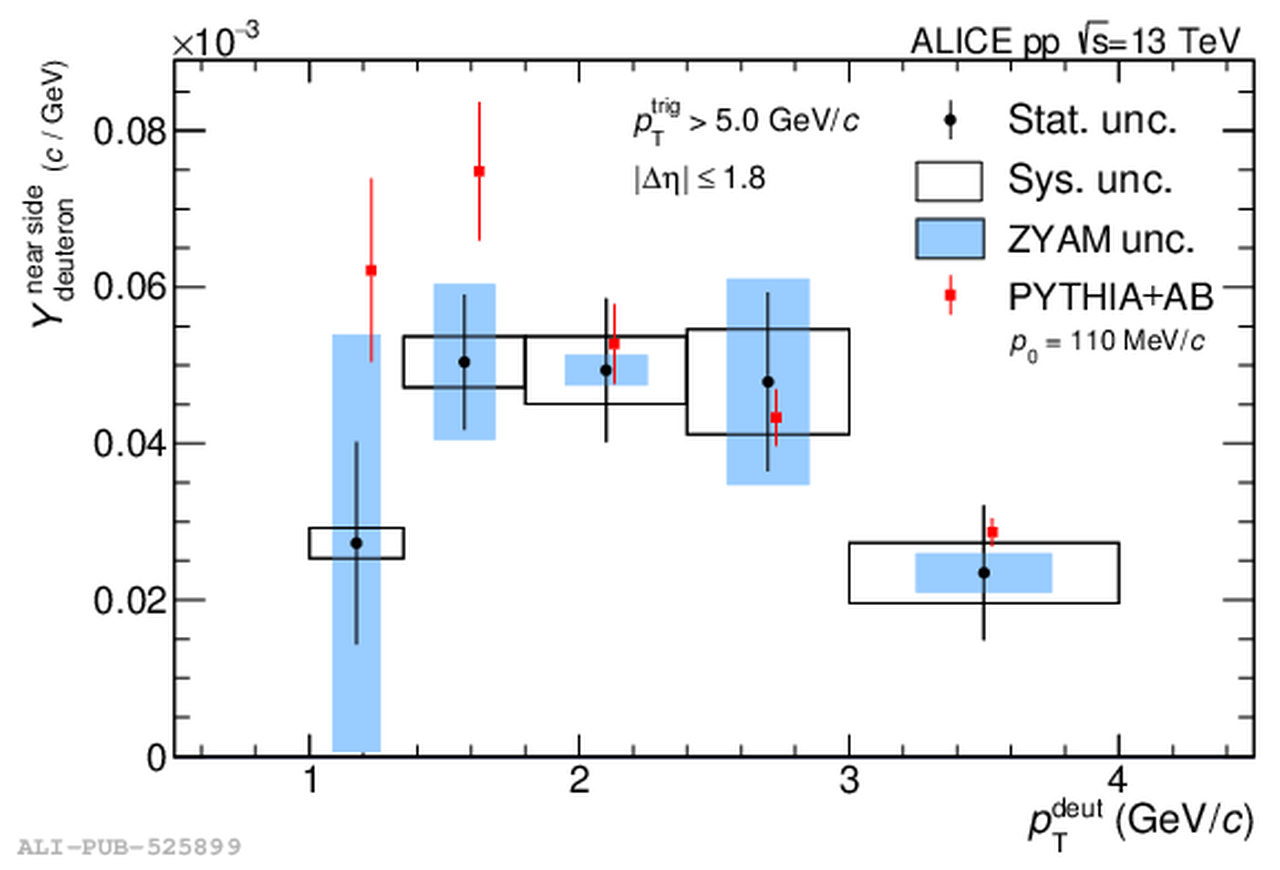 |