Purity of the b-jet candidates selected with the SV method when using the default tagging selection criteria. The purity was estimated with the data-driven template fit method (red points) and with the POWHEG-simulation based approach. The POWHEG scale variations accepted by the statistical analysis are colored green, the rejected ones are gray. Results for \pp and \pPb are shown in the left and right panel, respectively. | 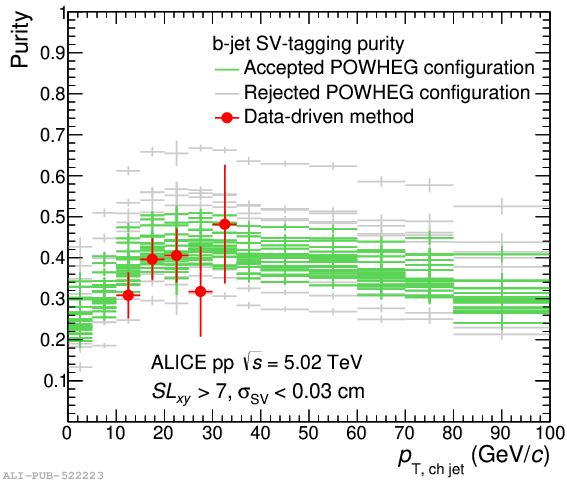 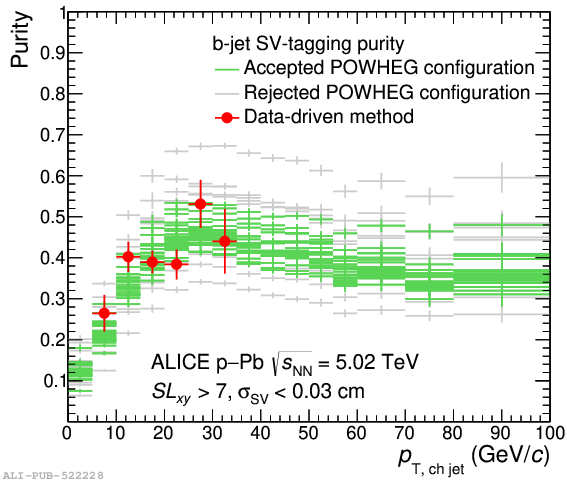 |