Correlation between the sum and difference of arrival times (relative to the bunch crossing) on the two V0 arrays. The top plot was obtained at zero beam separation; the bottom plot was obtained at a beam separation of 0.12 mm, roughly corresponding to five times the RMS of the beam profile. Events lying inside the area within the continuous lines are flagged as beam-beam interactions. | 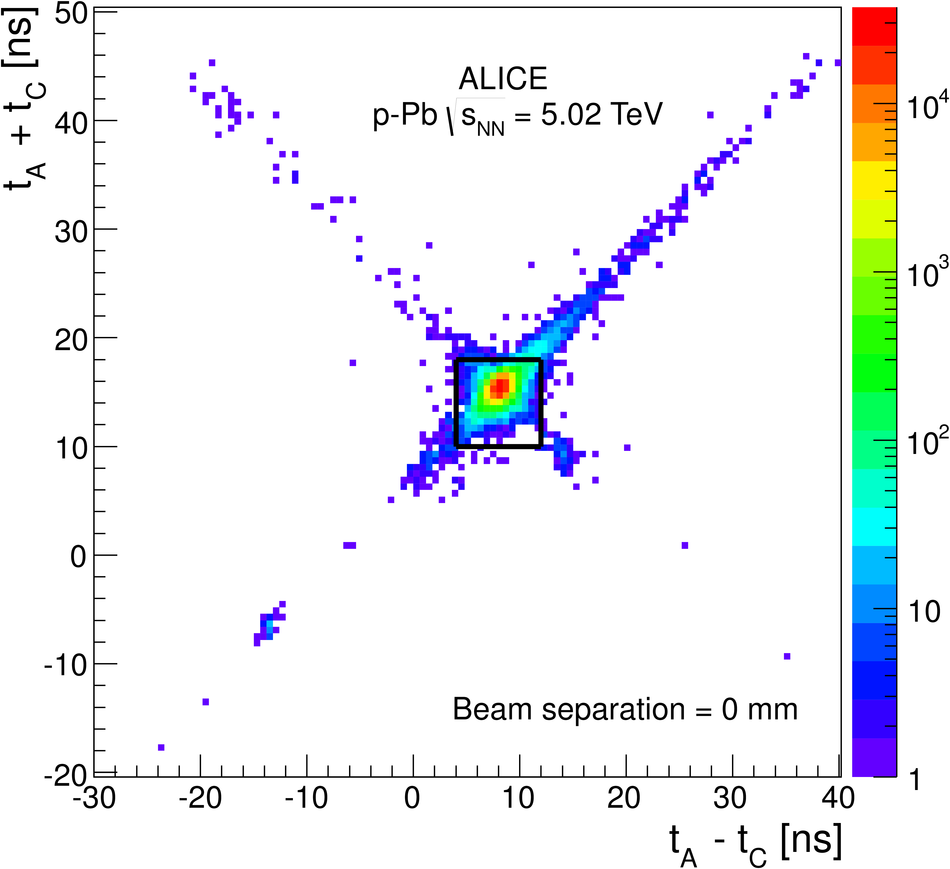 |
