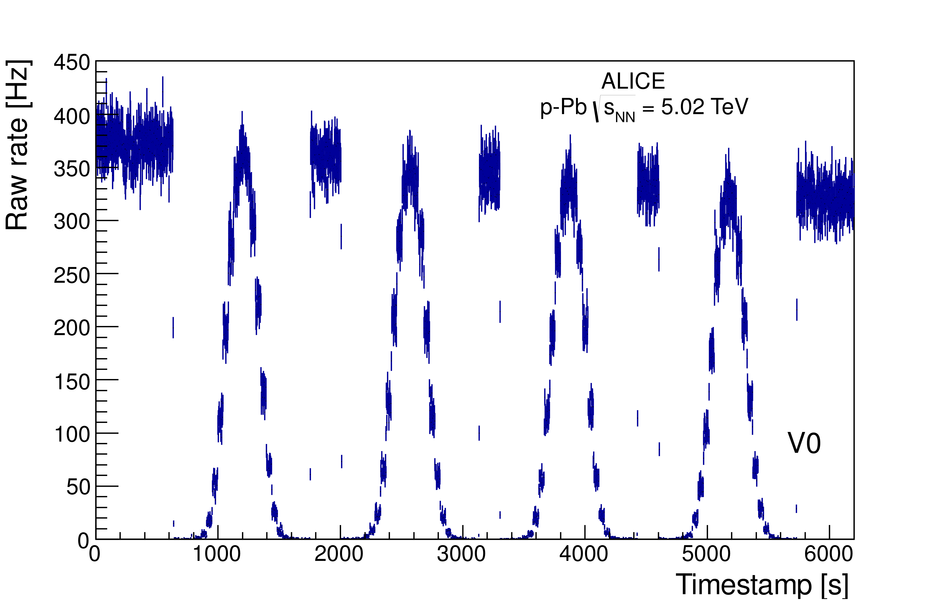
Raw rate of the T0 (top) and V0 (bottom) process for a typical colliding bunch pair, as a function of time, during the p-Pb scan session. In each plot, the first (second) bell-shaped structure corresponds to the beam separation in the horizontal (vertical) direction being varied from negative to positive values. The third (fourth) bell-shaped structure corresponds to the beam separation in the horizontal (vertical) direction being varied from positive to negative values. |  |