Differential $\phi$ meson production cross section $\mathrm{d}^2\sigma/\mathrm{d}y\mathrm{d}\pt$ as a function of rapidity at $\sqrt{s}=5.02$ TeV (left) and $\sqrt{s}=13$ TeV (right) in several $\pt$ intervals, compared with EPOS 3 , PHOJET and the Monash 2013 tune of PYTHIA 8.1 . The ratio of the data to the lowest $\pt$ interval is shown in the bottom panel The boxes represent the systematic uncertainties, the error bars the statistical uncertainties | 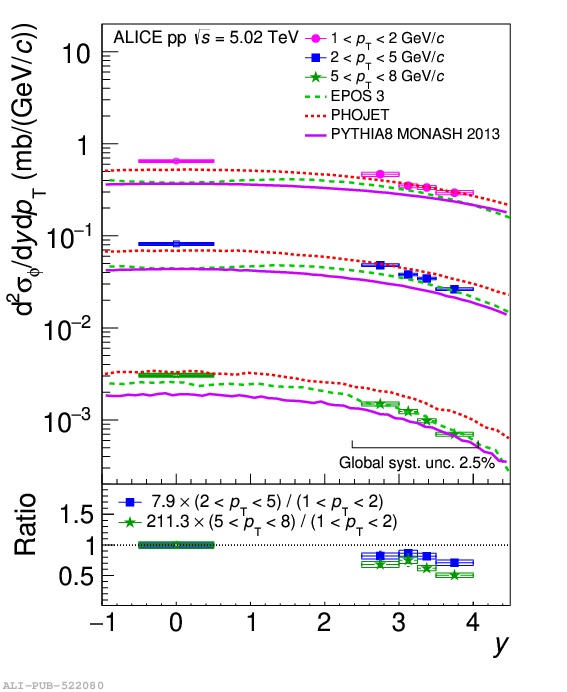 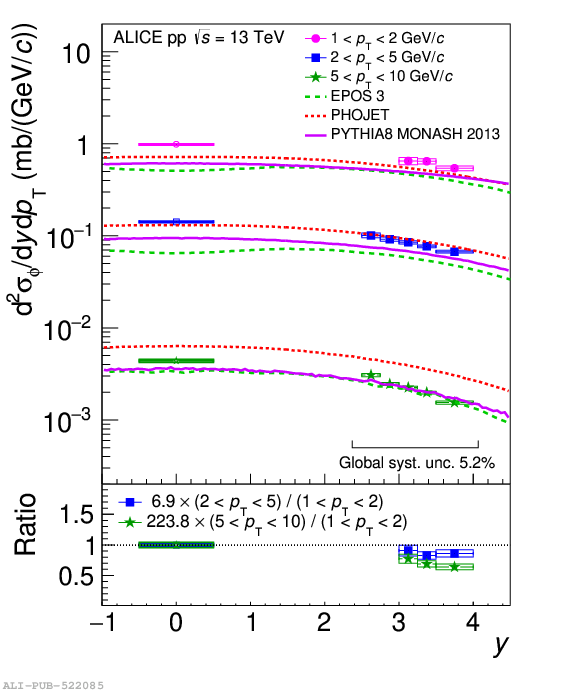 |