Measurements of azimuthal-correlation function baseline height in pp collisions at √s = 5.02 TeV, compared to predictions by the PYTHIA, POWHEG+PYTHIA6, POWHEG LO+PYTHIA6, HERWIG, and EPOS
3 event generators with various configurations in the top row (see text for details). The ratios of baselines with respect to predictions by POWHEG+PYTHIA6 are shown in the bottom row. Results are presented as a function of the D-meson pT, for passoc T > 0.3 GeV/c, 0.3 < passoc T < 1 GeV/c, 1 < passoc T < 2 GeV/c, and 2 < passoc T < 3 GeV/c (from left to right). Statistical and systematic uncertainties are shown as vertical error bars and boxes, respectively. | 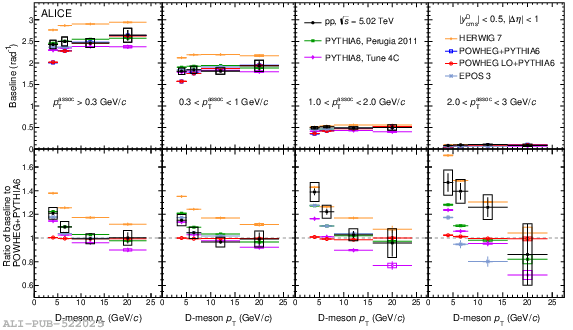 |