Near-side peak associated yields (top row) and widths (bottom row) in pp collisions at √s = 5.02 TeV and p–Pb collisions at √sNN = 5.02 TeV, as a function of the D-meson pT, for passocT > 0.3 GeV/c, 0.3 < passocT < 1 GeV/c, 1 < passocT < 2 GeV/c, and 2 < passocT < 3 GeV/c (from left to right). Statistical and systematic uncertainties are shown as vertical error bars and boxes, respectively. The points and error boxes for pp collisions are shifted by ∆pT = −0.2 GeV/c. | 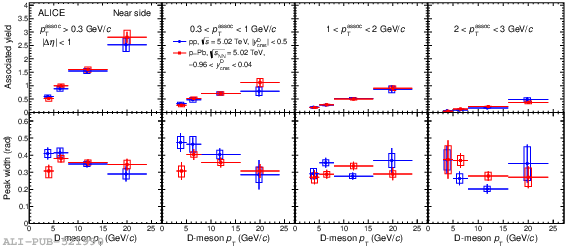 |