An excess of J/$\psi$ yield at very low transverse momentum ($p_{\rm T} <~ 0.3$ GeV/$c$), originating from coherent photoproduction, is observed in peripheral and semicentral hadronic Pb$-$Pb collisions at a center-of-mass energy per nucleon pair of $\sqrt{s_{\rm NN}} = 5.02$ TeV. The measurement is performed with the ALICE detector via the dimuon decay channel at forward rapidity ($2.5<~y<~4$). The nuclear modification factor at very low $p_{\rm T}$ and the coherent photoproduction cross section are measured as a function of centrality down to the 10% most central collisions. These results extend the previous study at $\sqrt{s_{\rm NN}} = 2.76$ TeV, confirming the clear excess over hadronic production in the $p_{\rm T}$ range 0$-$0.3 GeV/$c$ and the centrality range 70$-$90%, and establishing an excess with a significance greater than 5$\sigma$ also in the 50$-$70% and 30$-$50% centrality ranges. The results are compared with earlier measurements at $\sqrt{s_{\rm NN}} = 2.76$ TeV and with different theoretical predictions aiming at describing how coherent photoproduction occurs in hadronic interactions with nuclear overlap.
Phys. Lett. B 846 (2023) 137467
HEP Data
e-Print: arXiv:2204.10684 | PDF | inSPIRE
CERN-EP-2022-071
Figure group
Figure 1
J/$\psi$ nuclear modification factor as a function of $\langle N_{\rm part} \rangle$ measured in the rapidity range $2.5 < y < 4$ for three transverse momentum intervals. The vertical bars are the statistical uncertainties and the uncorrelated systematic uncertainties are represented as boxes. The centrality-correlated systematic uncertainties are shown as filled boxes at unity. Data are compared with predictions from Ref. [26], shown as bands. | 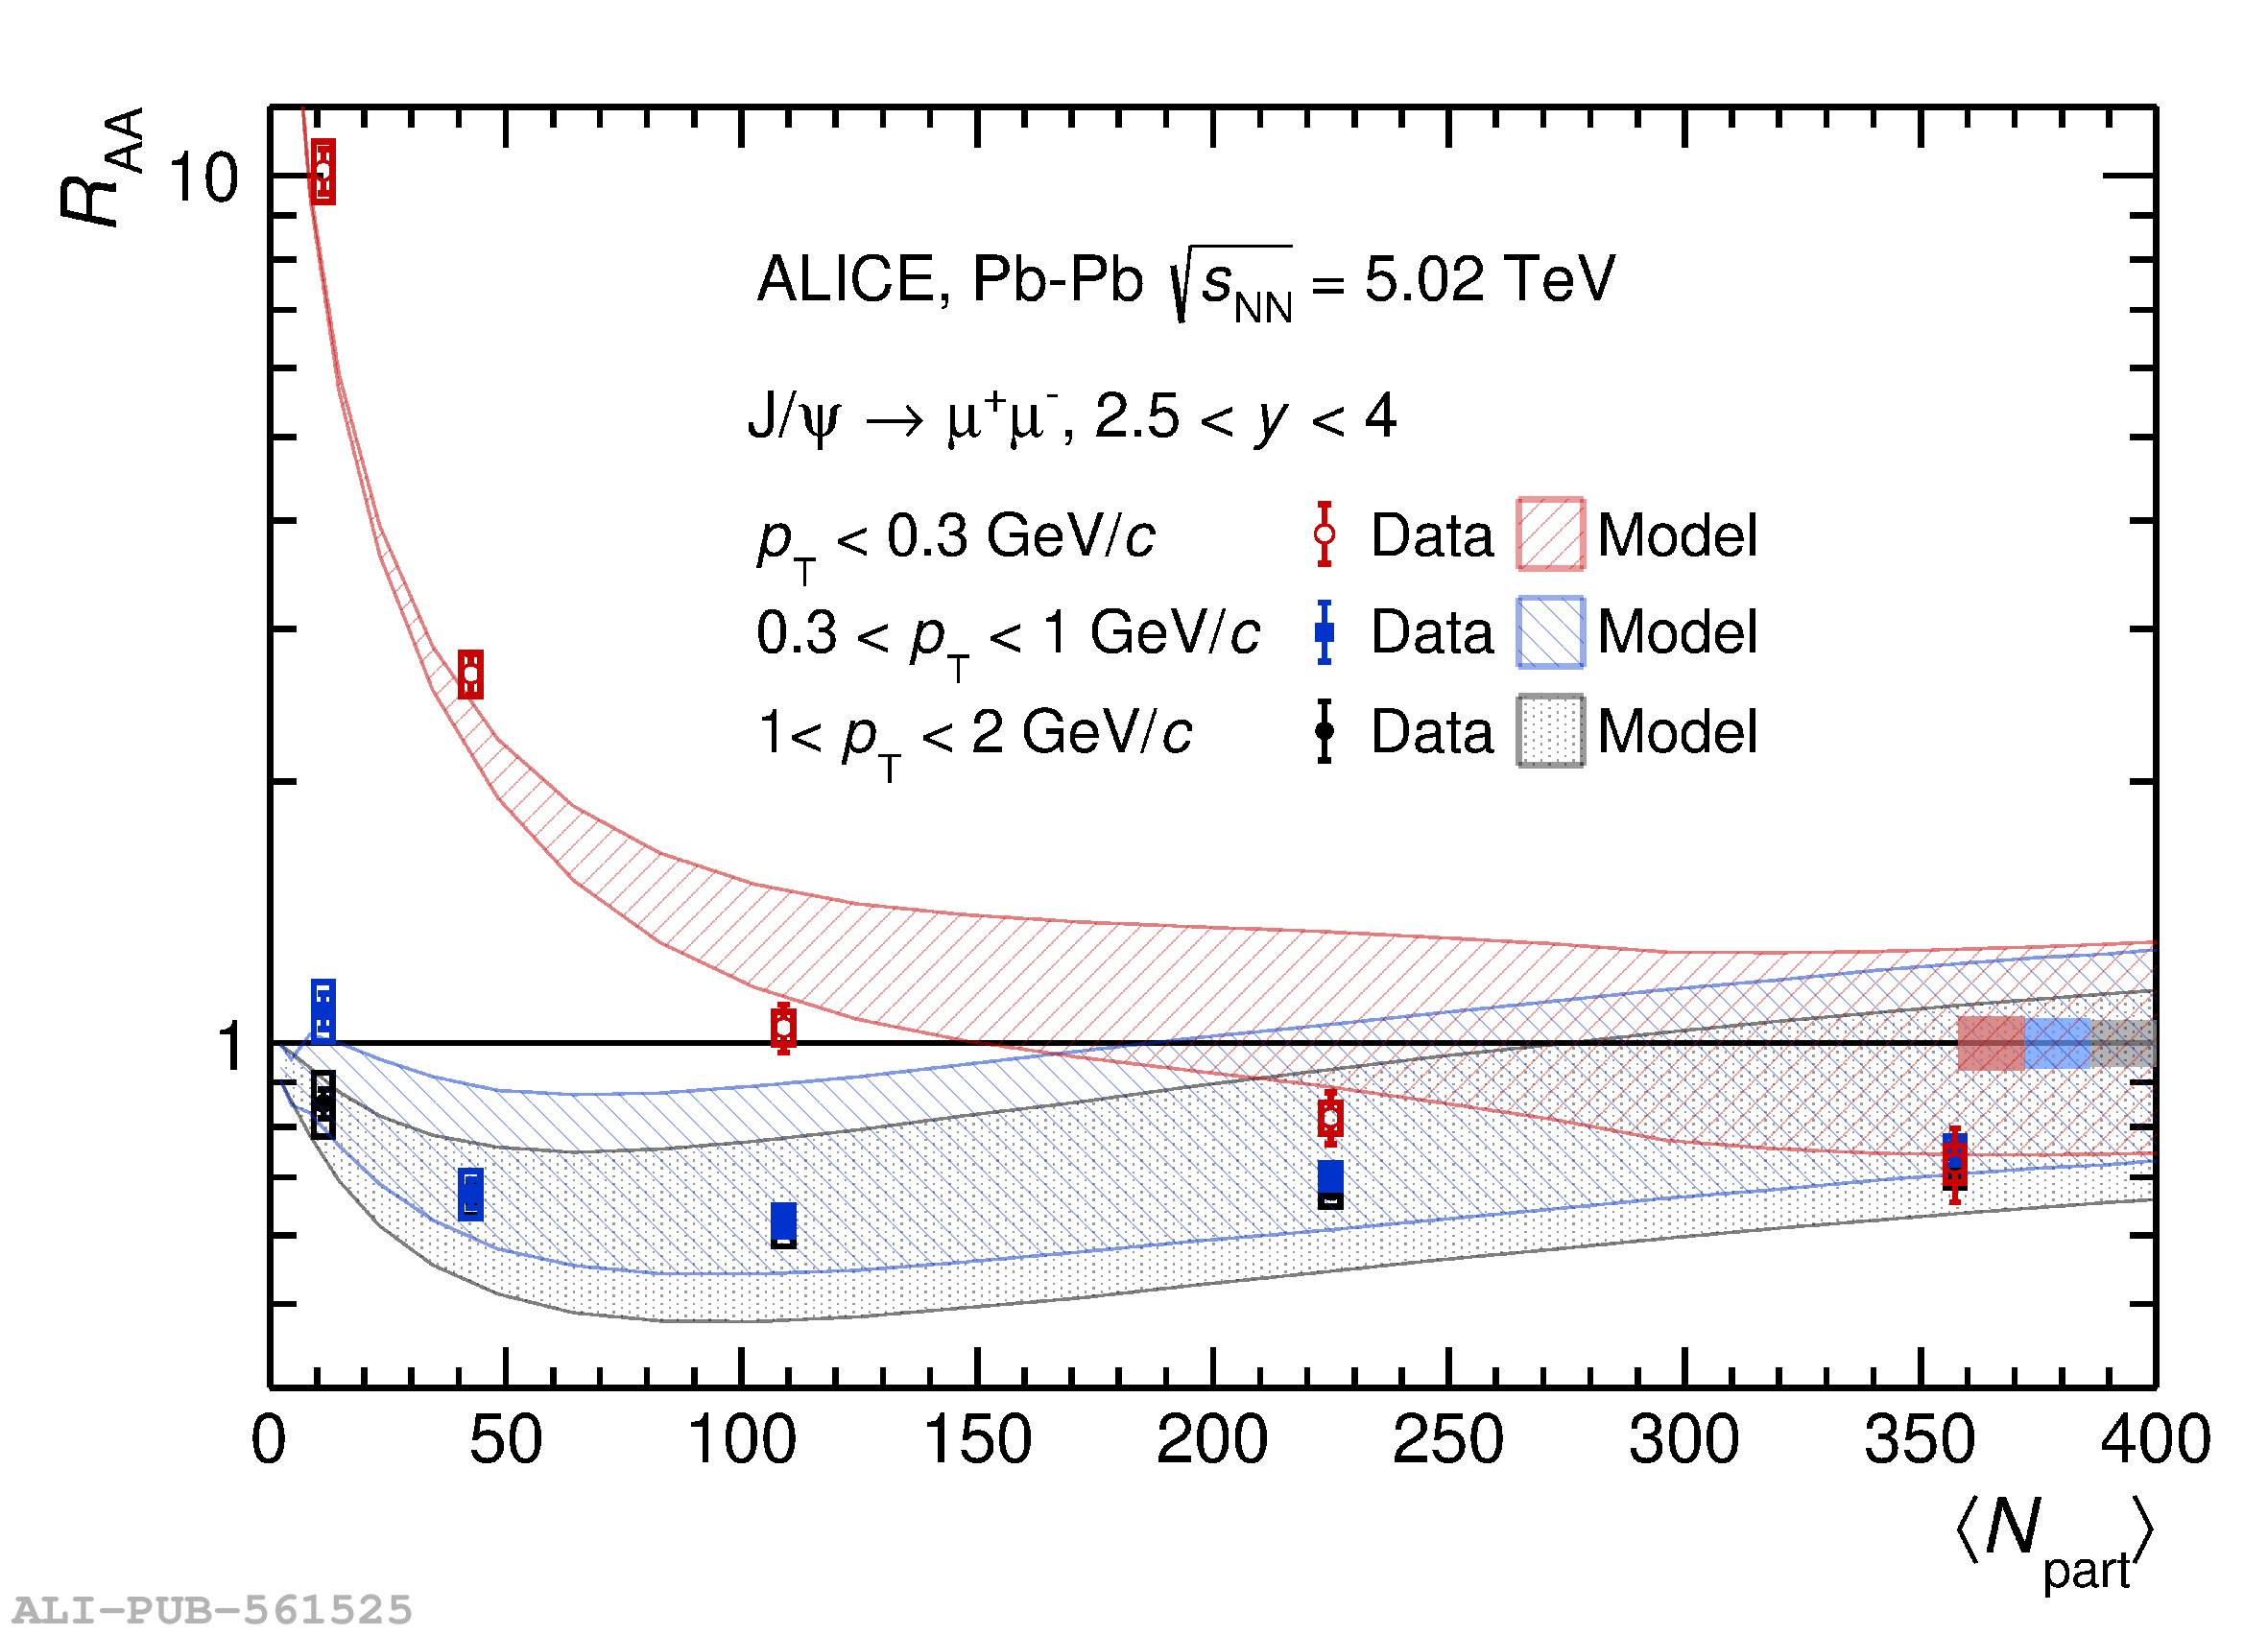 |
Figure 2
J/$\psi$ coherent photoproduction cross section as a function of $\langle N_{\rm part} \rangle$ at forward rapidity in Pb$-$Pb collisions at $\sqrt{s_{\rm NN}}$ = 5.02 TeV. The vertical bars are the statistical uncertainties and the uncorrelated systematic uncertainties are represented as boxes. The centrality correlated systematic uncertainties are quoted in the legend. Results are compared with theoretical calculations from Ref. [33] (GG-hs), Ref. [32] (IIM S2 and S3, and GBW S2 and S3) and from Ref. [35] with updated Glauber calculations from Ref. [56] (VDM). The figure shows the integral of the cross section measurement as well as the corresponding theoretical model values in each centrality interval. Note that the most central bin, where only an upper limit is given, is half the size of the other intervals. Therefore, to evaluate the centrality dependence of J/$\psi$ coherent photoproduction, both data and theory have to be multiplied by a factor of two. | 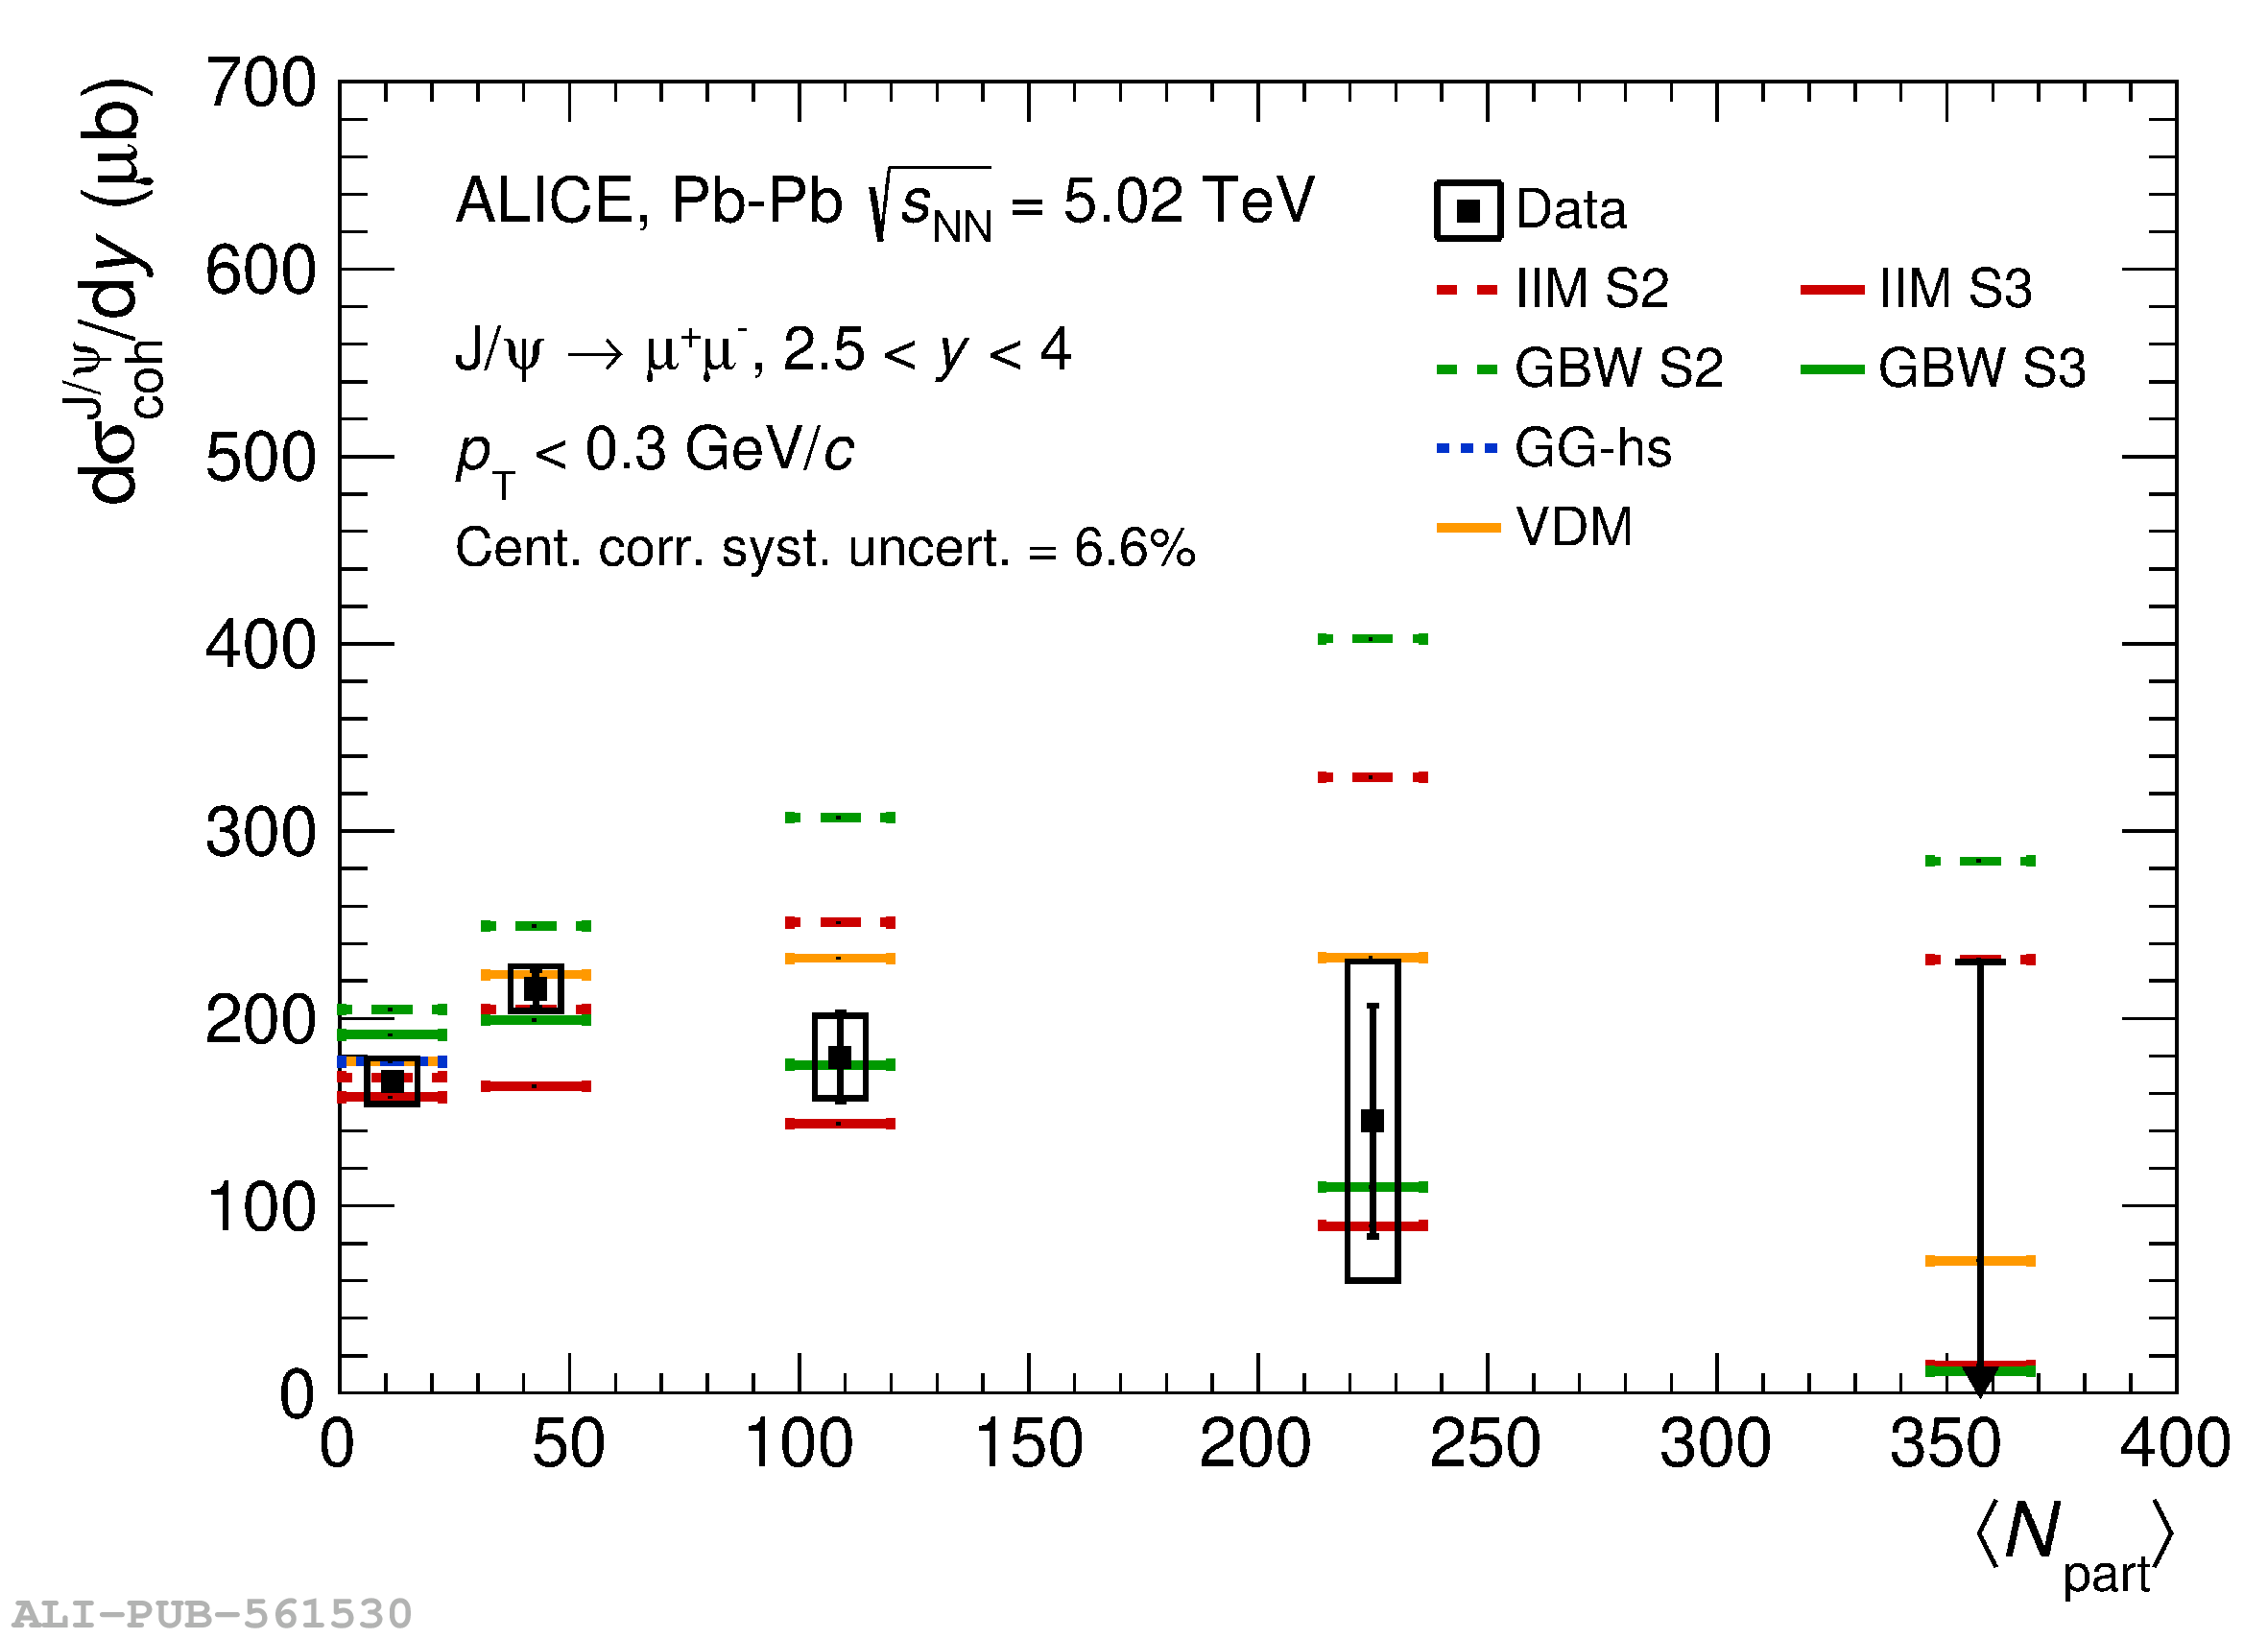 |
Figure 3
J/$\psi$ coherent photoproduction cross section ratio for two different energies ($\sqrt{s_{\rm NN}}$ = 5.02 TeV over $\sqrt{s_{\rm NN}}$ = 2.76 TeV) as a function of centrality. The data at $\sqrt{s_{\rm NN}}$ = 2.76 TeV are taken from Ref. [25]. The vertical lines are the statistical uncertainties while the open (filled) boxes are the centrality uncorrelated (correlated) systematic uncertainties. Results are compared with theoretical calculations from Ref. [33] (GG-hs), Ref. [32] (IIM and GBW) and from Ref. [35] with updated Glauber calculations from Ref. [56] (VDM). | 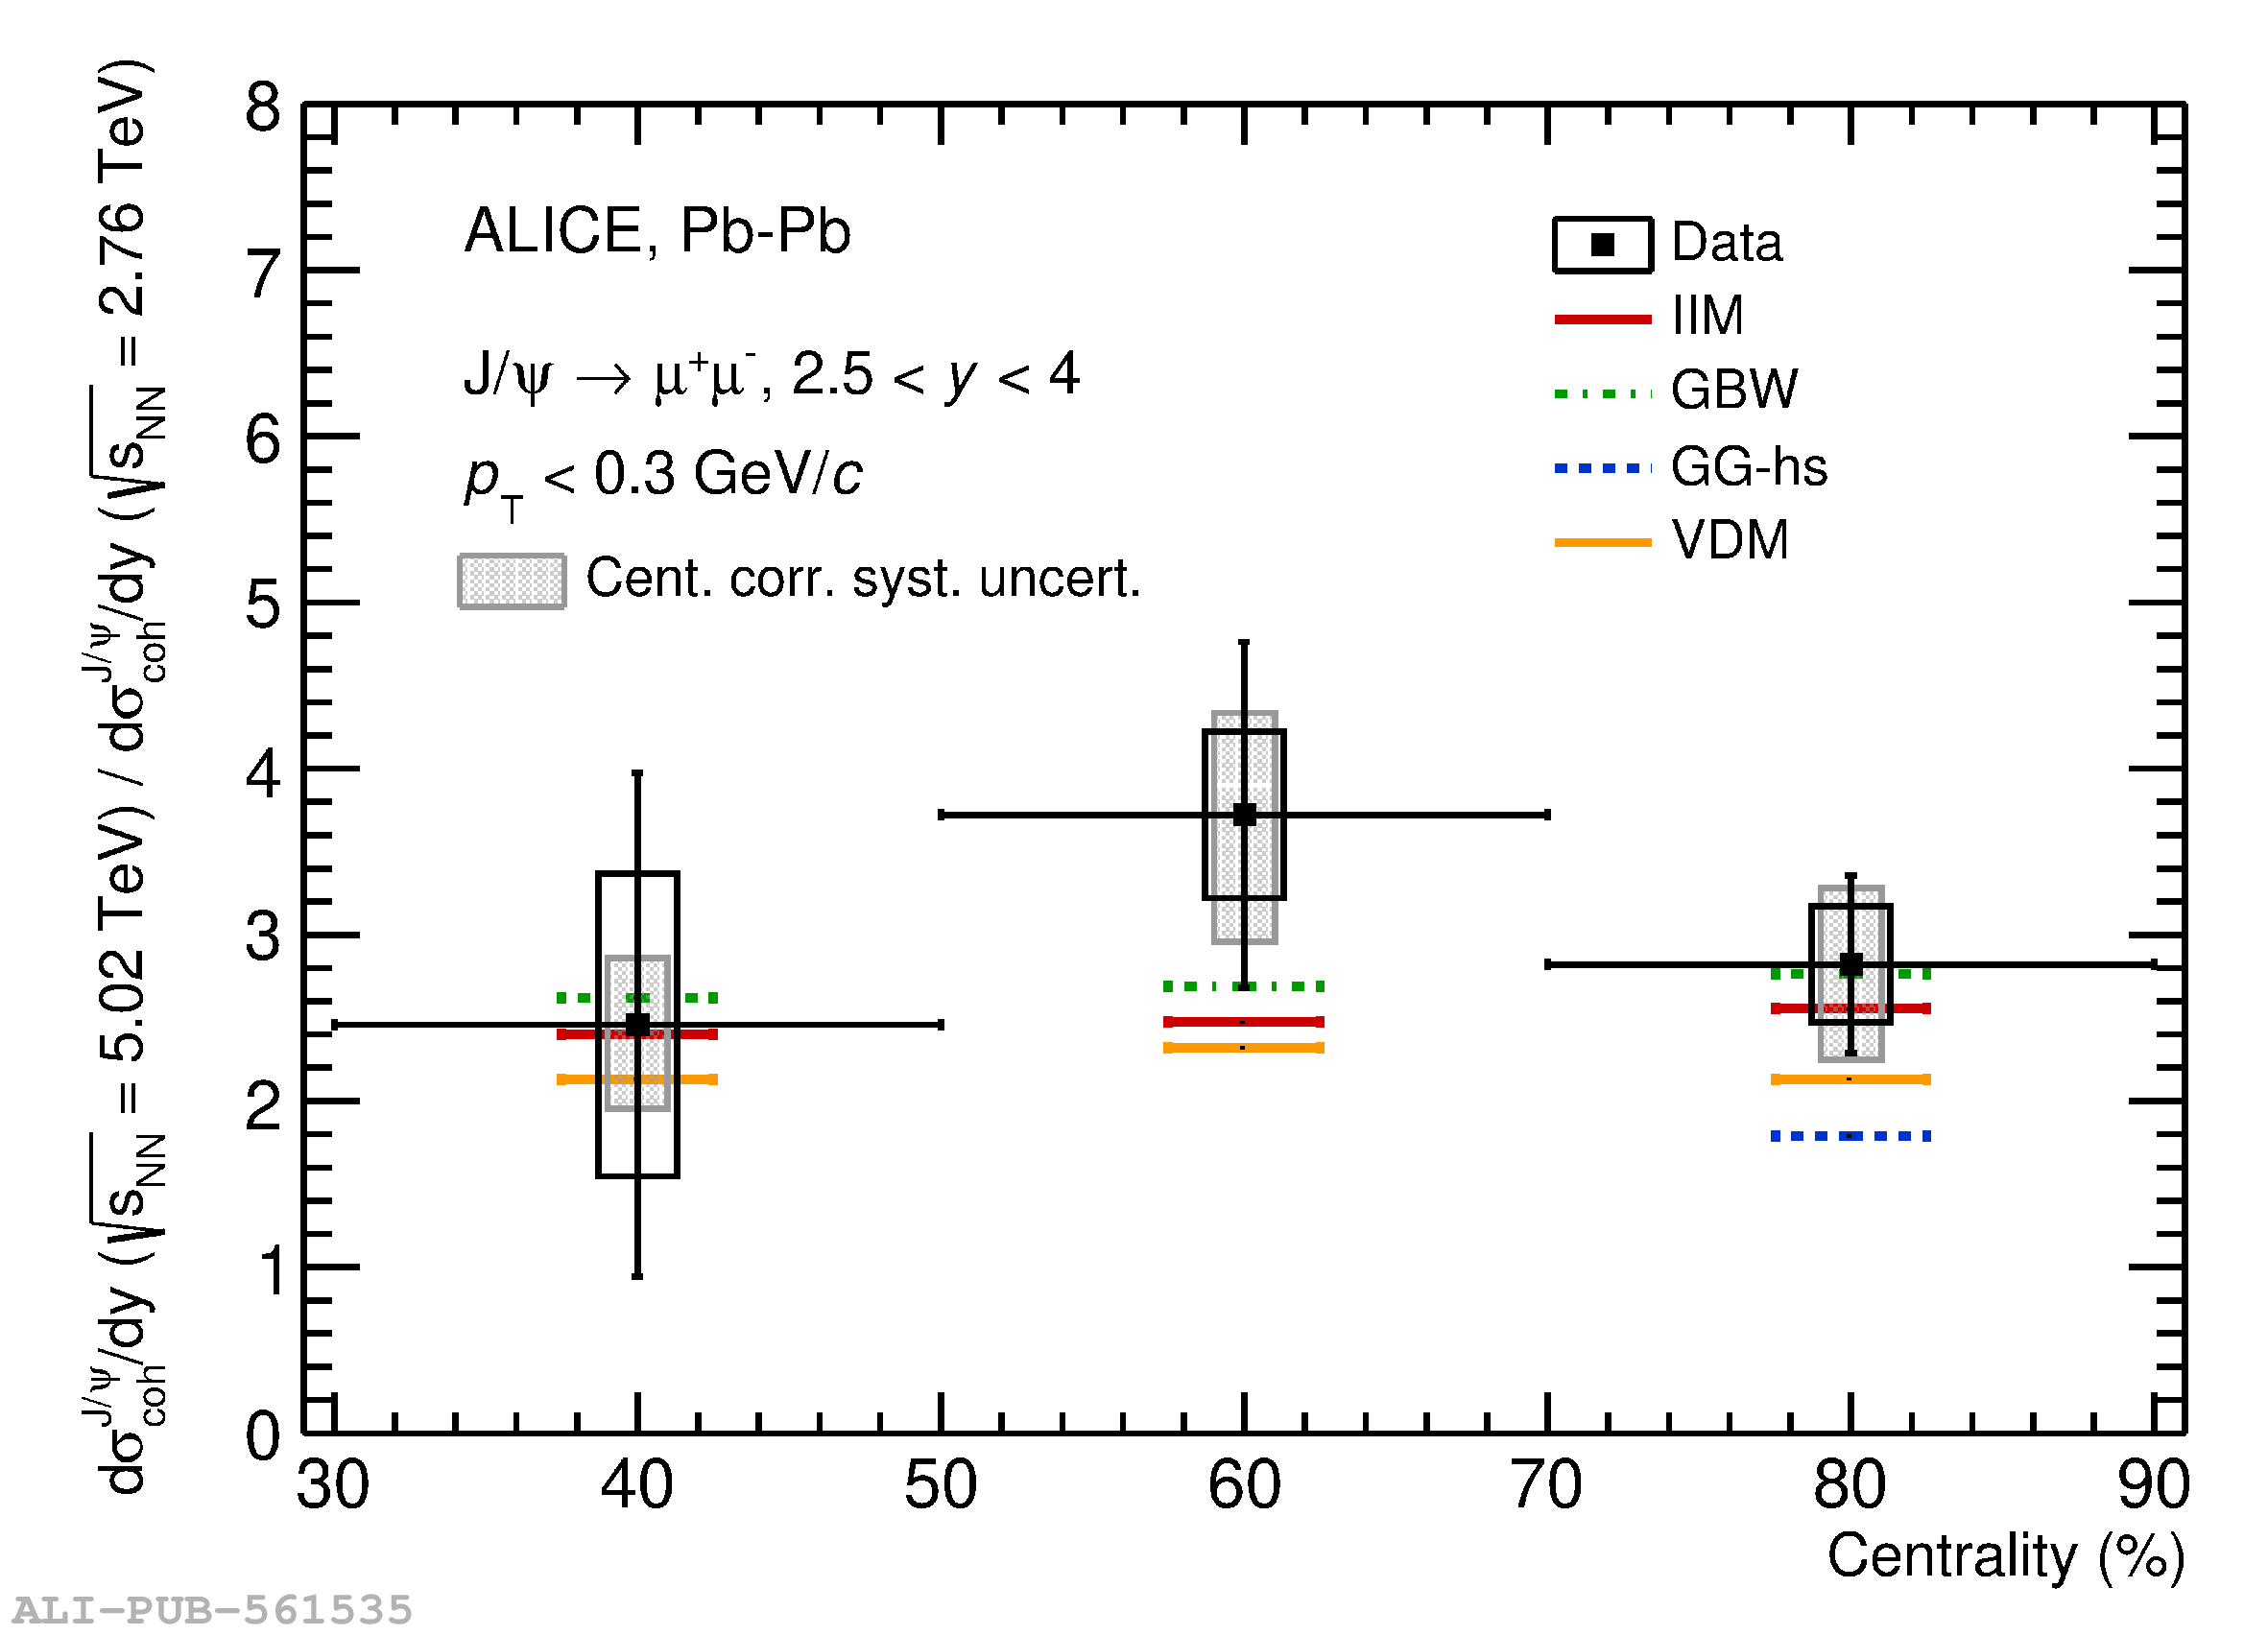 |
Figure A.1
J/$\psi$ coherent photoproduction cross section as a function of $\langle N_{\rm part} \rangle$ at forward rapidity in Pb$-$Pb collisions at $\sqrt{s_{\rm NN}}$ = 2.76 TeV. The vertical bars are the statistical uncertainties and the uncorrelated systematic uncertainties are represented as boxes. The centrality correlated systematic uncertainties are quoted in the legend. Results are compared with theoretical calculations from Ref. [33] (GG-hs), Ref. [32] (IIM S2 and S3, and GBW S2 and S3) and from Ref. [35] with updated Glauber calculations from Ref. [56] (VDM). The figure shows the integral of the cross section measurement as well as the corresponding theoretical model values in each centrality interval. Note that the most central bin, where only an upper limit is given, is half the size of the other intervals. Therefore, to evaluate the centrality dependence of J/$\psi$ coherent photoproduction, both data and theory have to be multiplied by a factor of two. |  |