We report about the properties of the underlying event measured with ALICE at the LHC in pp and p$-$Pb collisions at $\sqrt{s_{\rm NN}}=5.02$ TeV. The event activity, quantified by charged-particle number and summed-$p_{\rm T}$ densities, is measured as a function of the leading-particle transverse momentum ($p_{\rm T}^{\rm trig}$). These quantities are studied in three azimuthal-angle regions relative to the leading particle in the event: toward, away, and transverse. Results are presented for three different $p_{\rm T}$ thresholds (0.15, 0.5, and 1 GeV/$c$) at mid-pseudorapidity ($|\eta|<~0.8$). The event activity in the transverse region, which is the most sensitive to the underlying event, exhibits similar behaviour in both pp and p$-$Pb collisions, namely, a steep increase with $p_{\rm T}^{\rm trig}$ for low $p_{\rm T}^{\rm trig}$, followed by a saturation at $p_{\rm T}^{\rm trig} \approx 5$ GeV/$c$. The results from pp collisions are compared with existing measurements at other centre-of-mass energies. The quantities in the toward and away regions are also analyzed after the subtraction of the contribution measured in the transverse region. The remaining jet-like particle densities are consistent in pp and p$-$Pb collisions for $p_{\rm T}^{\rm trig}>10$ GeV/$c$, whereas for lower $p_{\rm T}^{\rm trig}$ values the event activity is slightly higher in p$-$Pb than in pp collisions. The measurements are compared with predictions from the PYTHIA 8 and EPOS LHC Monte Carlo event generators.
JHEP 06 (2023) 023
HEP Data
e-Print: arXiv:2204.10389 | PDF | inSPIRE
CERN-EP-2022-041
Figure group
Figure 1
Illustration of the toward, transverse, and away regions in the azimuthal plane with respect to the leading particle direction. The figure has been taken from Ref. [14]. | 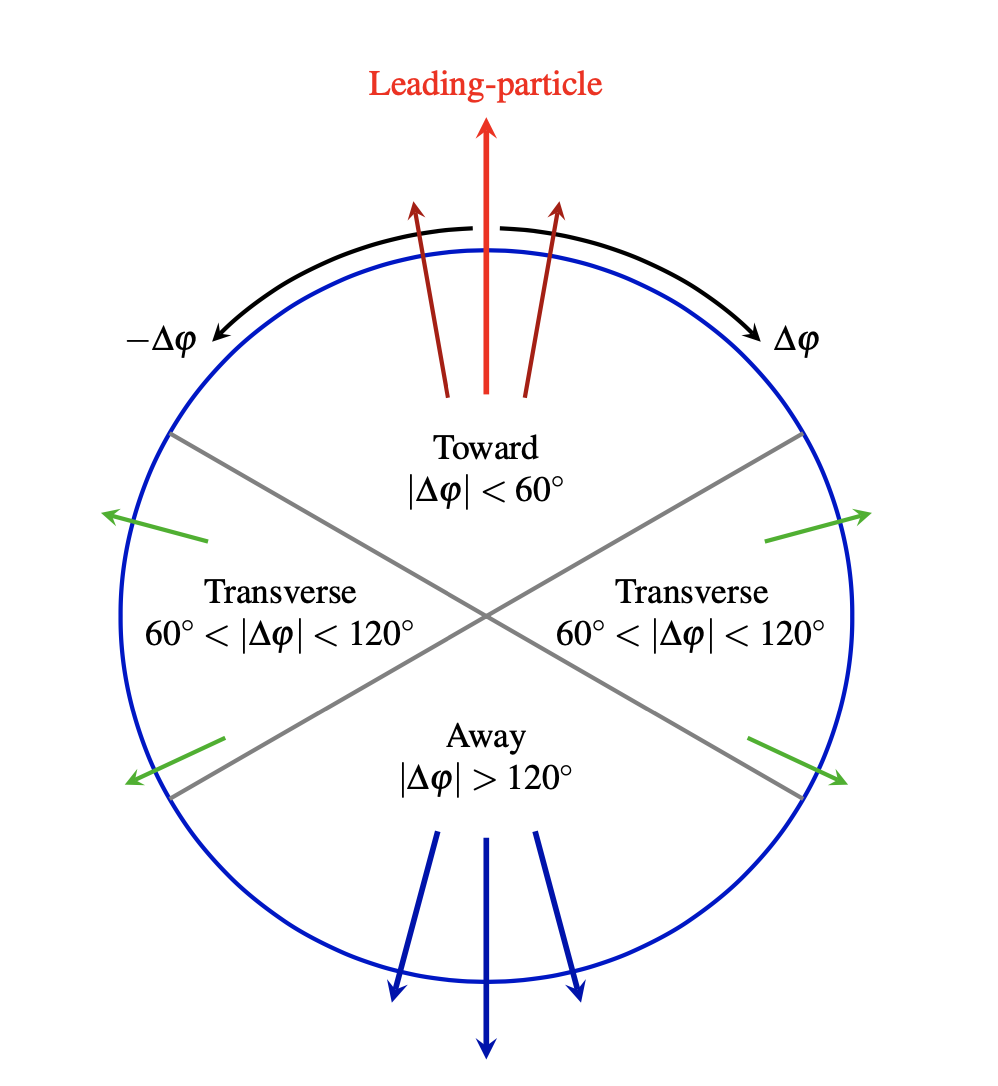 |
Figure 2
Charged-particle number density as a function of $p_{\rm T}^{\rm trig}$ measured in the transverse region for pp (left) and p-Pb collisions (right) at $\sqrt{s_{\rm NN}}=5.02$ TeV. Measurements were performed considering three $\pt$ thresholds for associated charged particles: $\pt >0.15$ GeV/$c$, $\pt >0.5$ GeV/$c$, and $\pt >1$ GeV/$c$. Data are compared with PYTHIA 8 and EPOS LHC predictions. The coloured boxes and the error bars represent the systematic and statistical uncertainties, respectively. |   |
Figure 3
Charged-particle number density as a function of $p_{\rm T}^{\rm trig}$ measured in pp (left) and p-Pb collisions (right) at $\sqrt{s_{\rm NN}}=5.02$ TeV. Measurements were performed considering associated charged particles with $\pt>0.5$ GeV/$c$. Results for the toward, transverse, and away regions are displayed. The coloured boxes and the error bars represent the systematic and statistical uncertainties, respectively. |   |
Figure 4
The charged-particle number (left) and summed-$p_{\rm T}$ (right) densities as a function of $p_{\rm T}^{\rm trig}$ in pp collisions at $\sqrt{s}=5.02$ TeV are displayed. Results for the transverse (top), away (middle), and toward (bottom) regions were obtained for the transverse momentum threshold $\pt>0.5$ GeV/$c$. The shaded area and the error bars around the data points represent the systematic and statistical uncertainties, respectively. Data are compared with PYTHIA 8/Monash (solid line) and EPOS LHC (dashed line) predictions. The data-to-model ratios are displayed in the bottom panel of each plot. The boxes around unity represent the statistical and systematic uncertainties added in quadrature. | 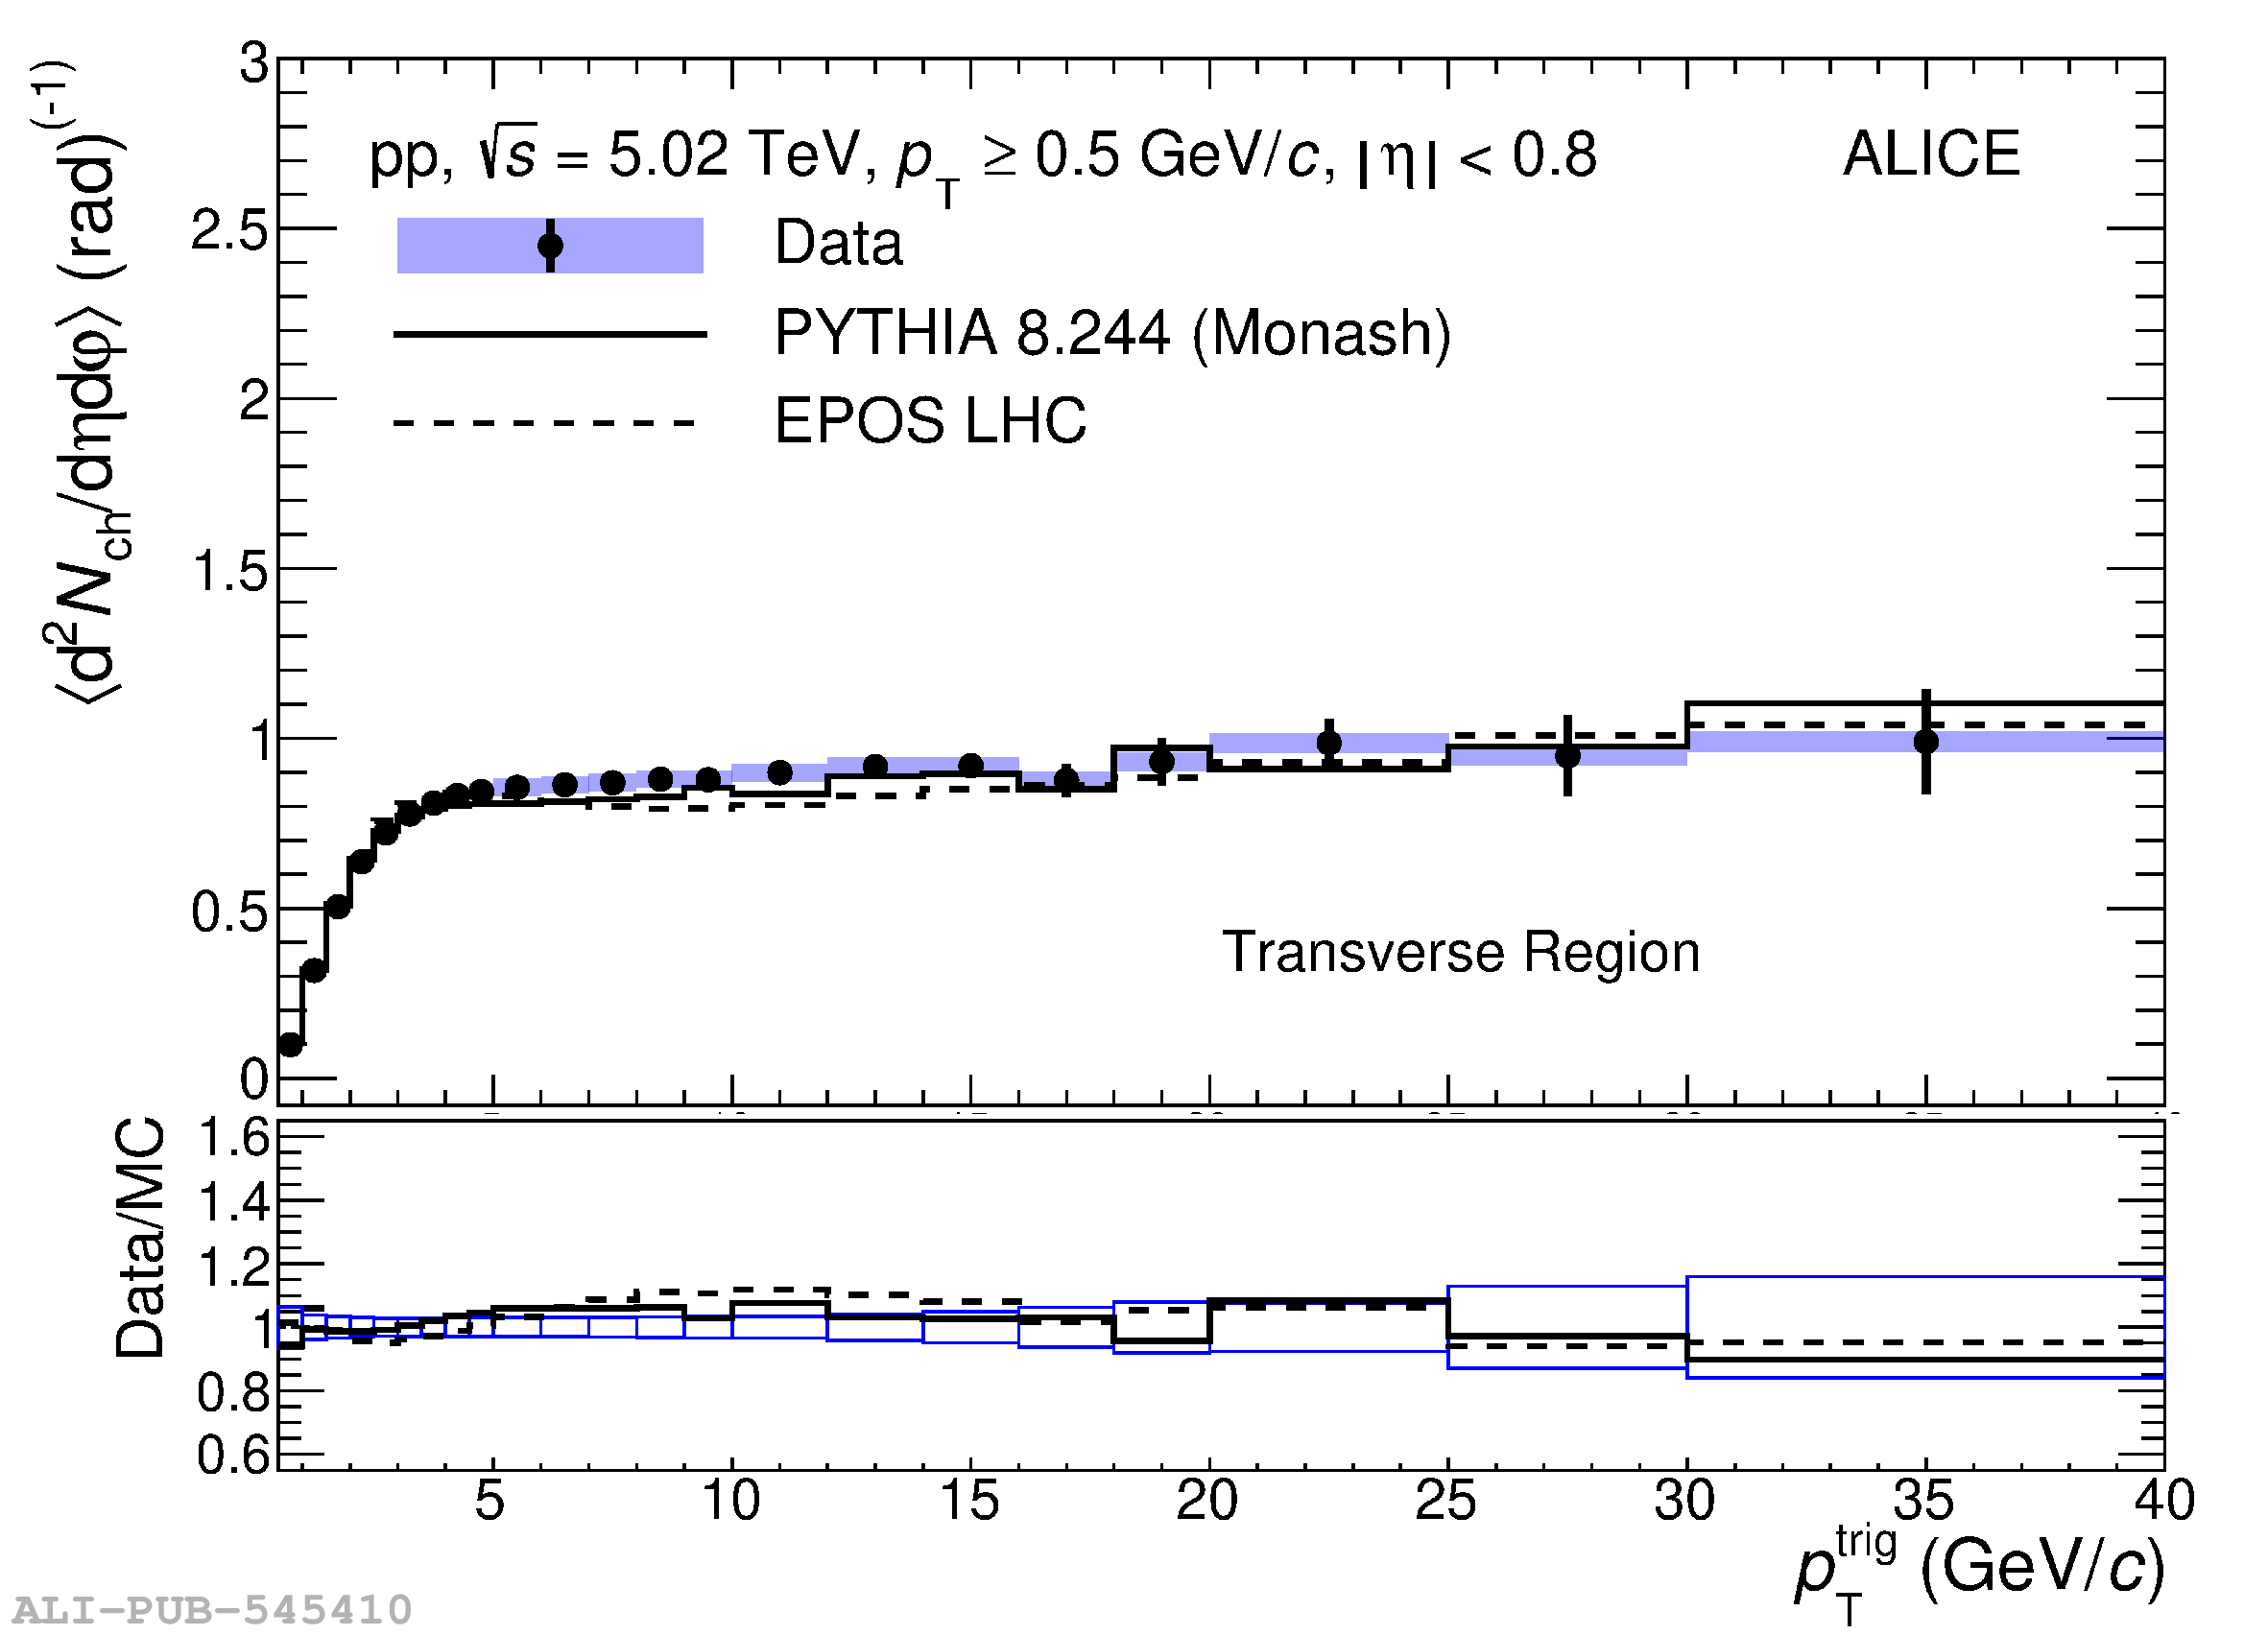  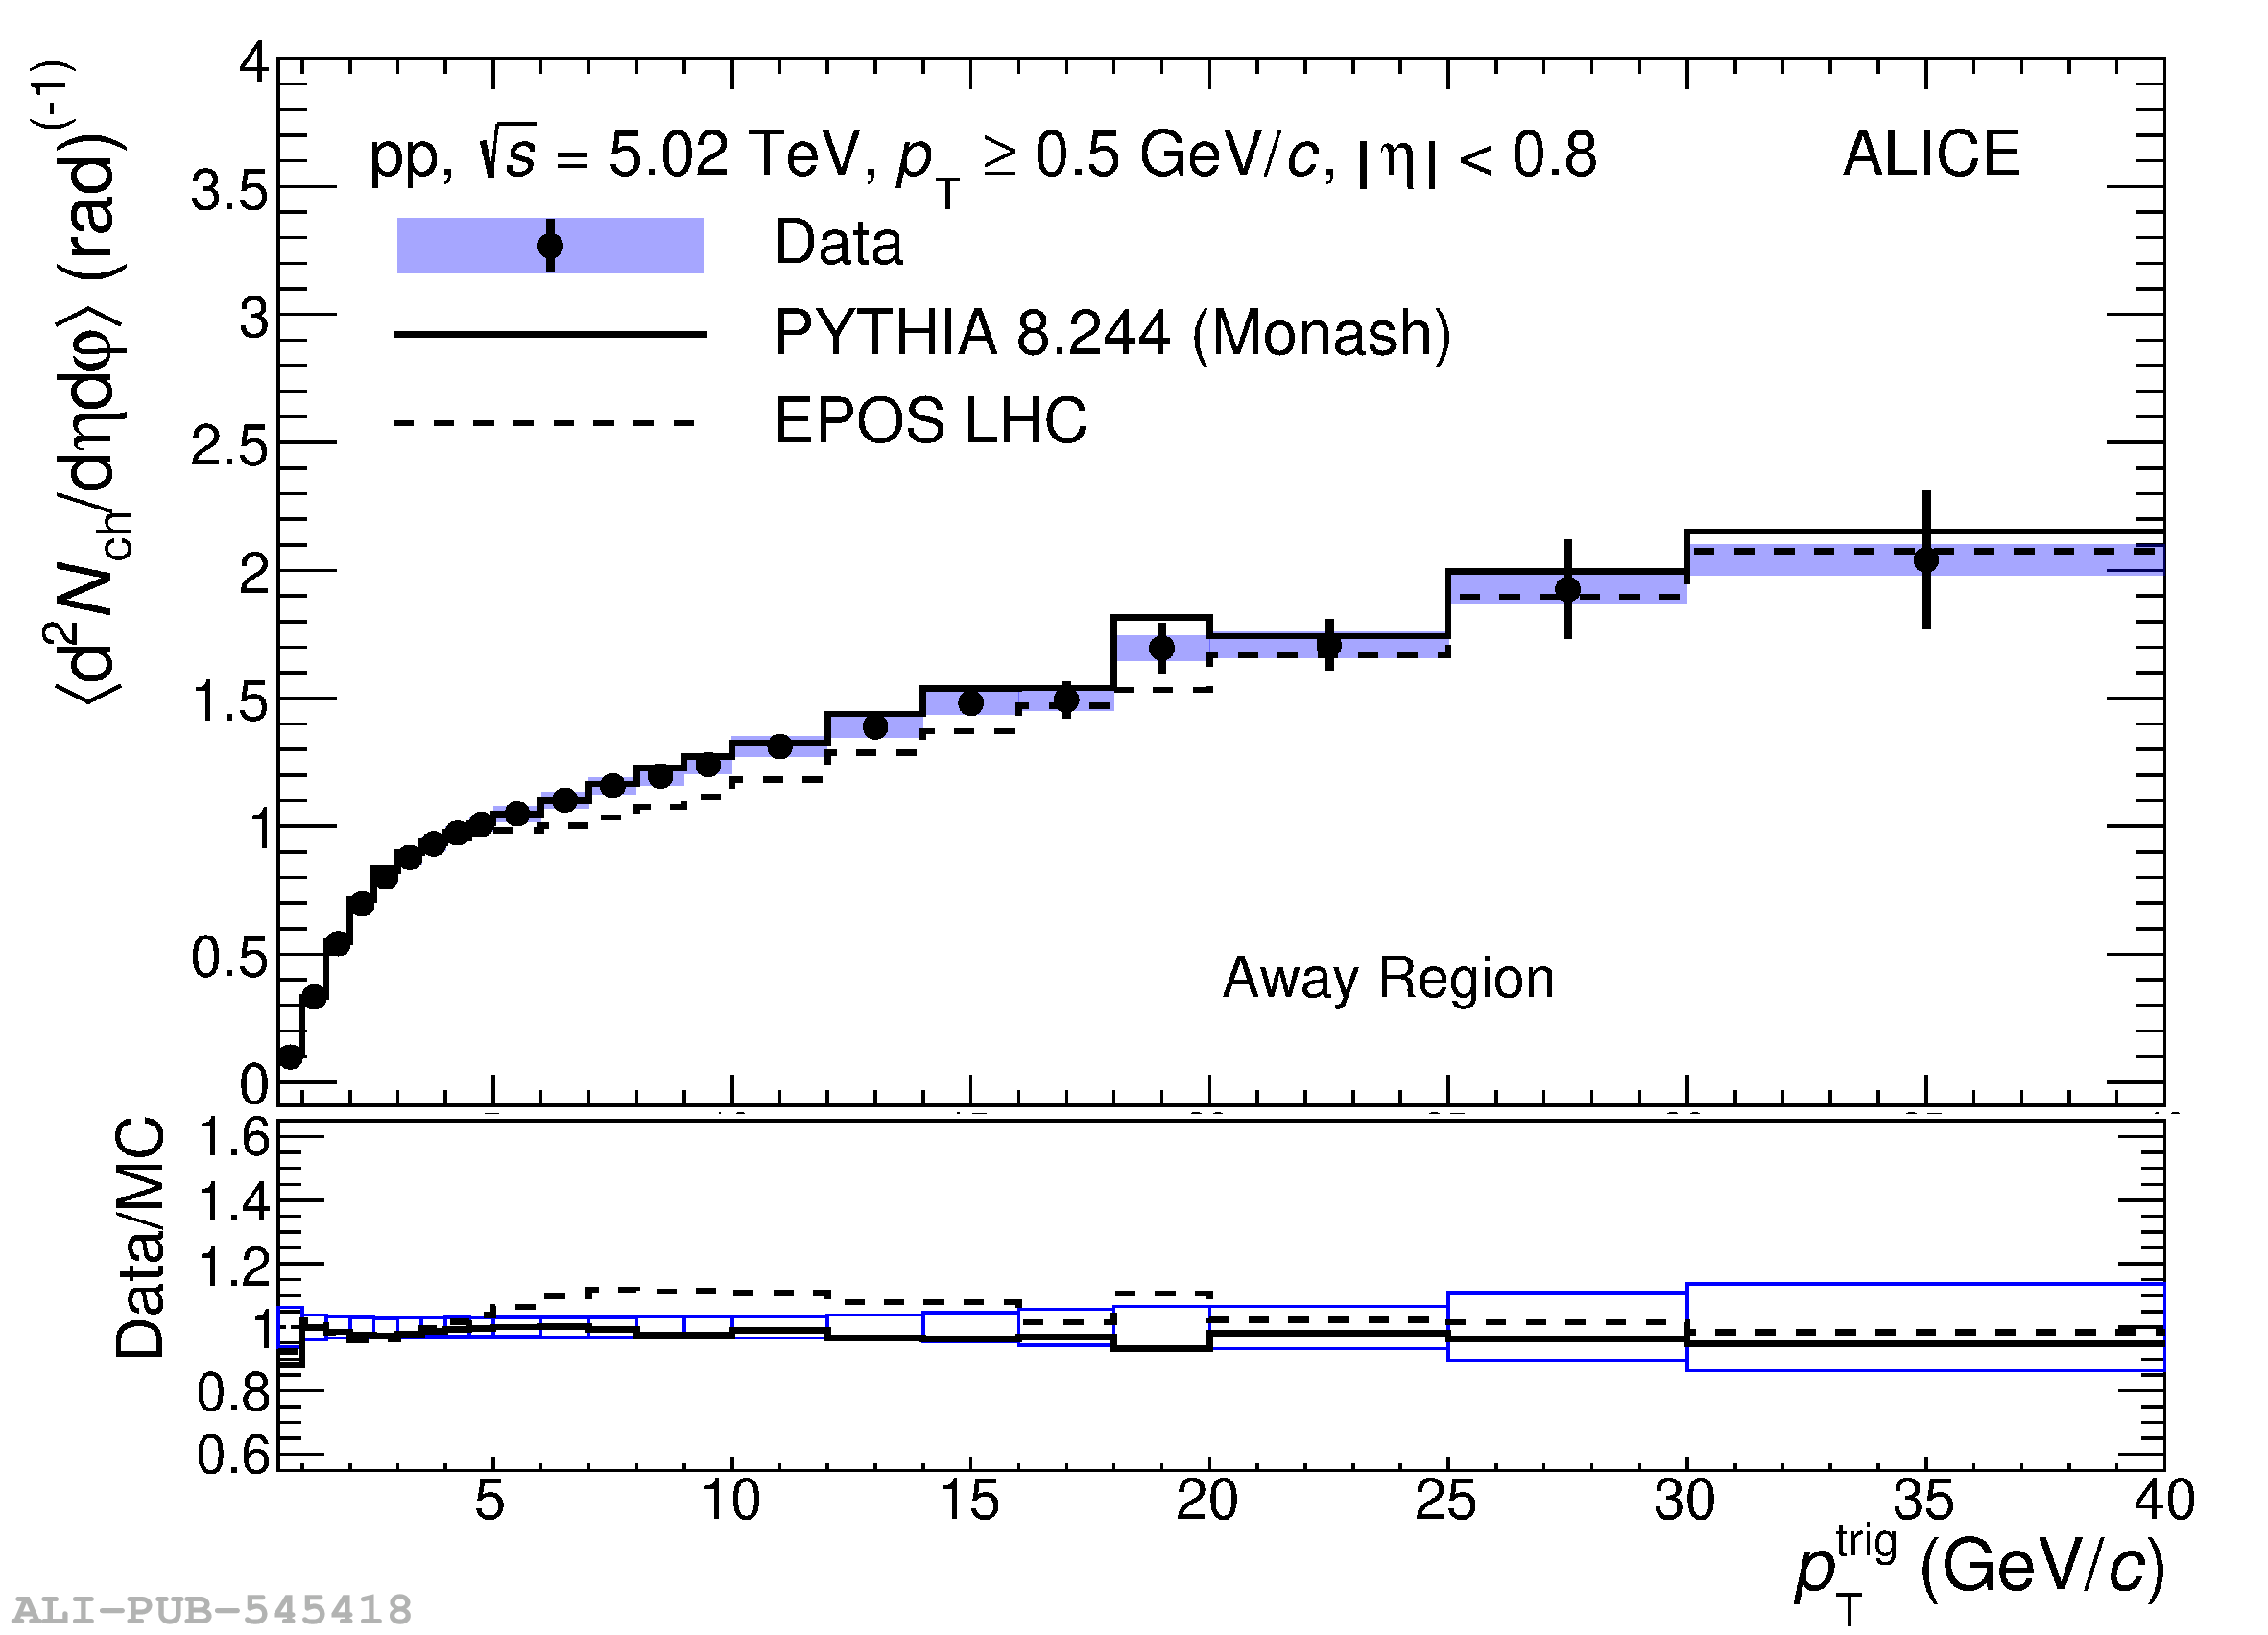  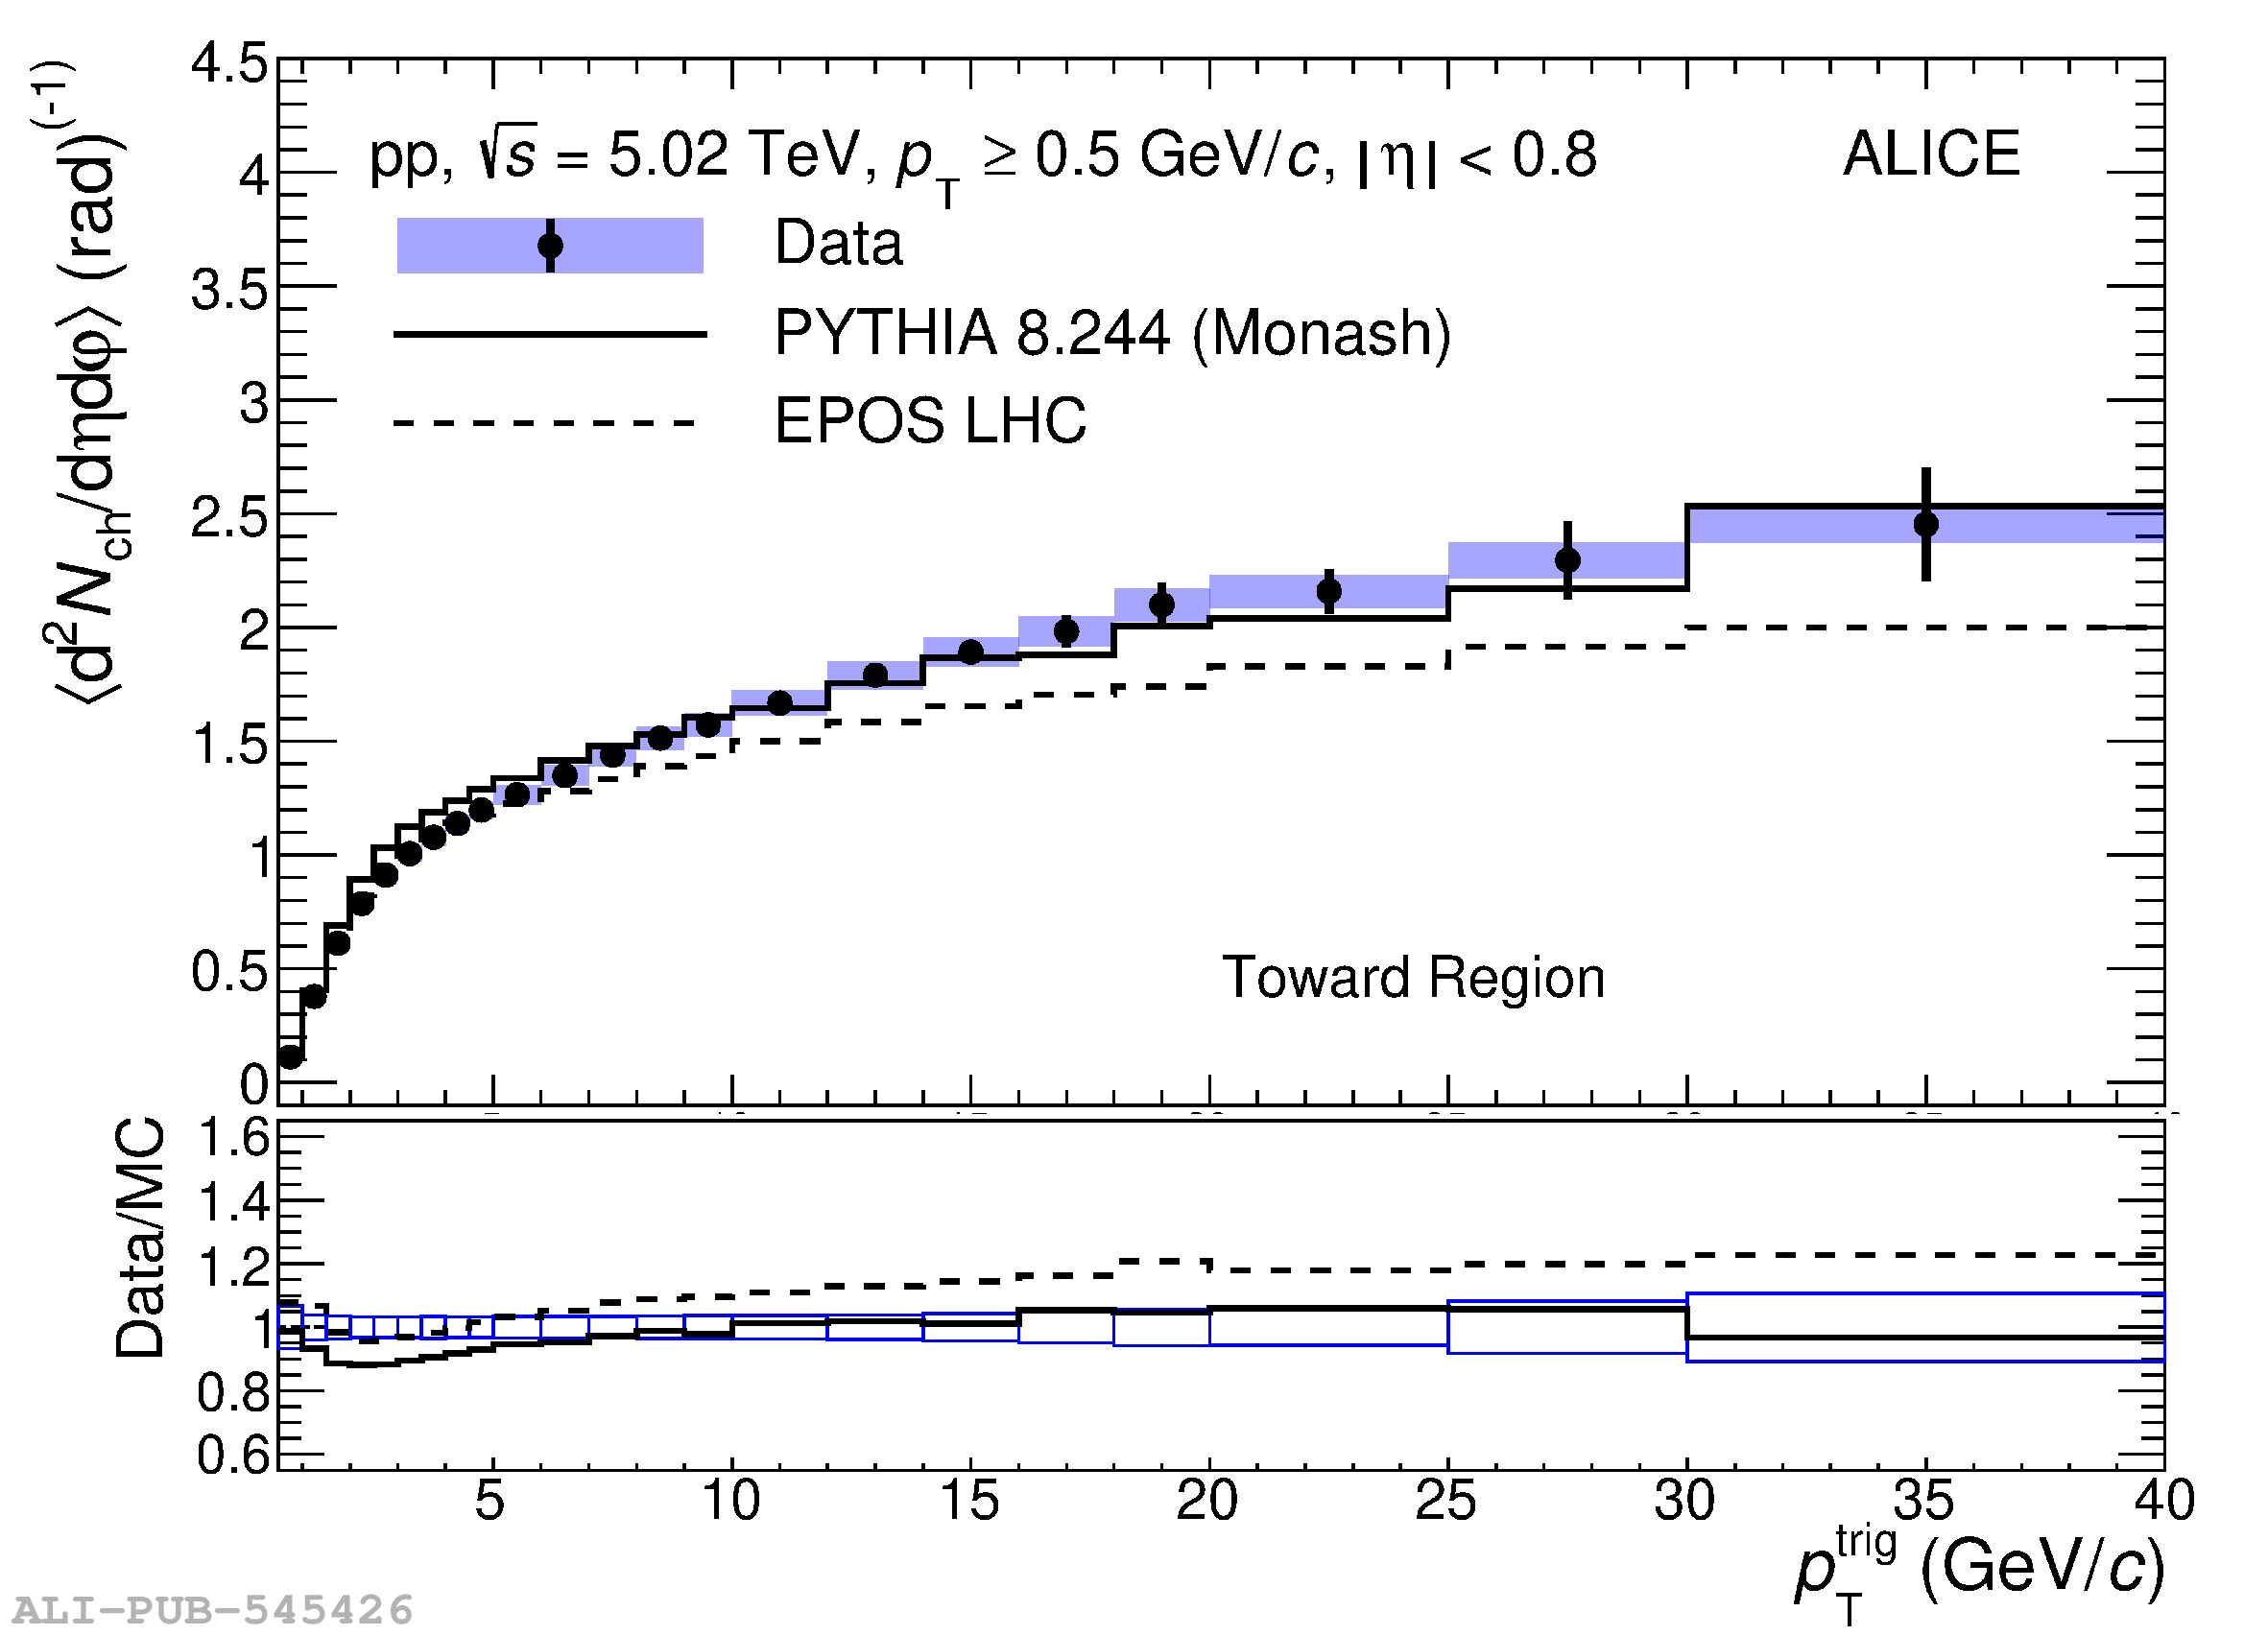 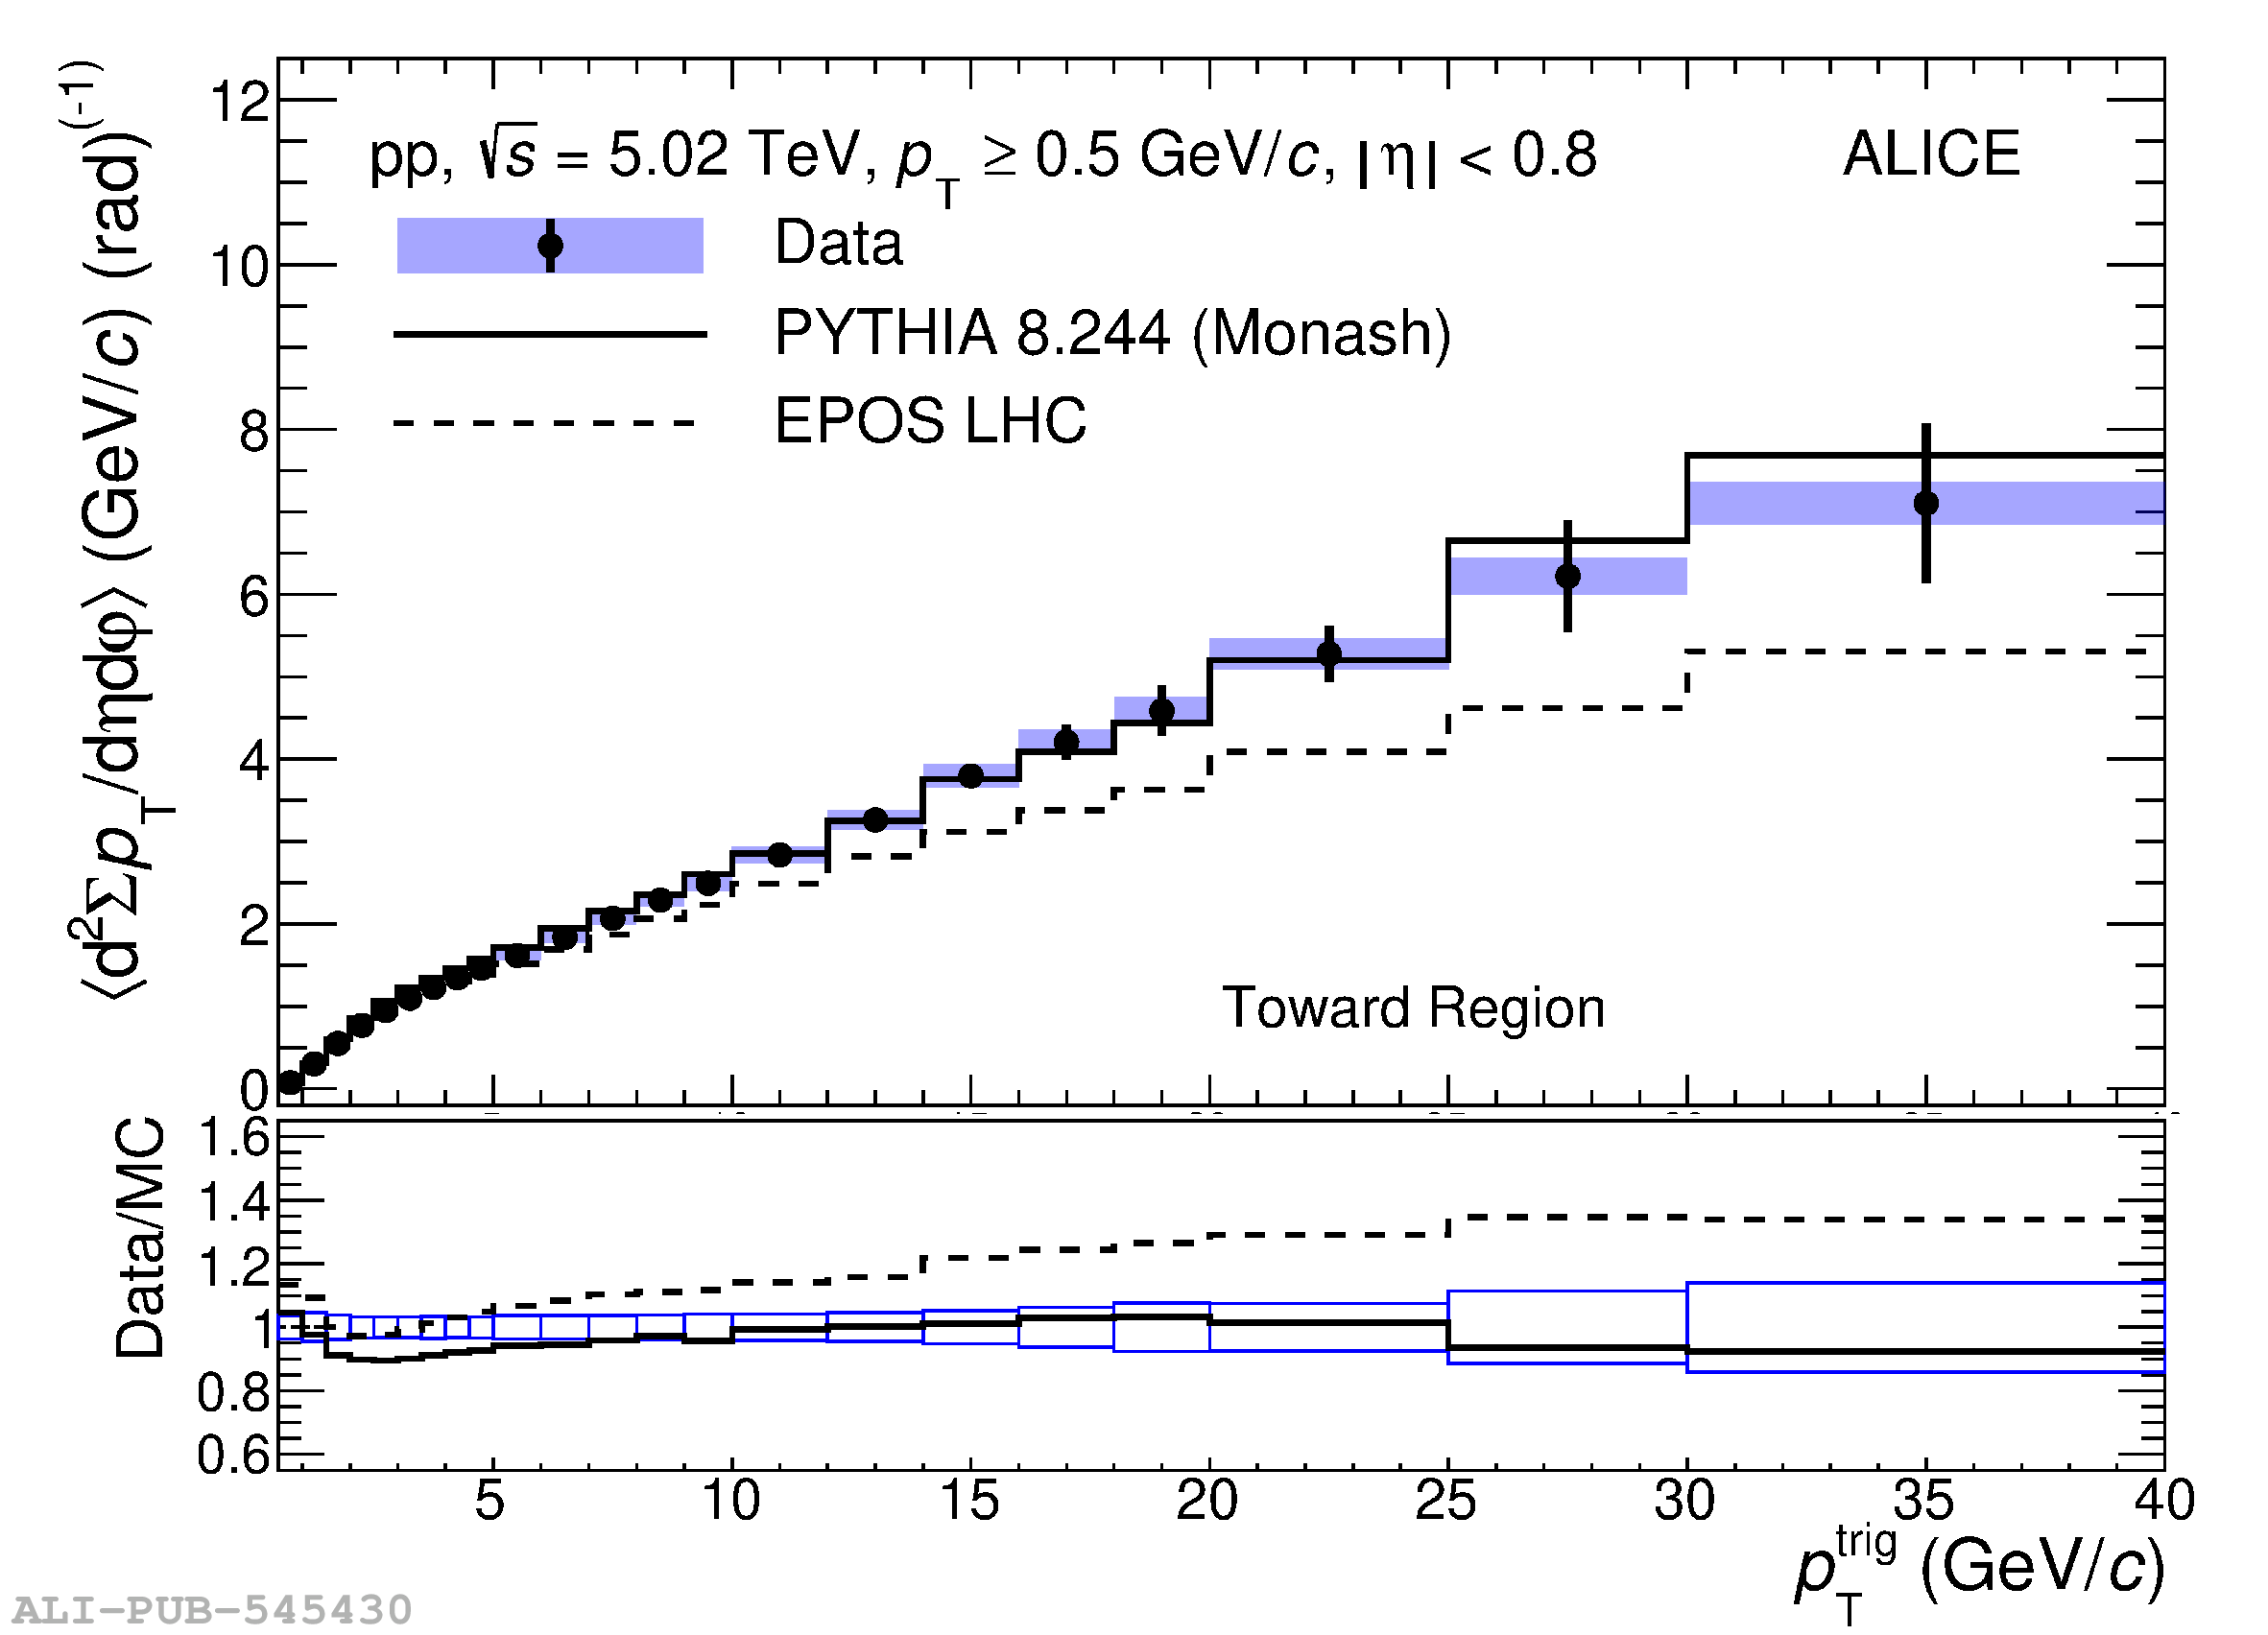 |
Figure 5
The charged-particle number (left) and summed-$p_{\rm T}$ (right) densities as a function of $p_{\rm T}^{\rm trig}$ in p-Pb collisions at $\sqrt{s_{\rm NN}}=5.02$ TeV are displayed. Results for the transverse (top), away (middle), and toward (bottom) regions were obtained for the transverse momentum threshold $\pt>0.5$ GeV/$c$. The shaded area and the error bars around the data points represent the systematic and statistical uncertainties, respectively. Data are compared with PYTHIA 8/Angantyr (solid line) and EPOS LHC (dashed line) predictions. The data-to-model ratios are displayed in the bottom panel of each plot. The boxes around unity represent the statistical and systematic uncertainties added in quadrature. | 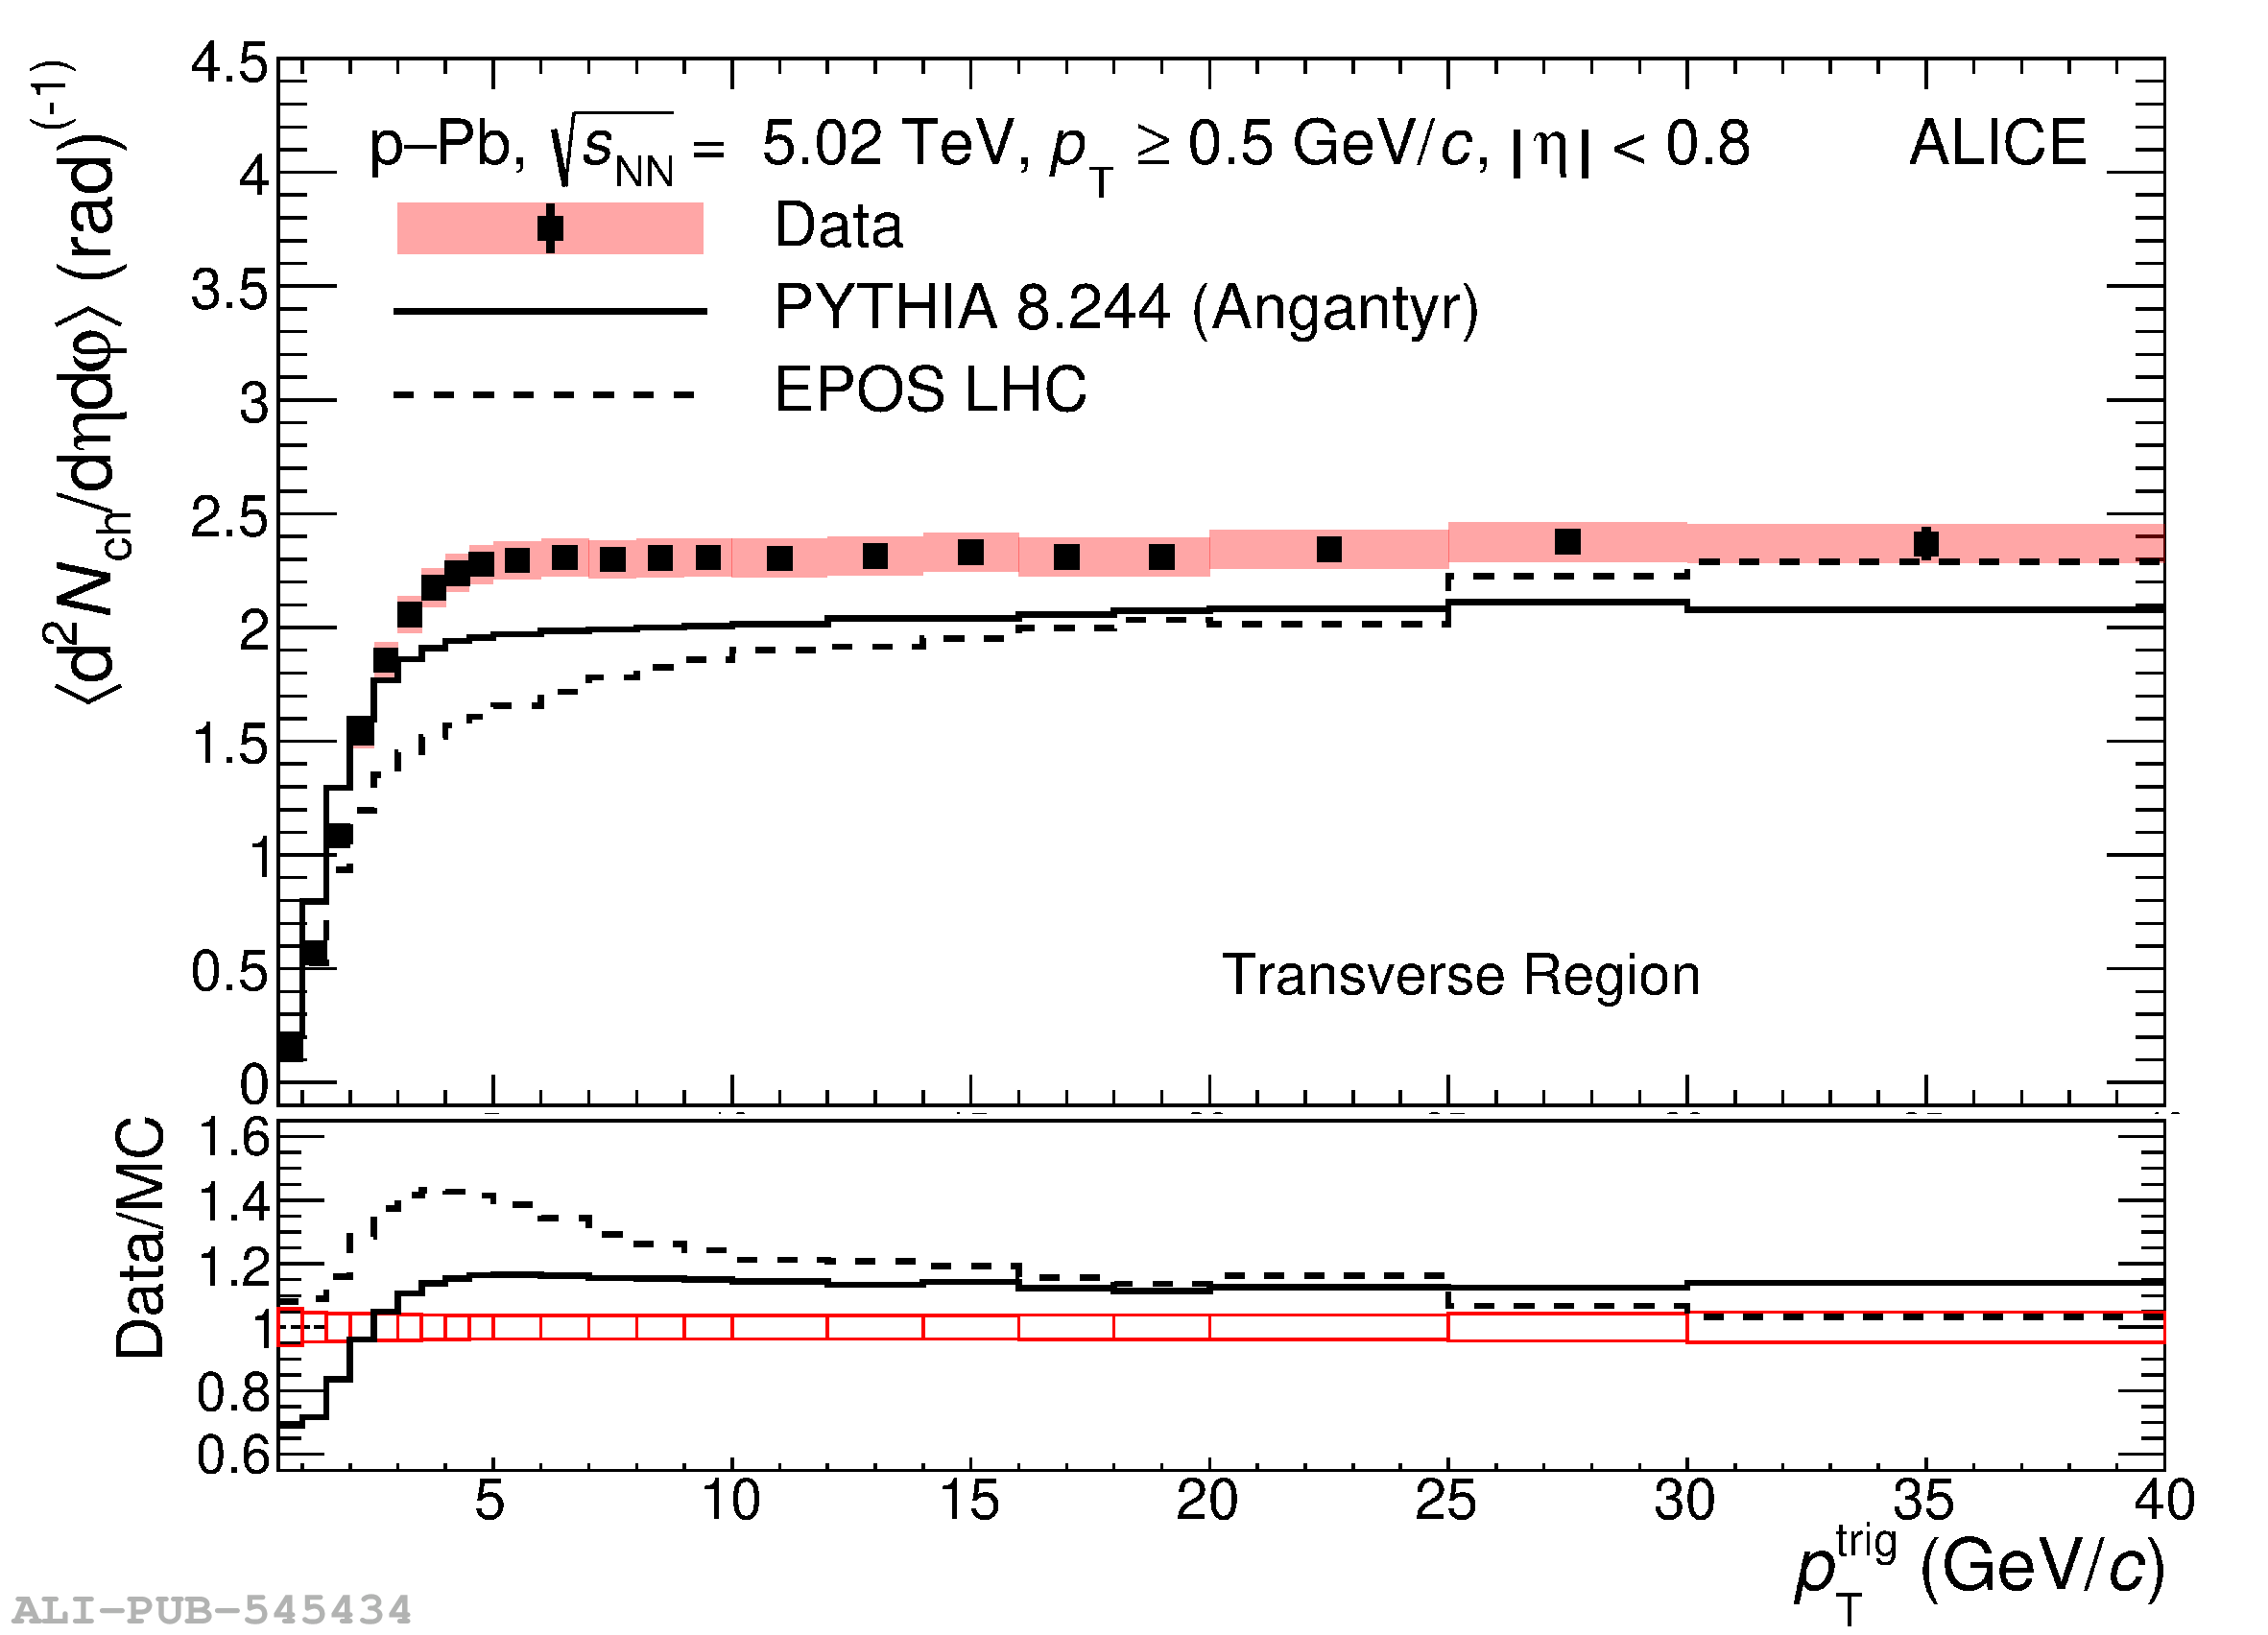 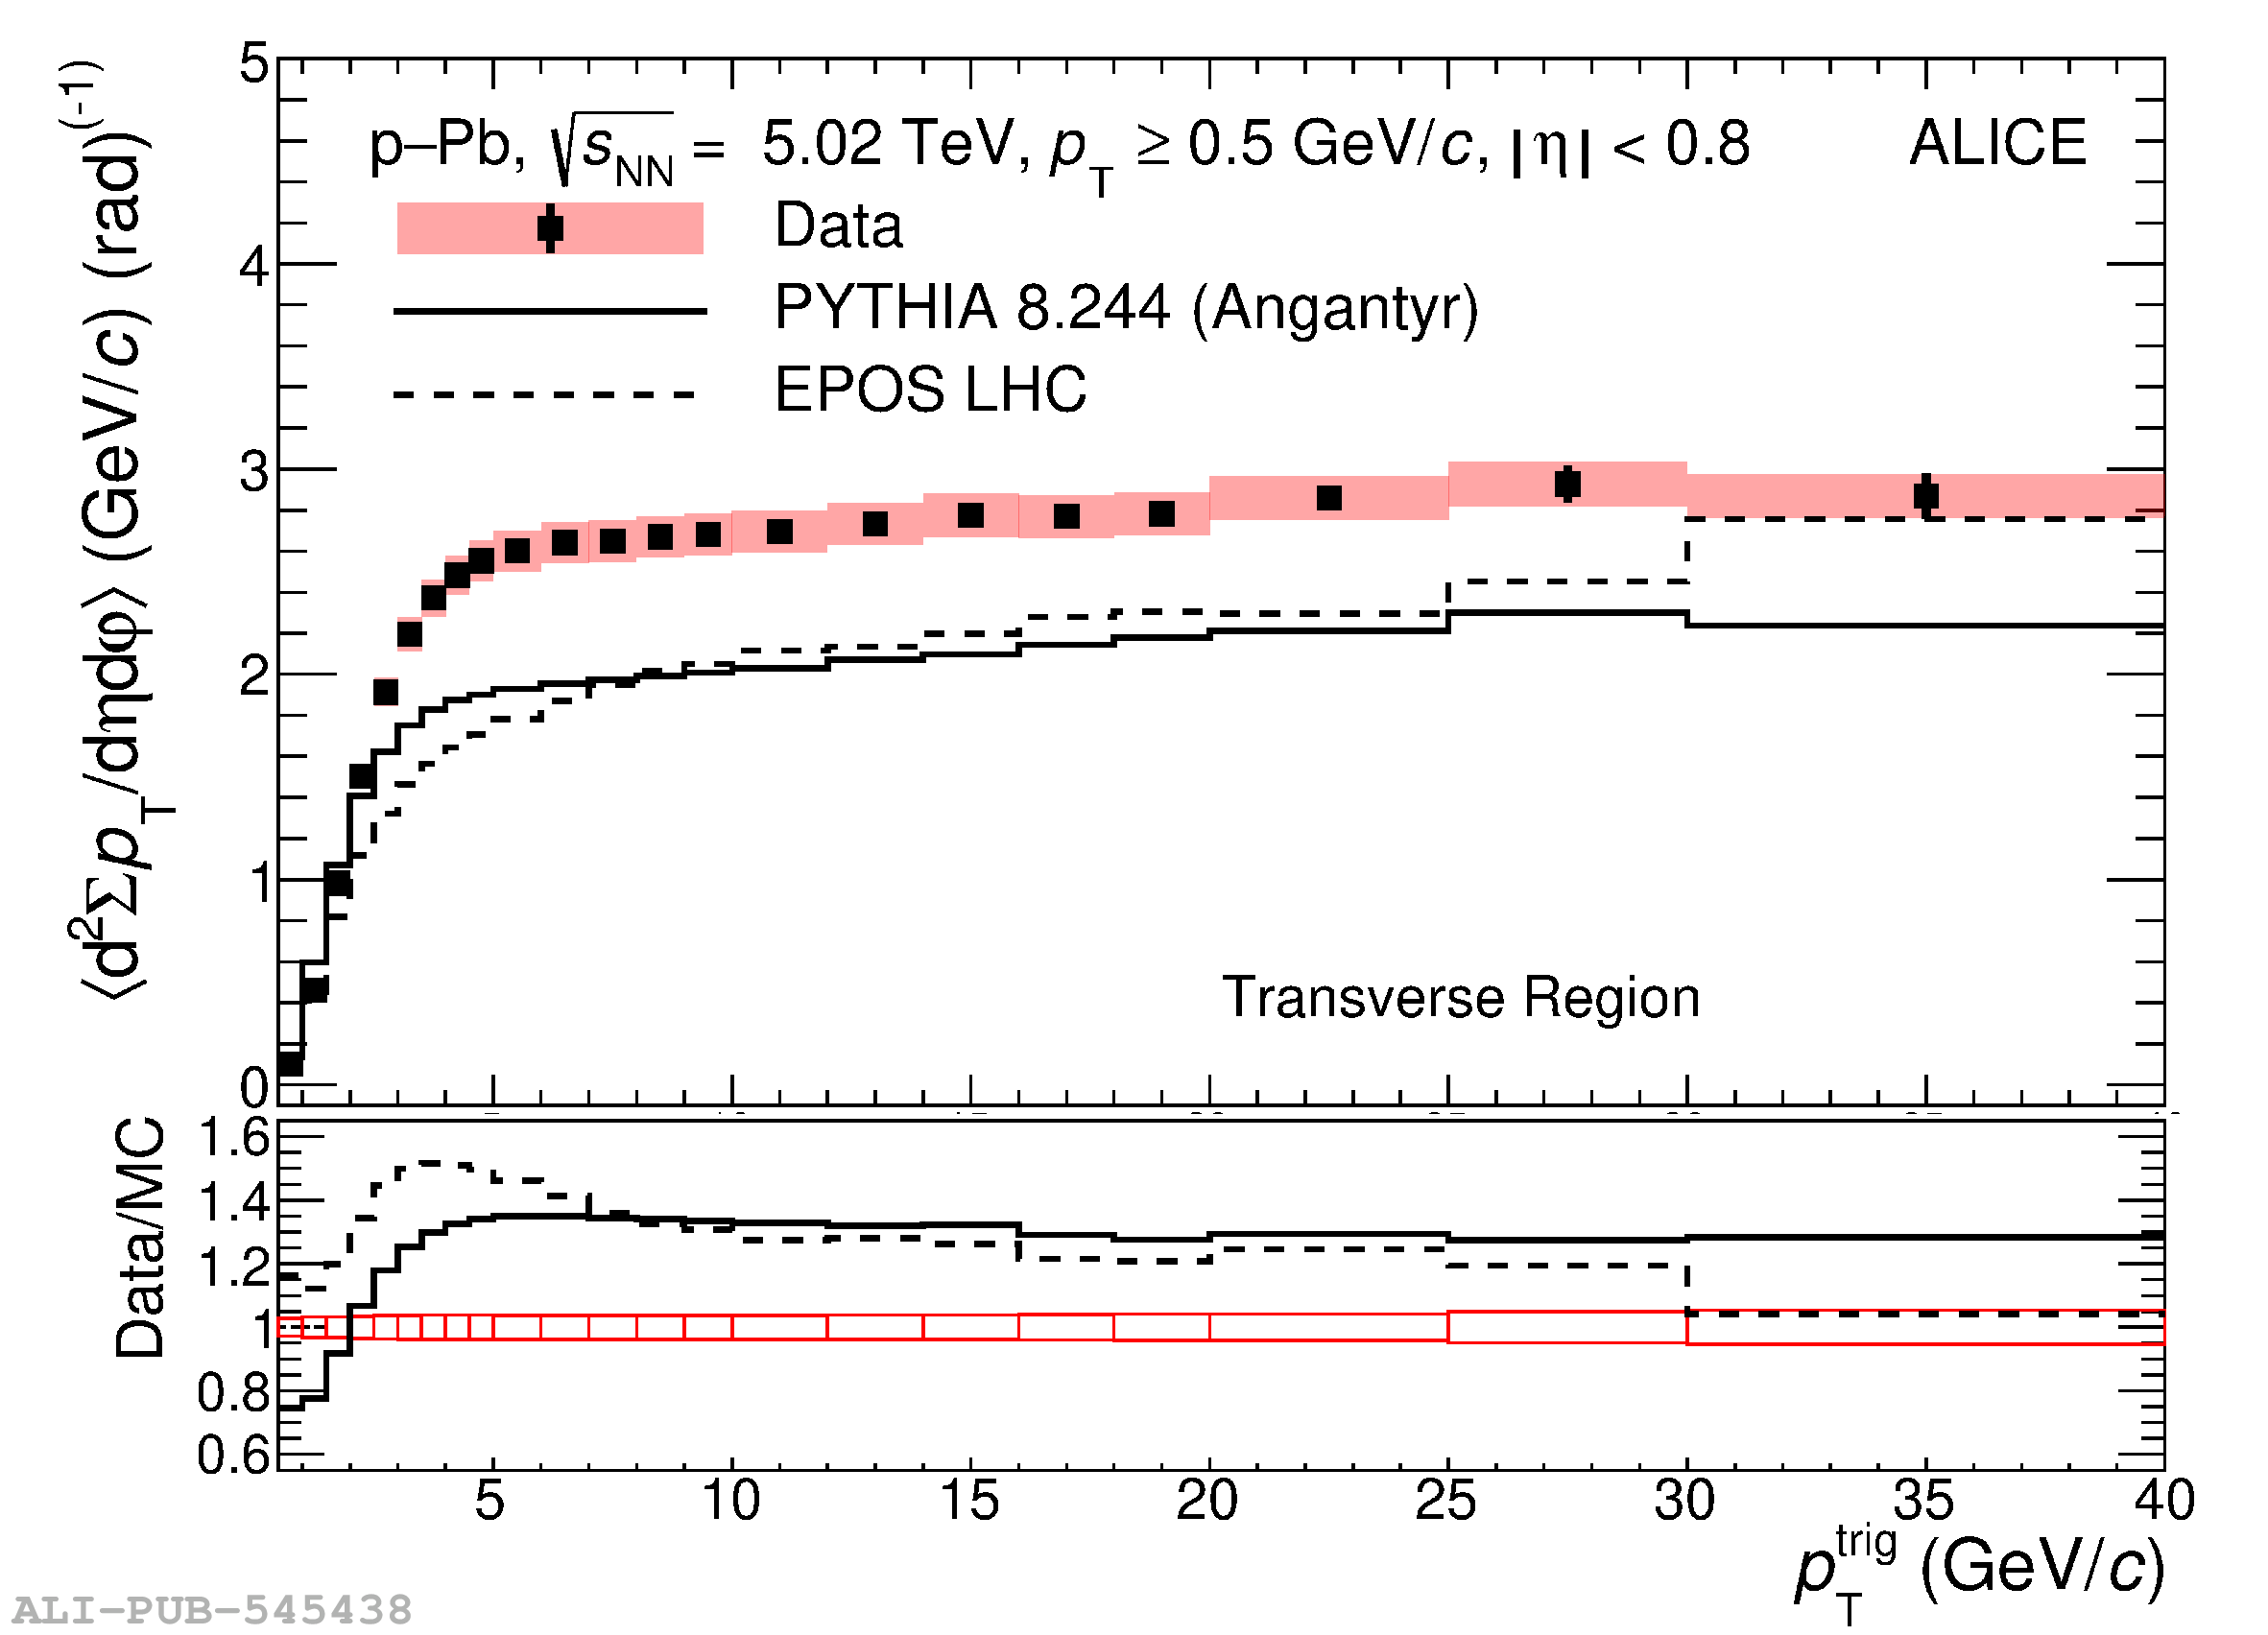   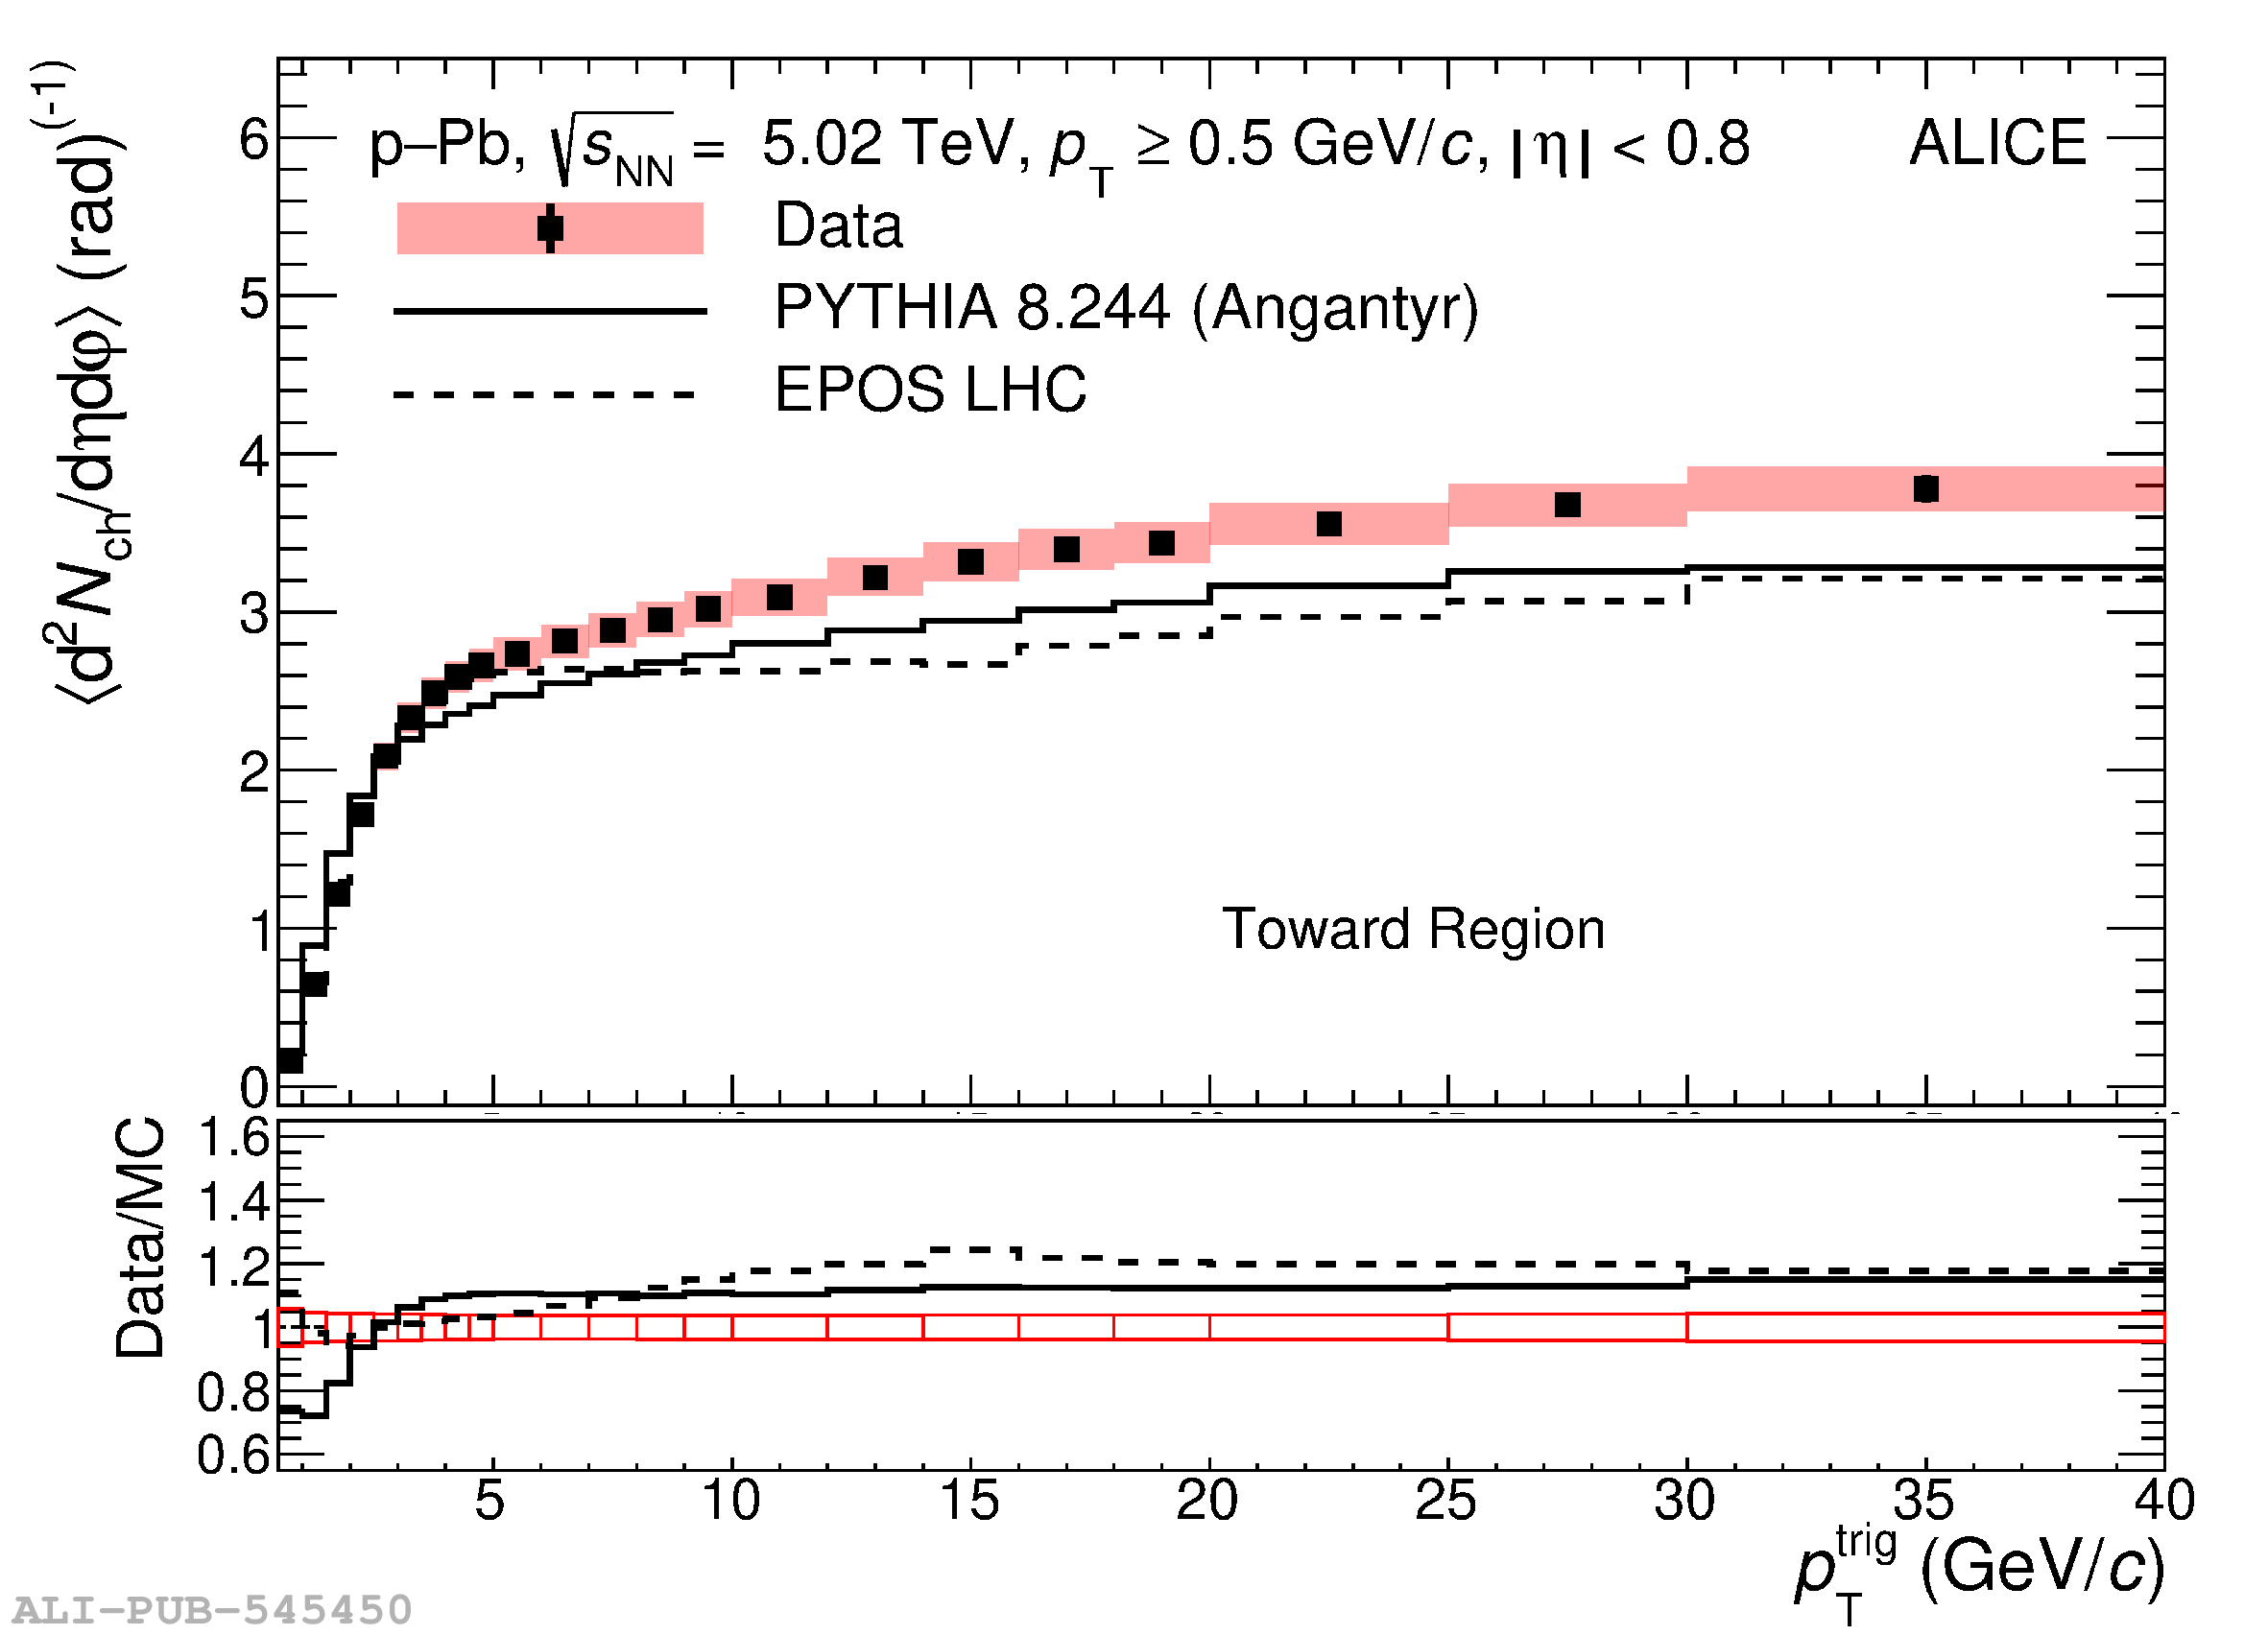 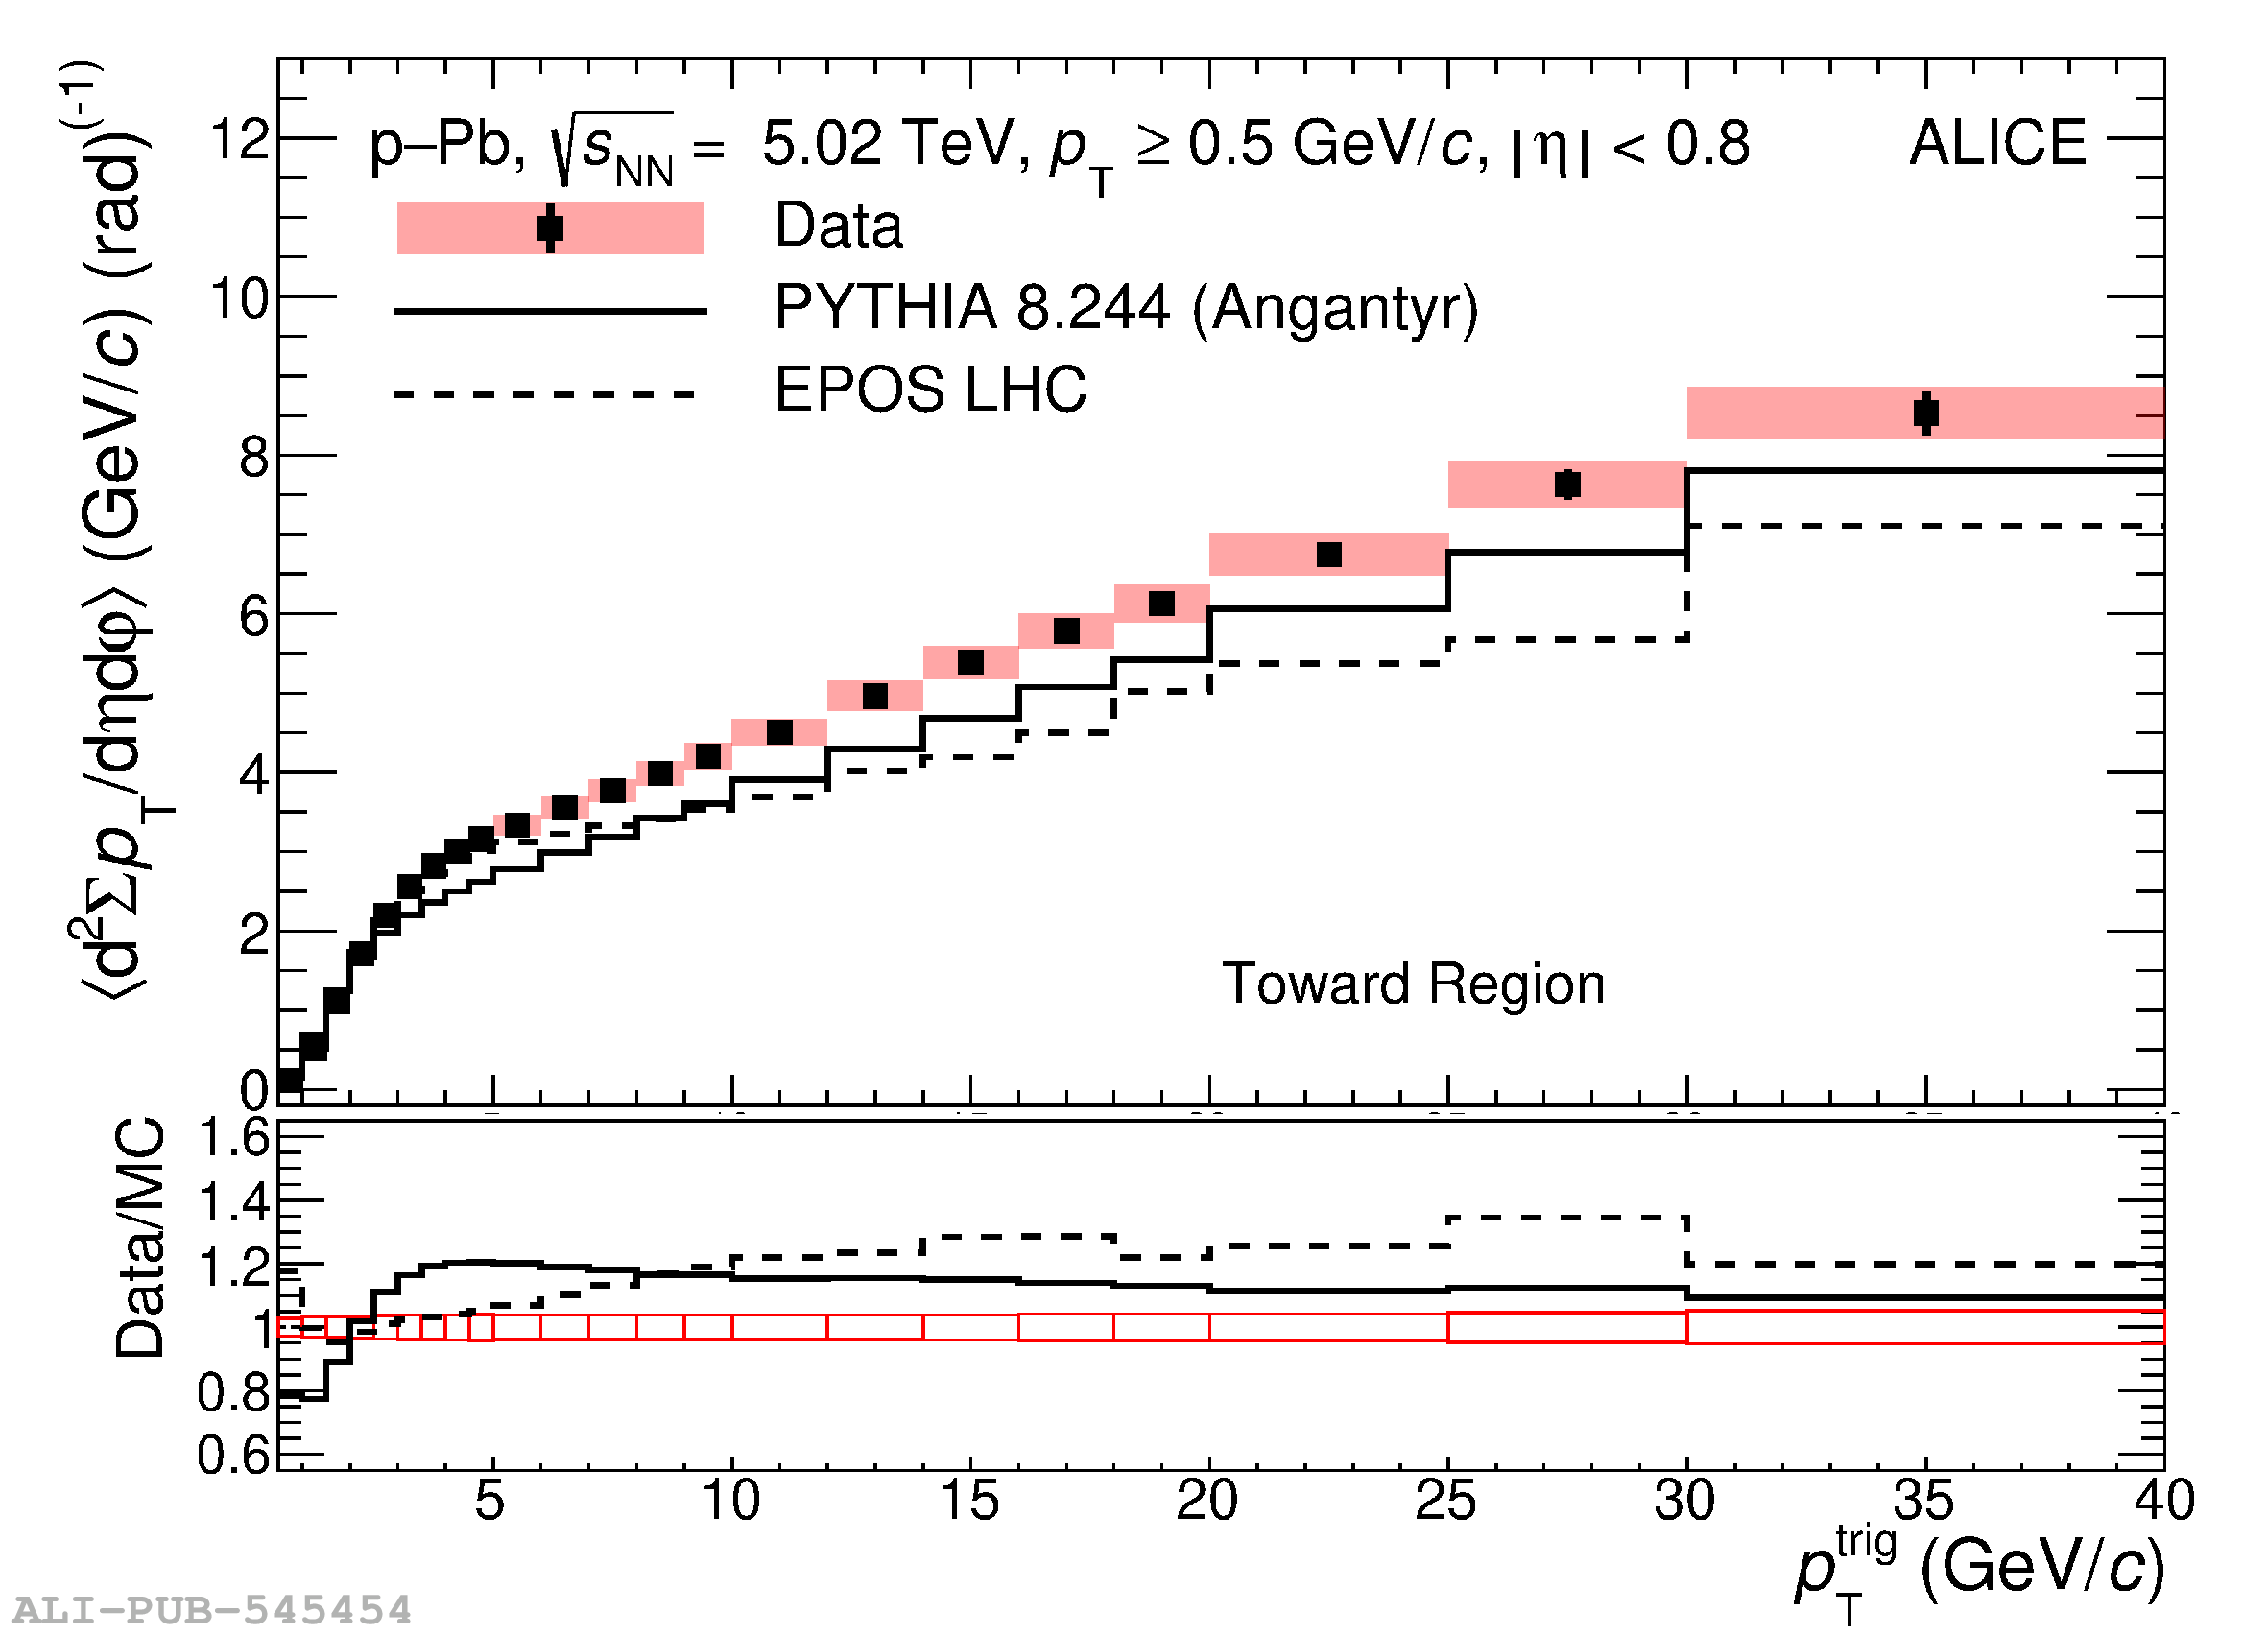 |
Figure 6
Upper panels: charged-particle number (left) and summed-$p_{\rm T}$ (right) densities as a function of $p_{\rm T}^{\rm trig}$ in pp (blue) and p-Pb (red) collisions at $\sqrt{s_{\rm NN}}=5.02$ TeV. Results for data and comparison with models PYTHIA 8 (green) and EPOS LHC (red) predictions for the away (upper) and toward (bottom) regions, after the subtraction of the charged-particle number (left) and summed-$p_{\rm T}$ (right) densities in the transverse region, are shown. Bottom panels: charged-particle number and summed-$p_{\rm T}$ densities measured in pp collisions divided by those in p-Pb collisions are displayed for both data and models. | 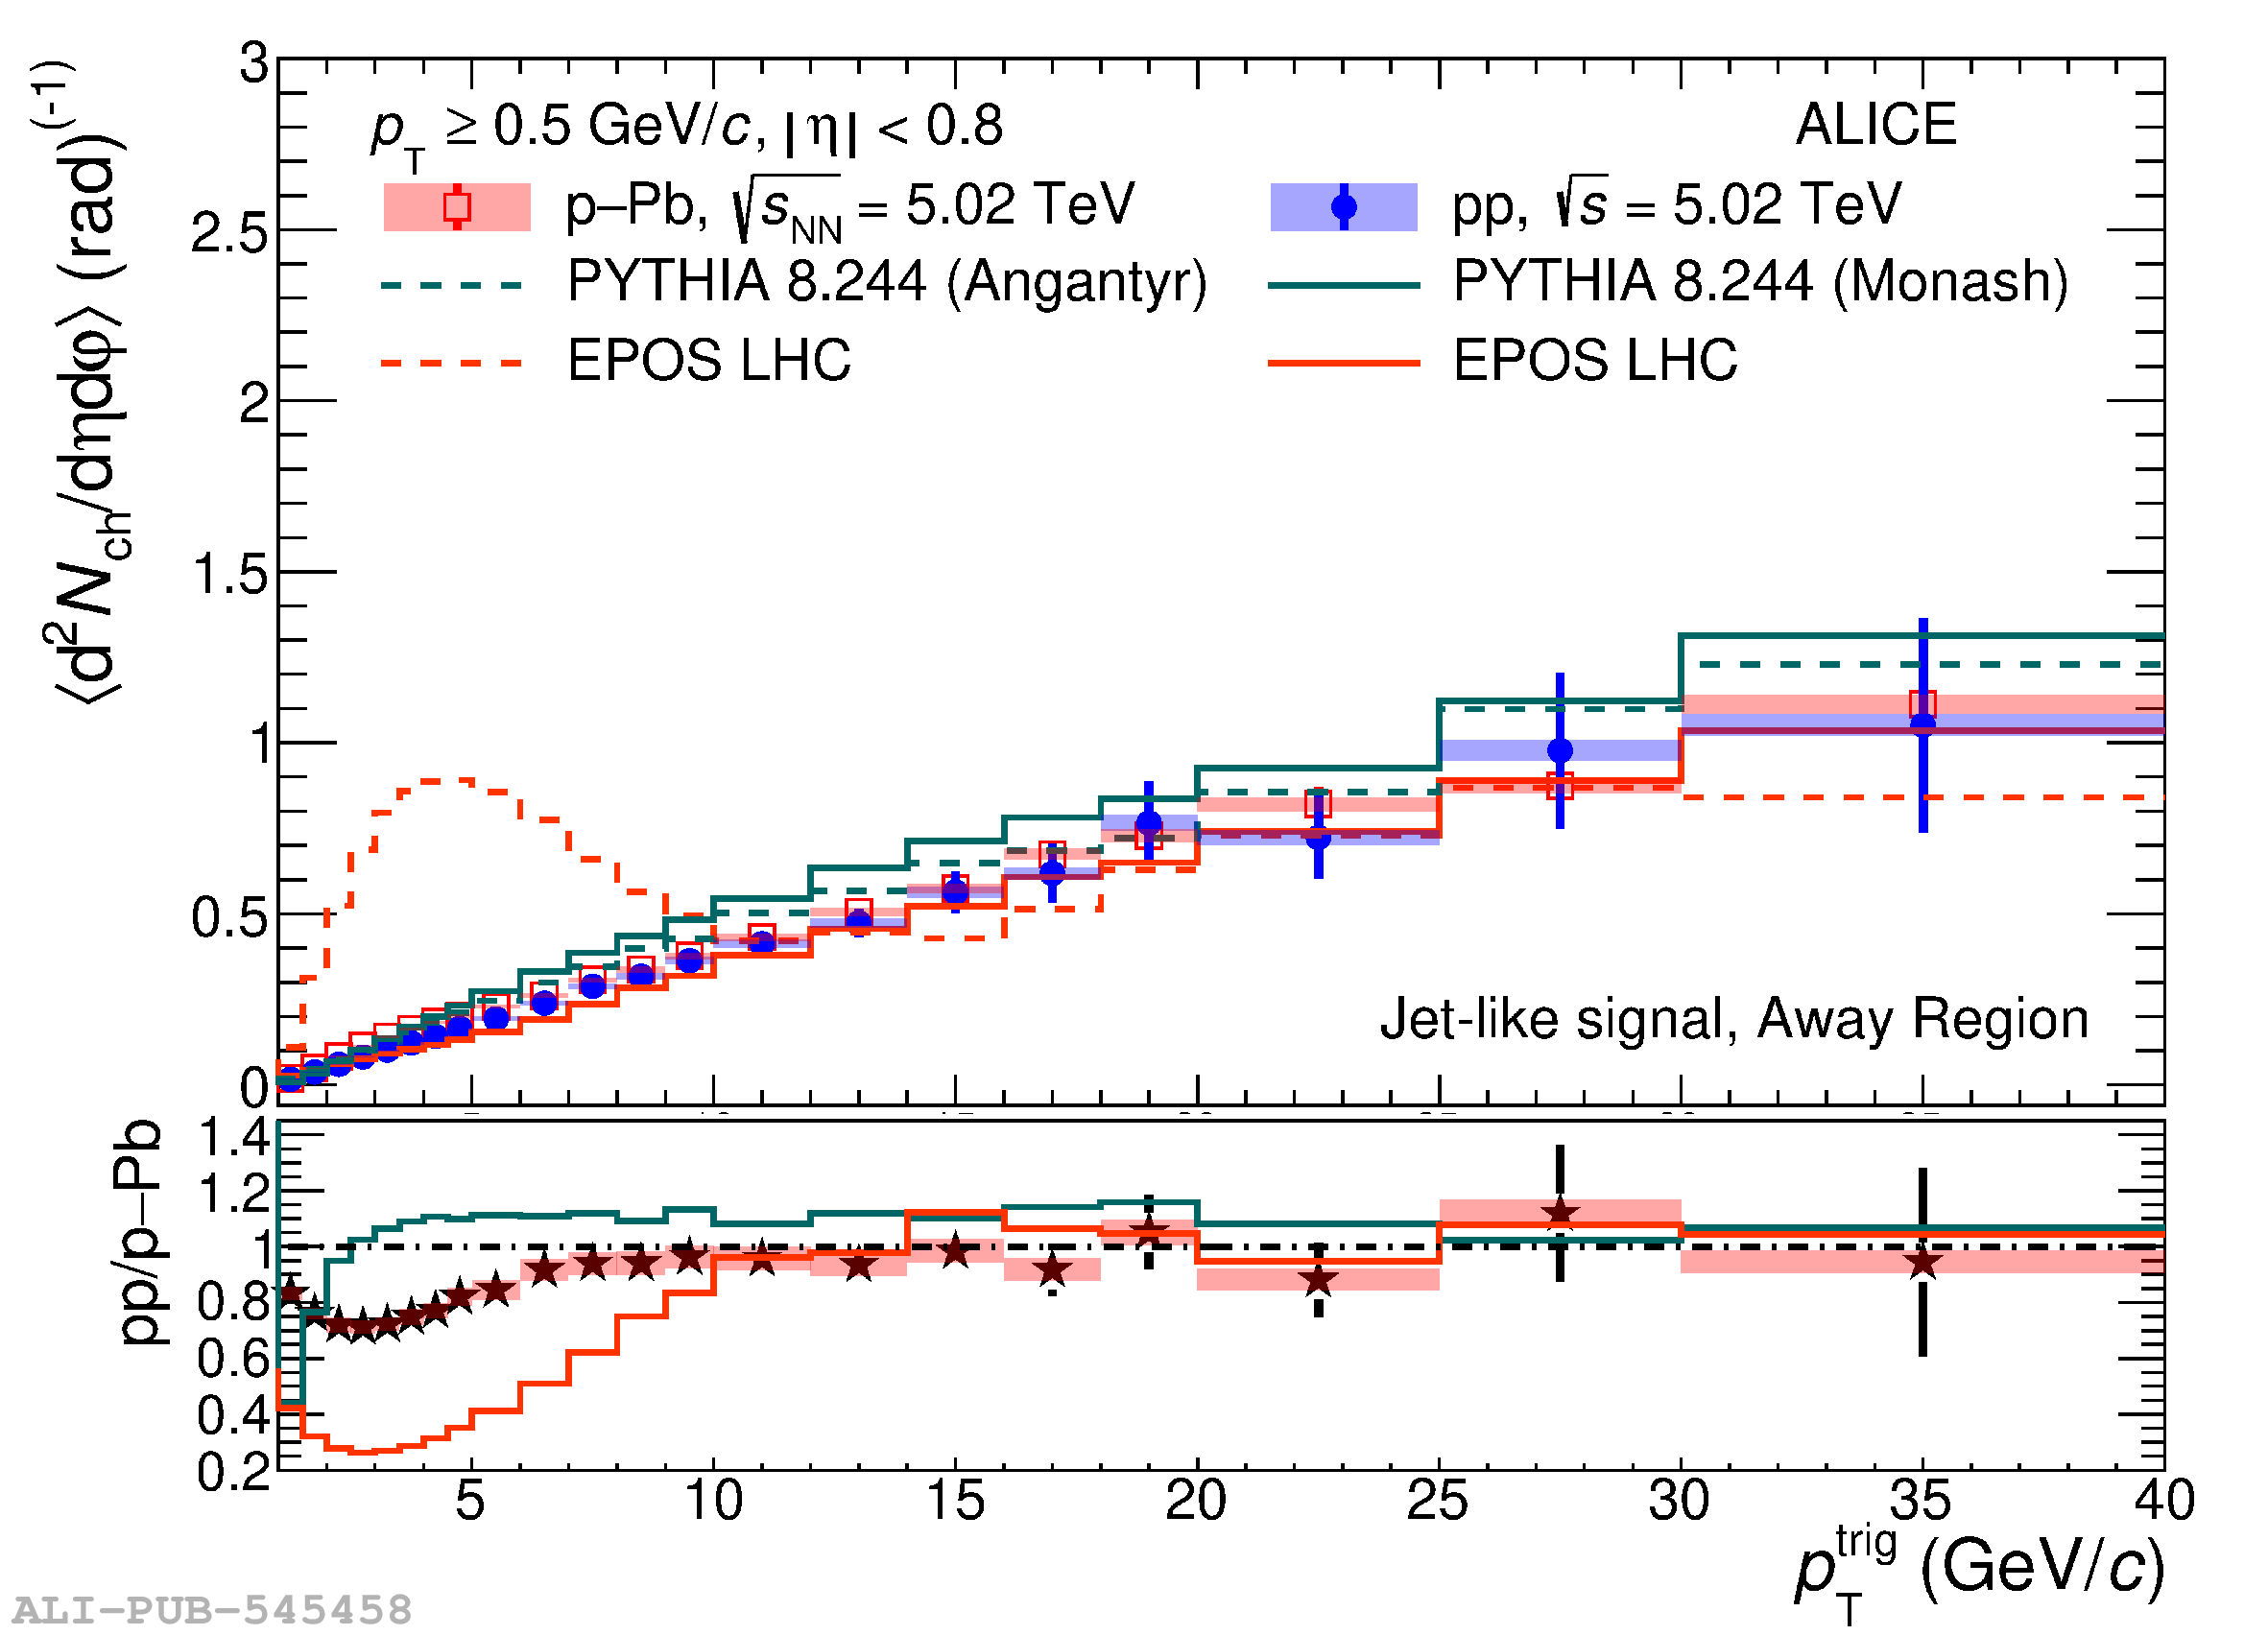 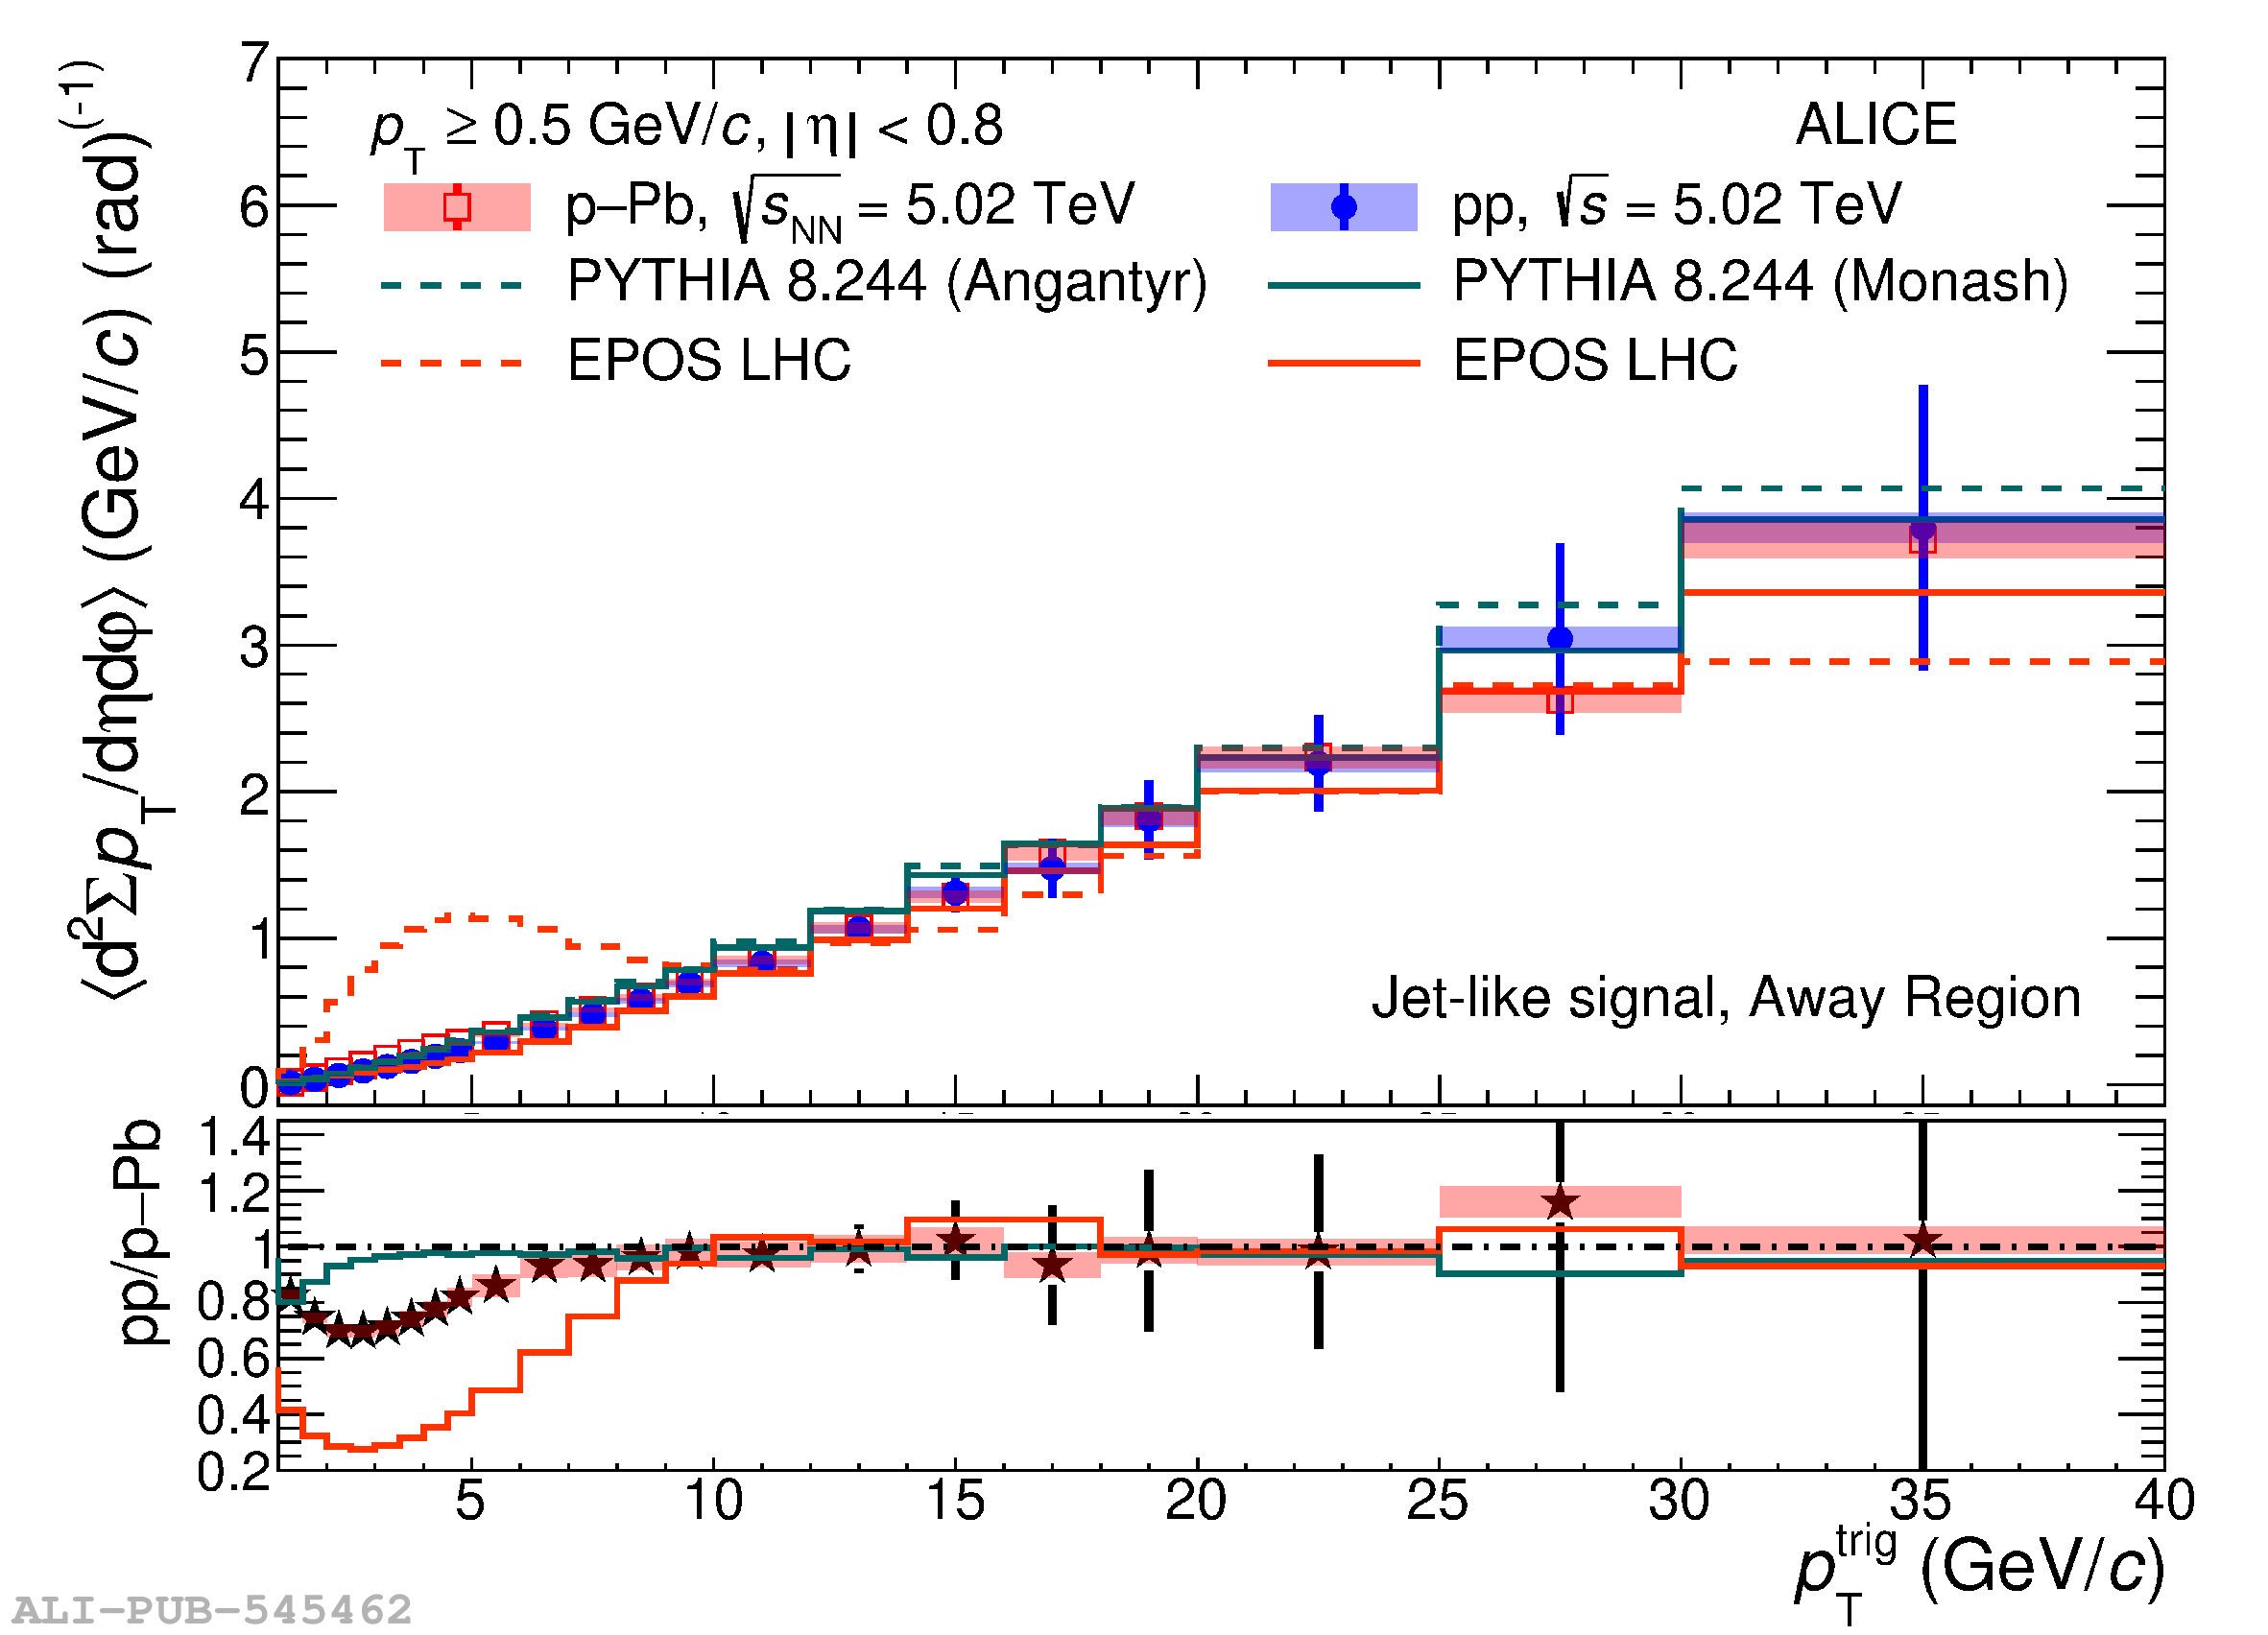 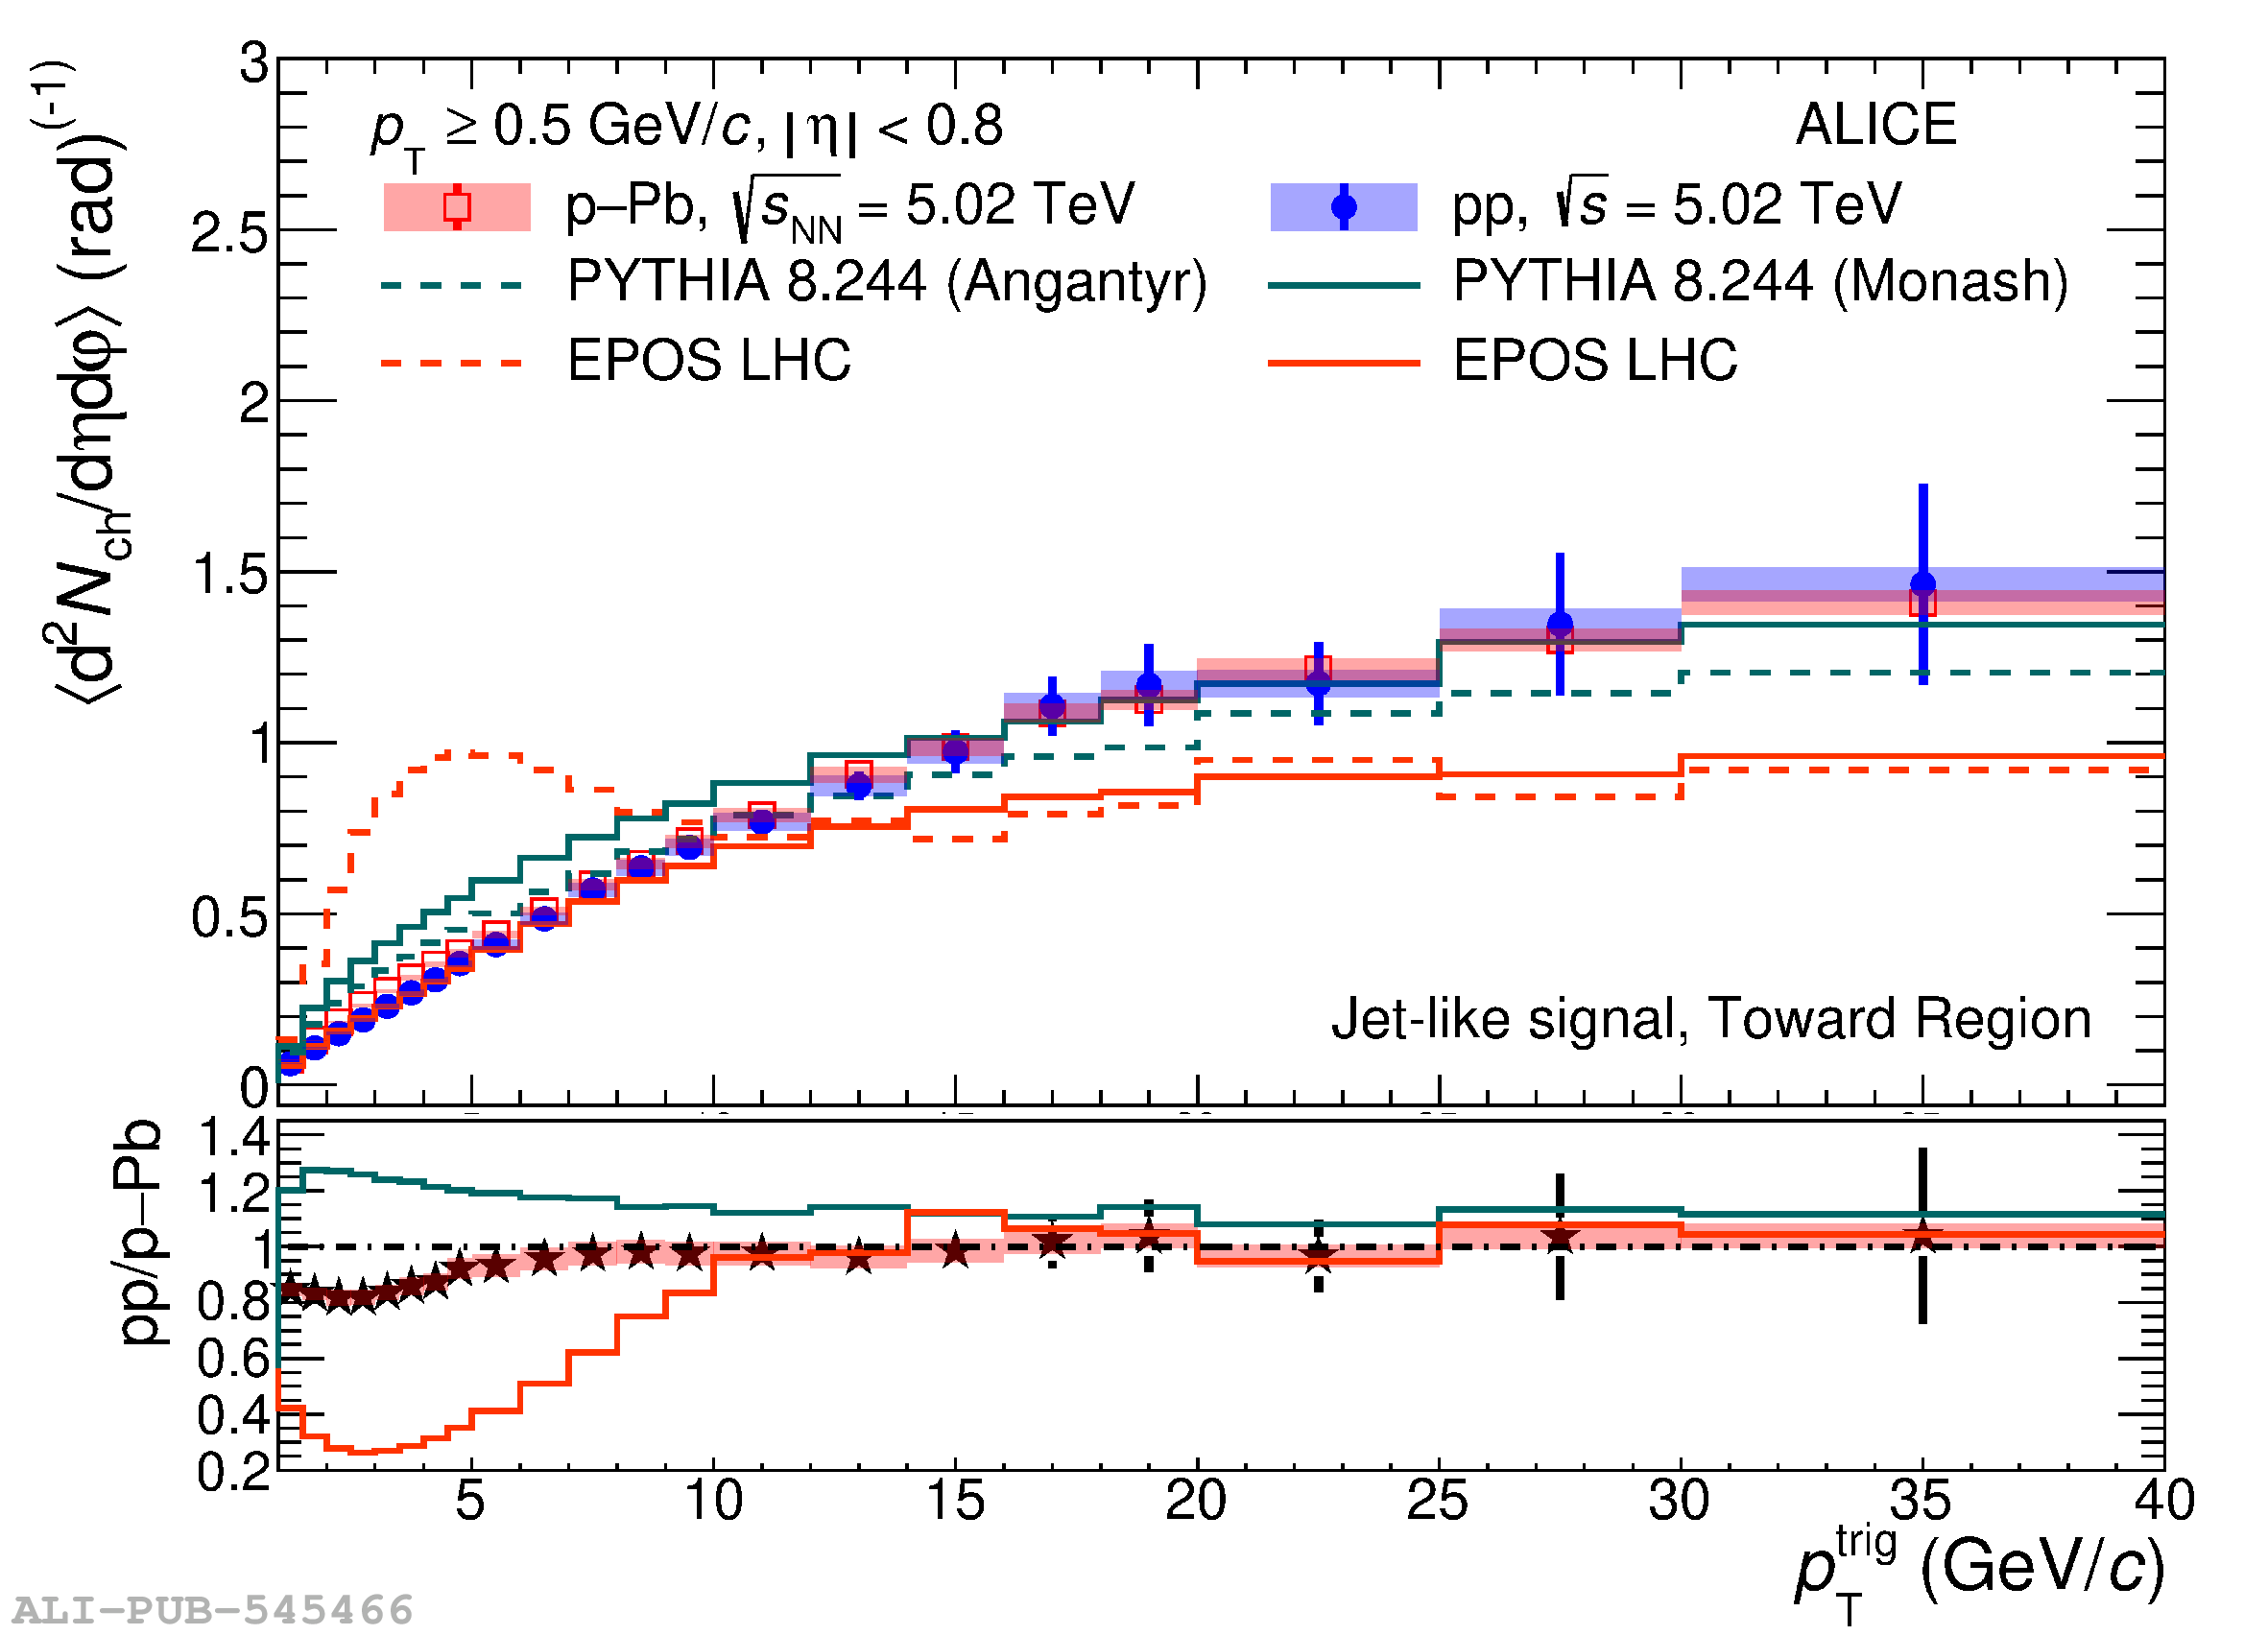 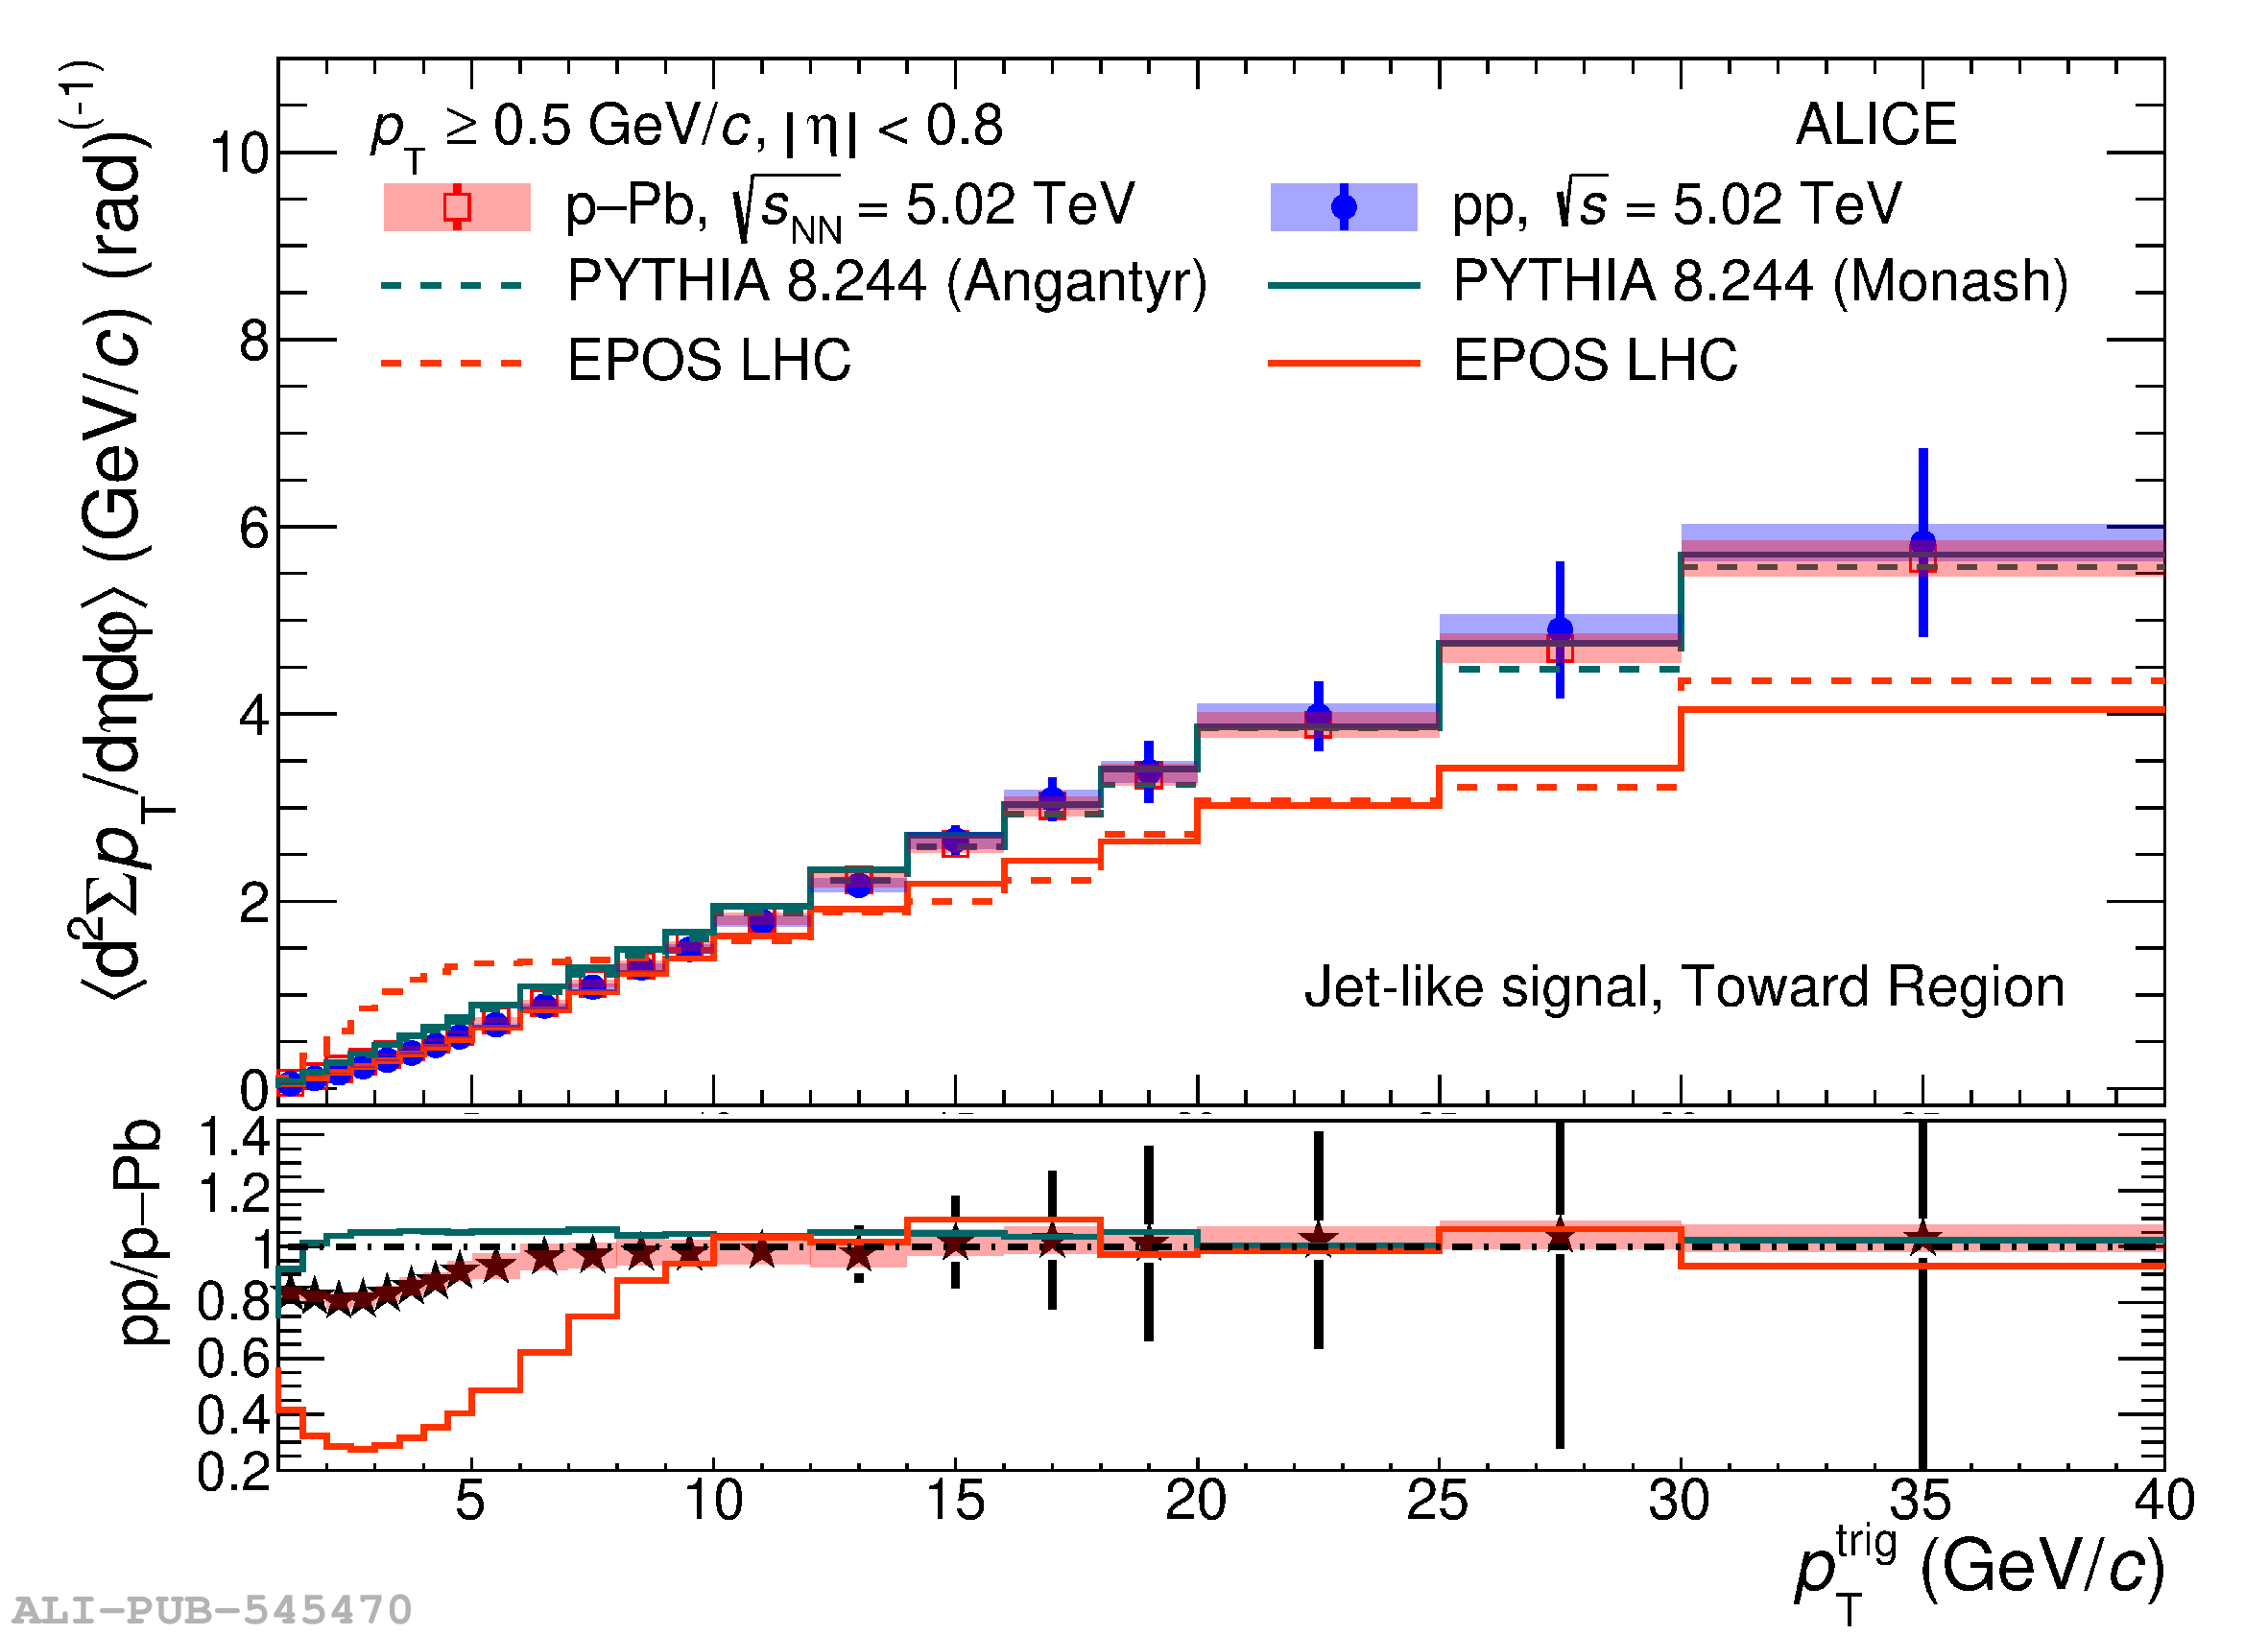 |
Figure 7
Upper: average transverse momentum as a function of $p_{\rm T}^{\rm trig}$ in the toward (left) and away (right) regions measured in pp and p-Pb collisions at $\sqrt{s_{\rm NN}}=5.02$ TeV. Results for data and comparison with models PYTHIA 8 (green) and EPOS LHC (red) predictions are shown. Bottom: average transverse momentum measured in pp collisions divided by that measured in p-Pb collisions. A similar ratio is shown for model predictions. |  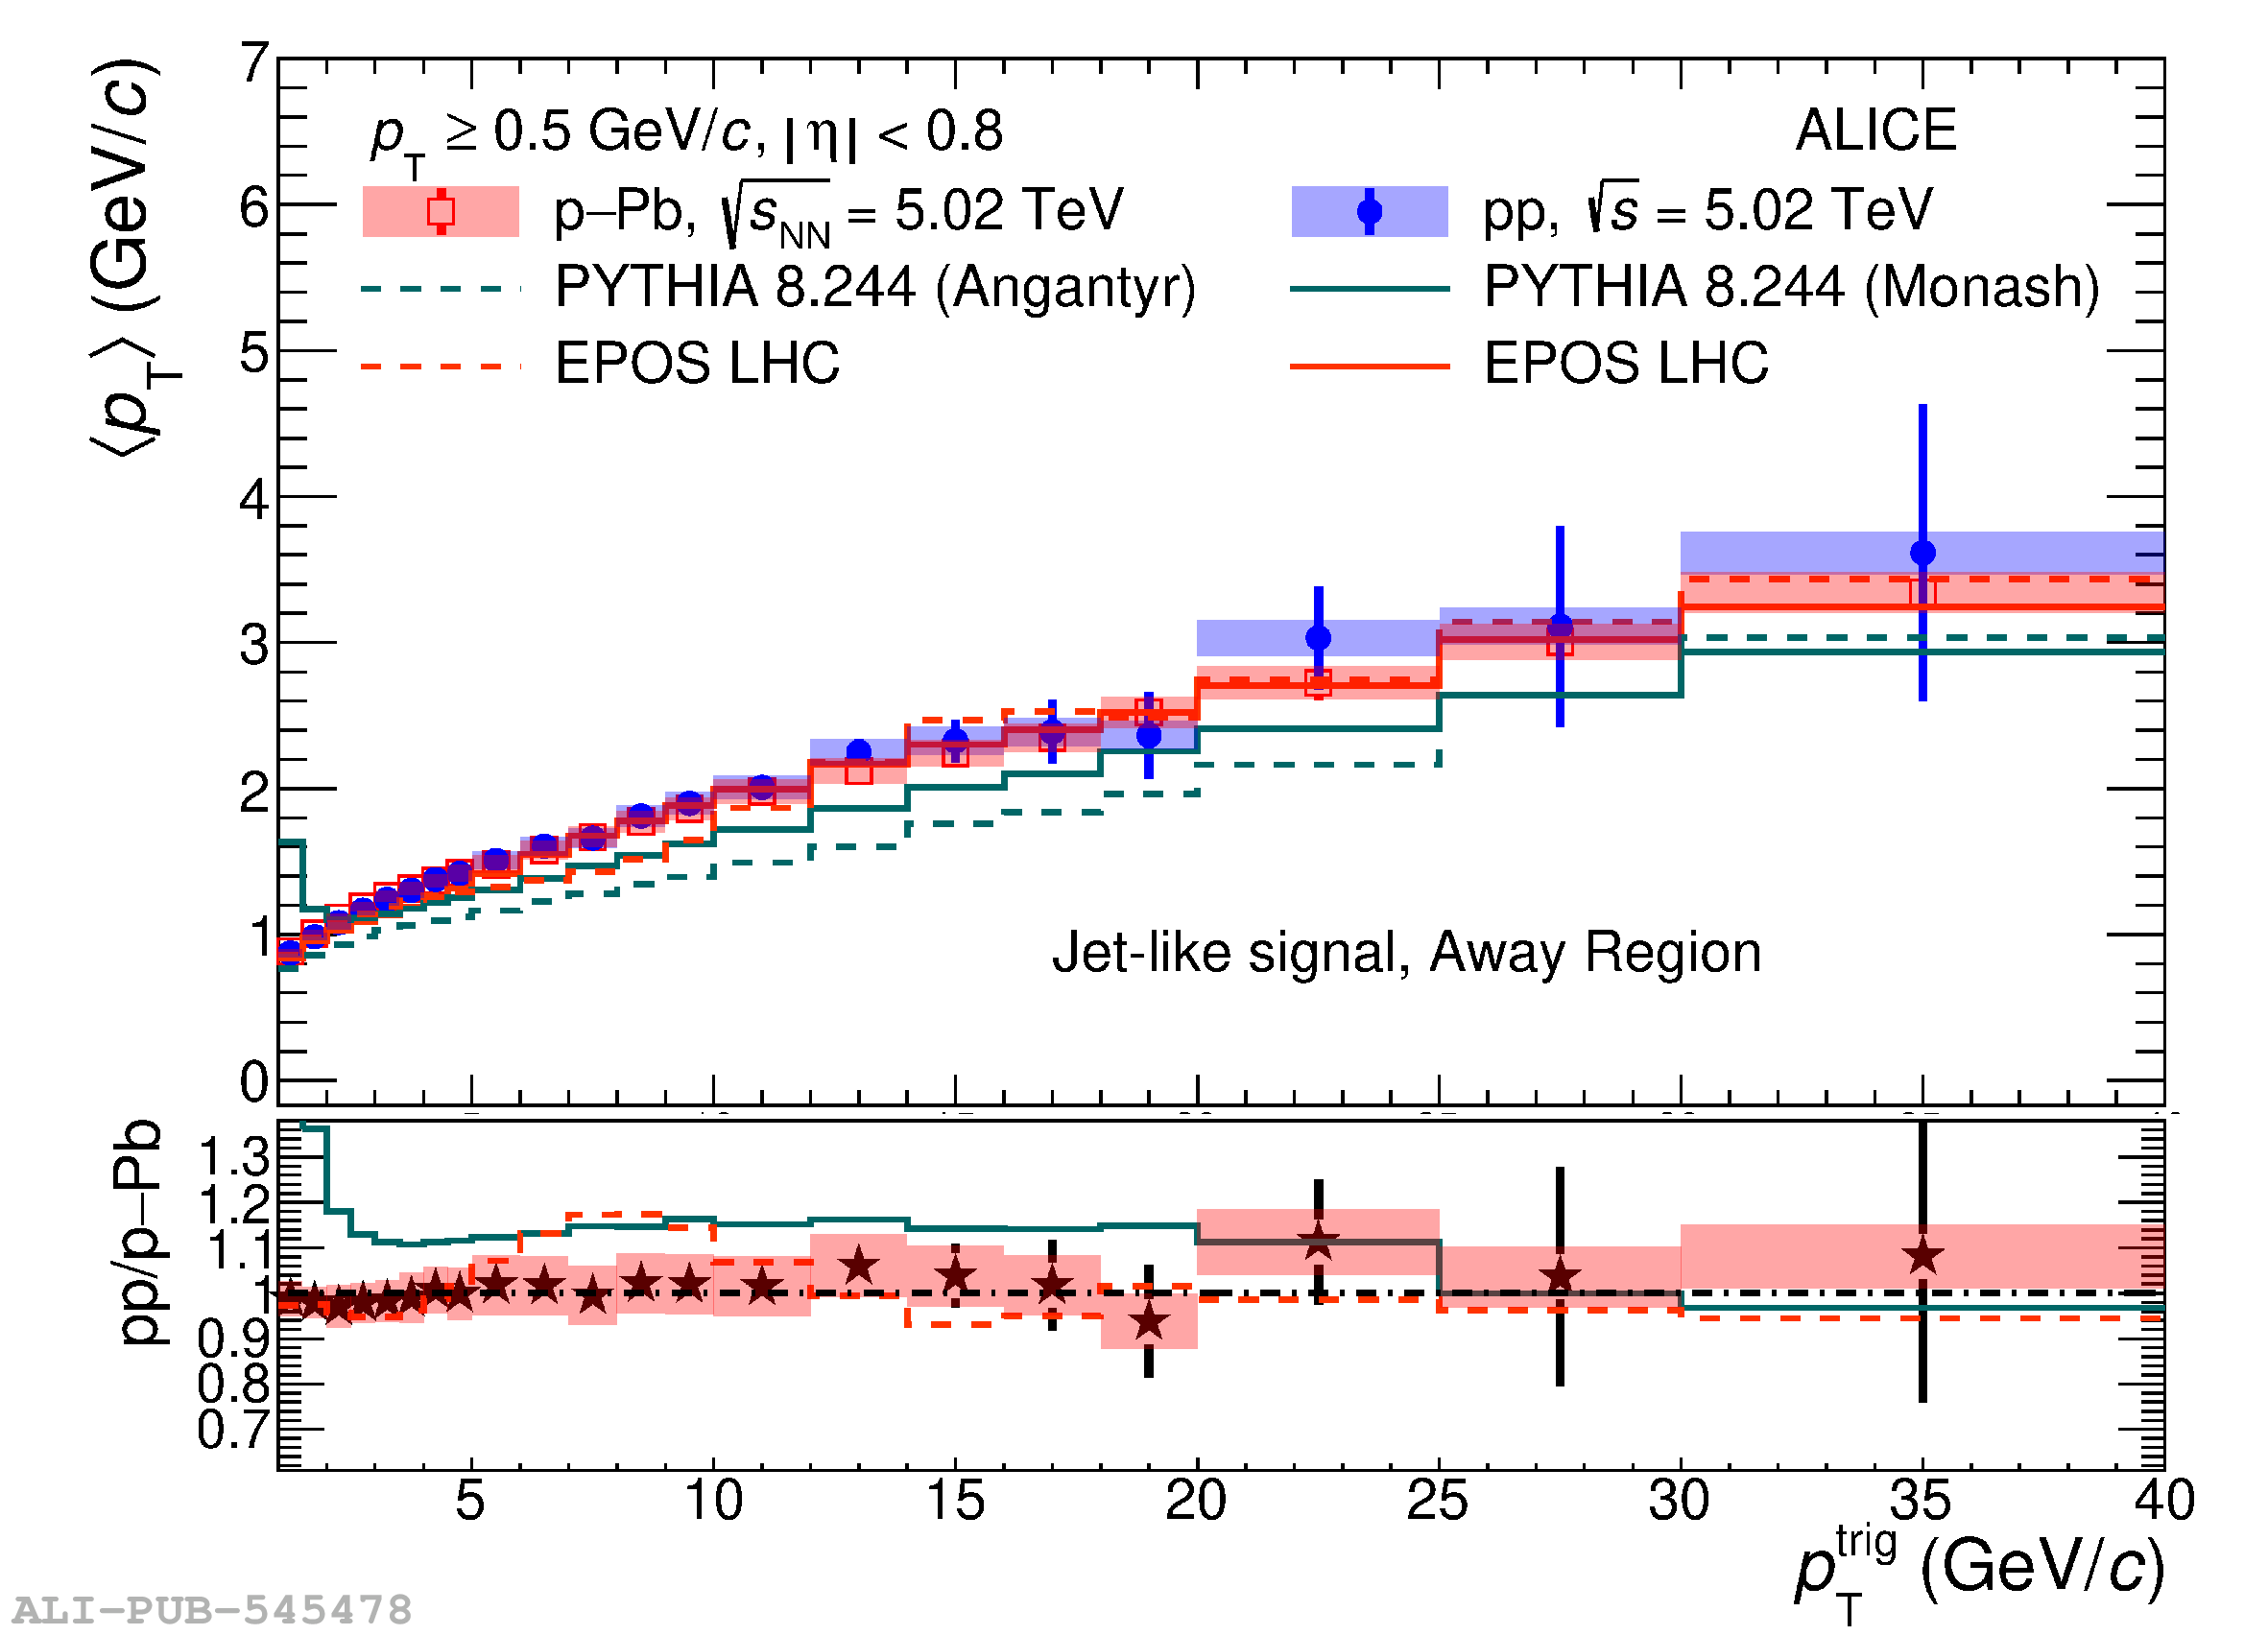 |
Figure 8
Left: charged-particle number density in the transverse region as a function of $p_{\rm T}^{\rm trig}$ for pp collisions at $\sqrt{s}$ = 0.9, 5.02, 7, and 13TeV. A constant function (solid lines) is used to fit the data in the range $5 < p_{\rm T}^{\rm trig} < 10$ GeV/$c$. Right: number densities scaled by the plateau values obtained from the fit to compare the shapes. The coloured boxes represent the systematic uncertainties, and vertical error bars indicate statistical uncertainties. | 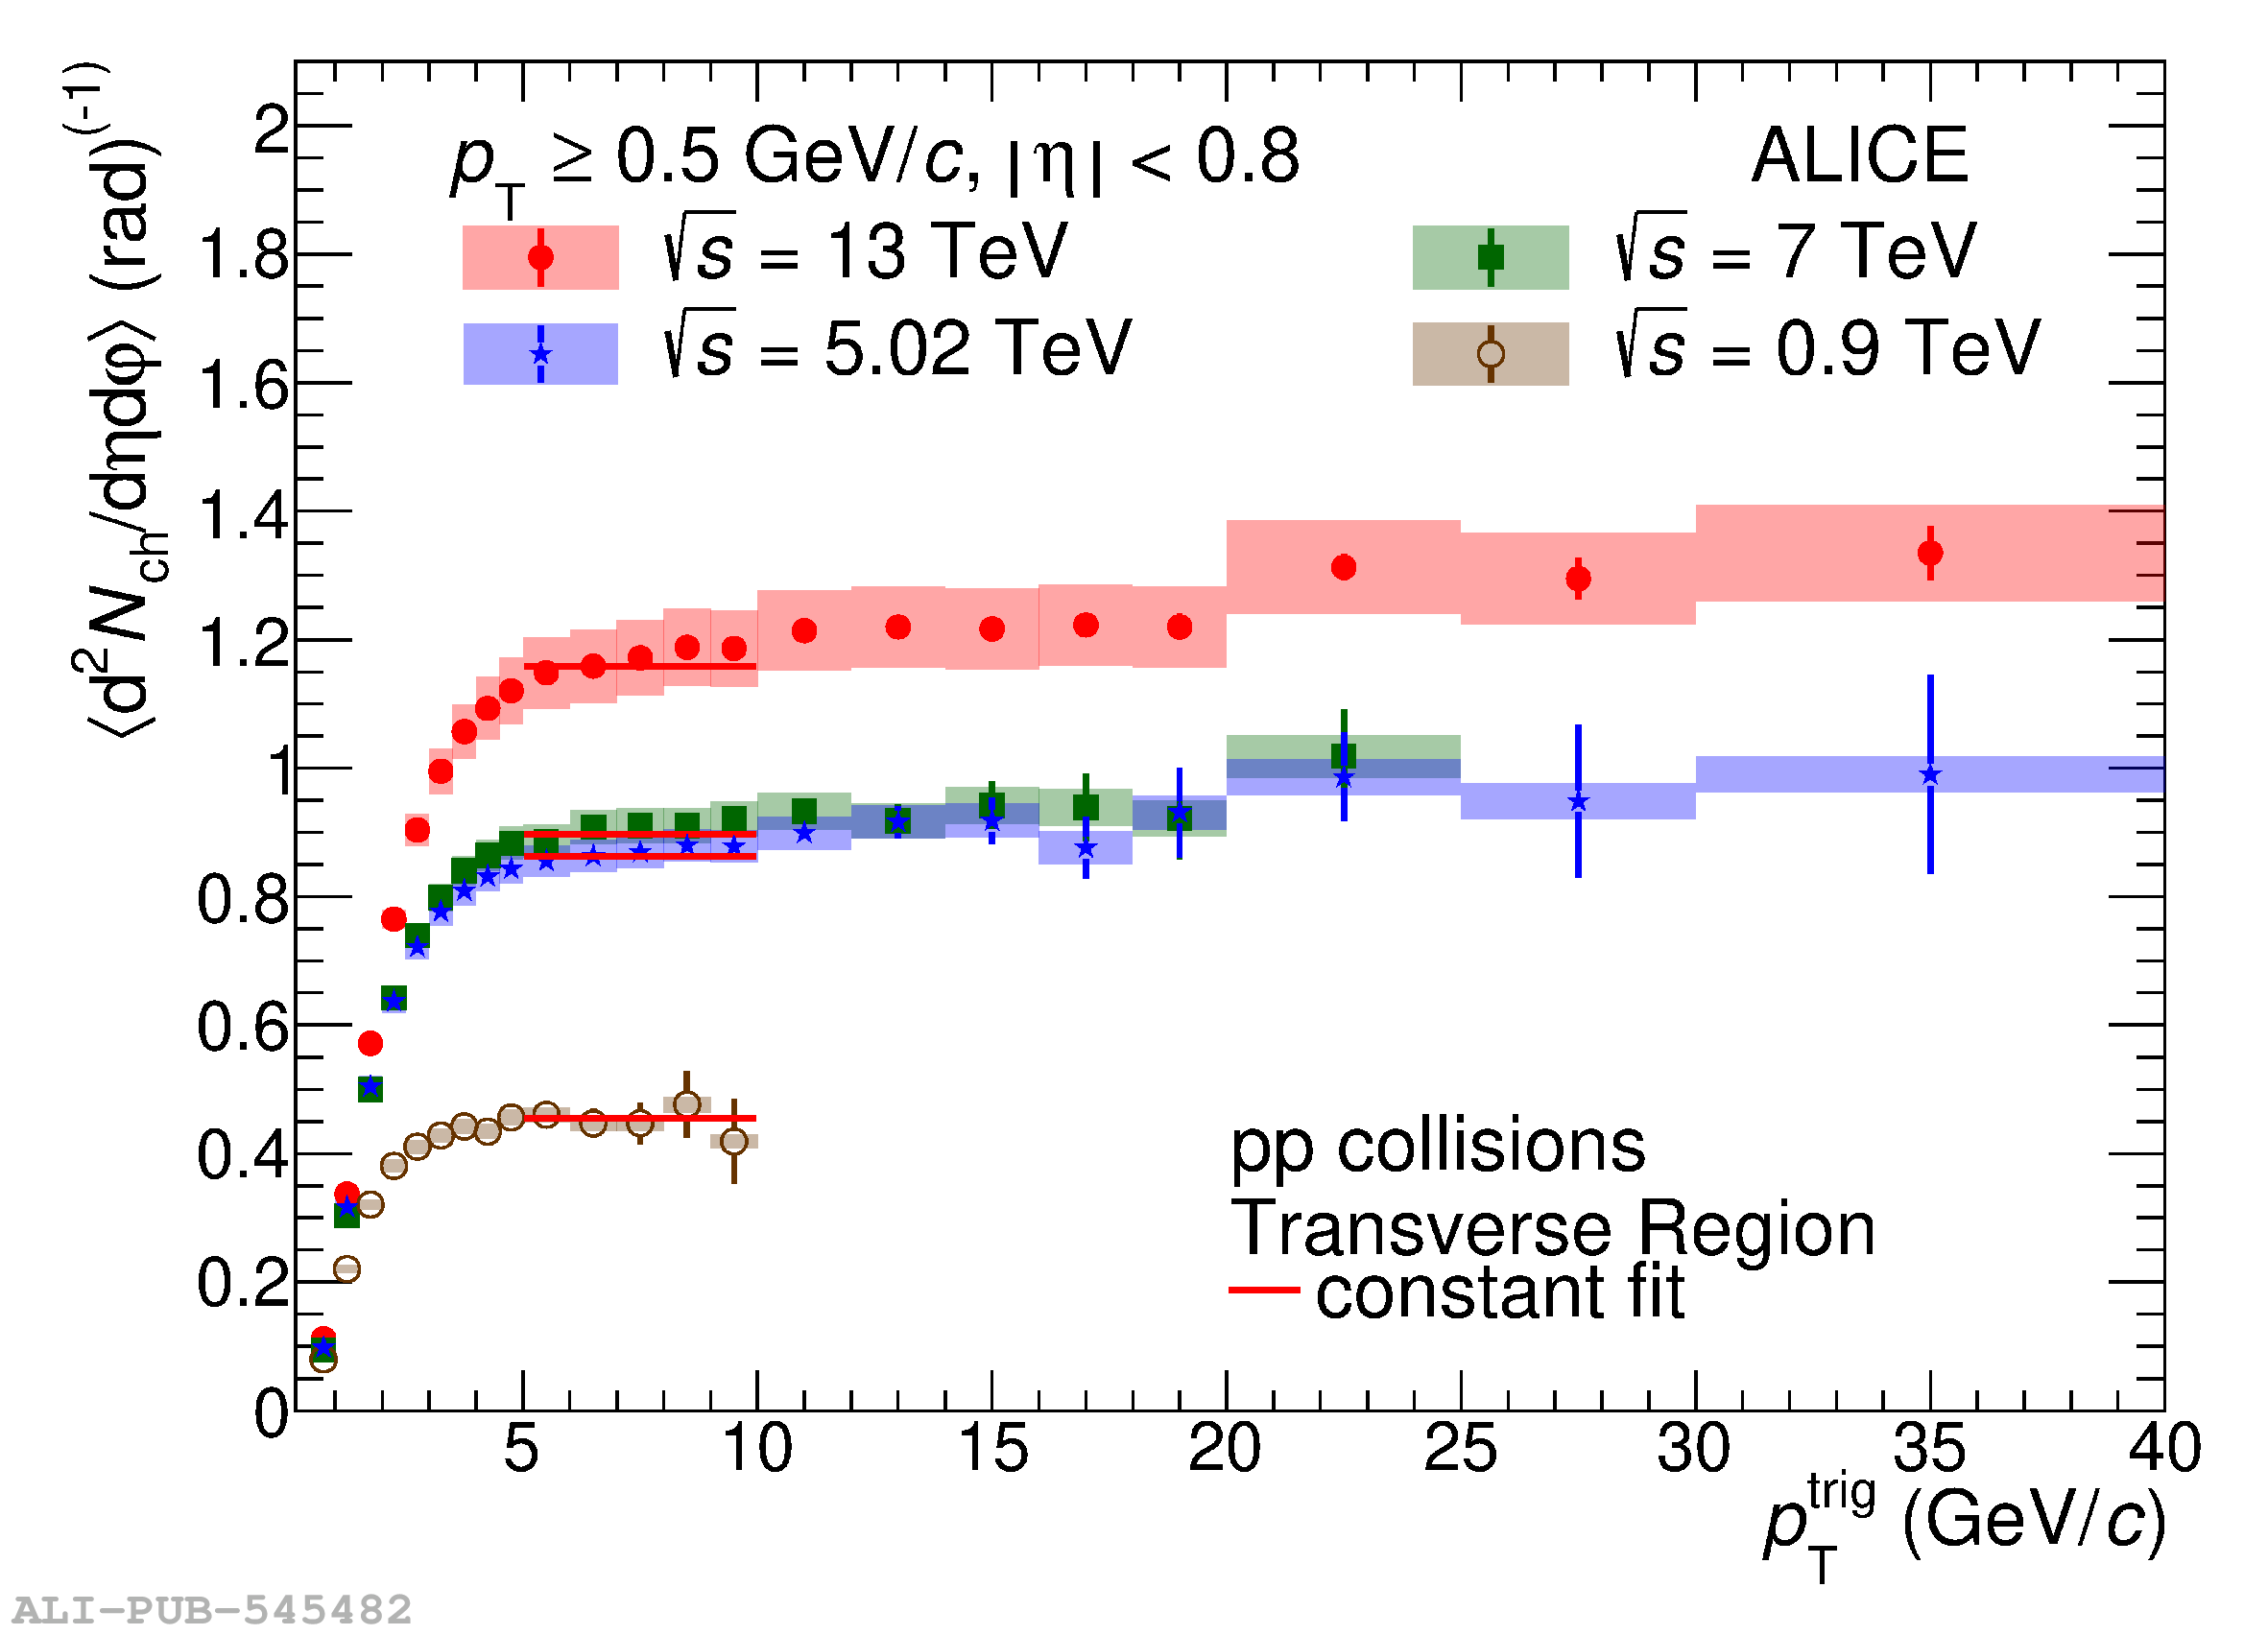 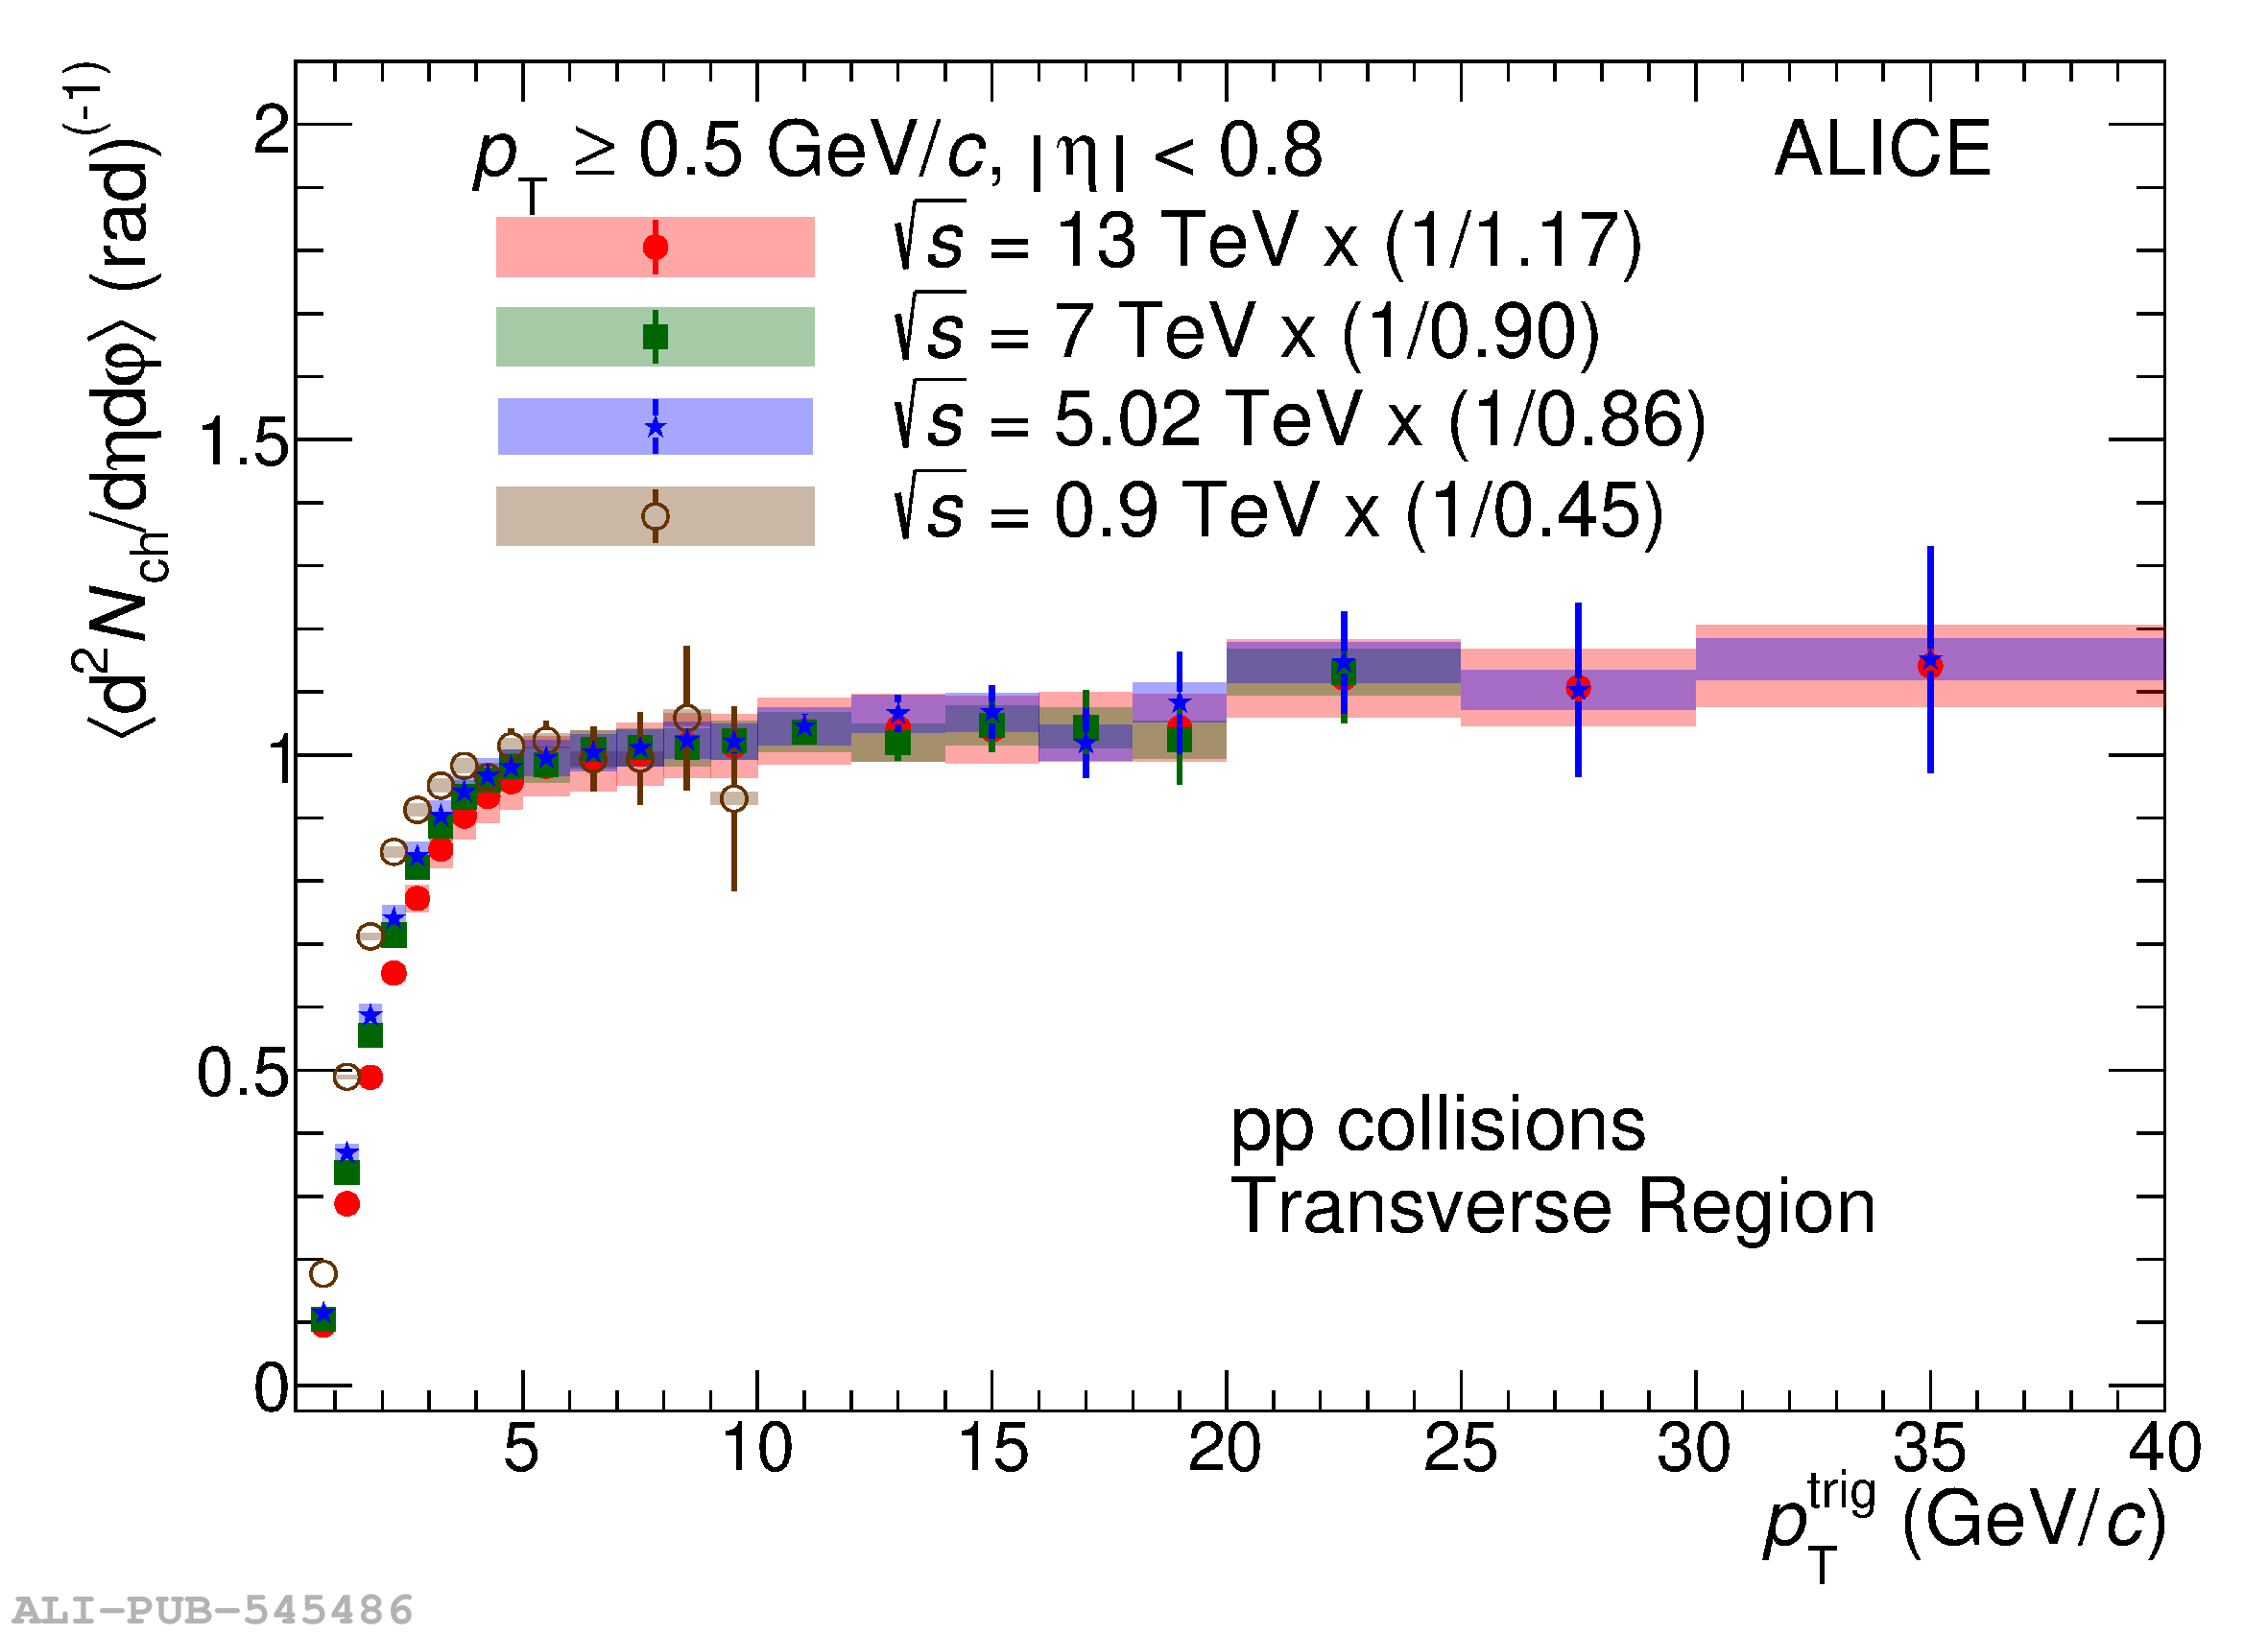 |
Figure 9
Centre-of-mass energy dependence of the high $p_{\rm T}^{\rm trig}$ plateau value of the charged-particle number density in the transverse region. The ATLAS, CDF, CMS and STAR data points were taken from the compilation reported by the STAR collaboration. Error bars represent statistical and systematic uncertainties summed in quadrature. The data are compared with a parametrisation of the form $s^{0.27}+0.14\log(s)$ . | 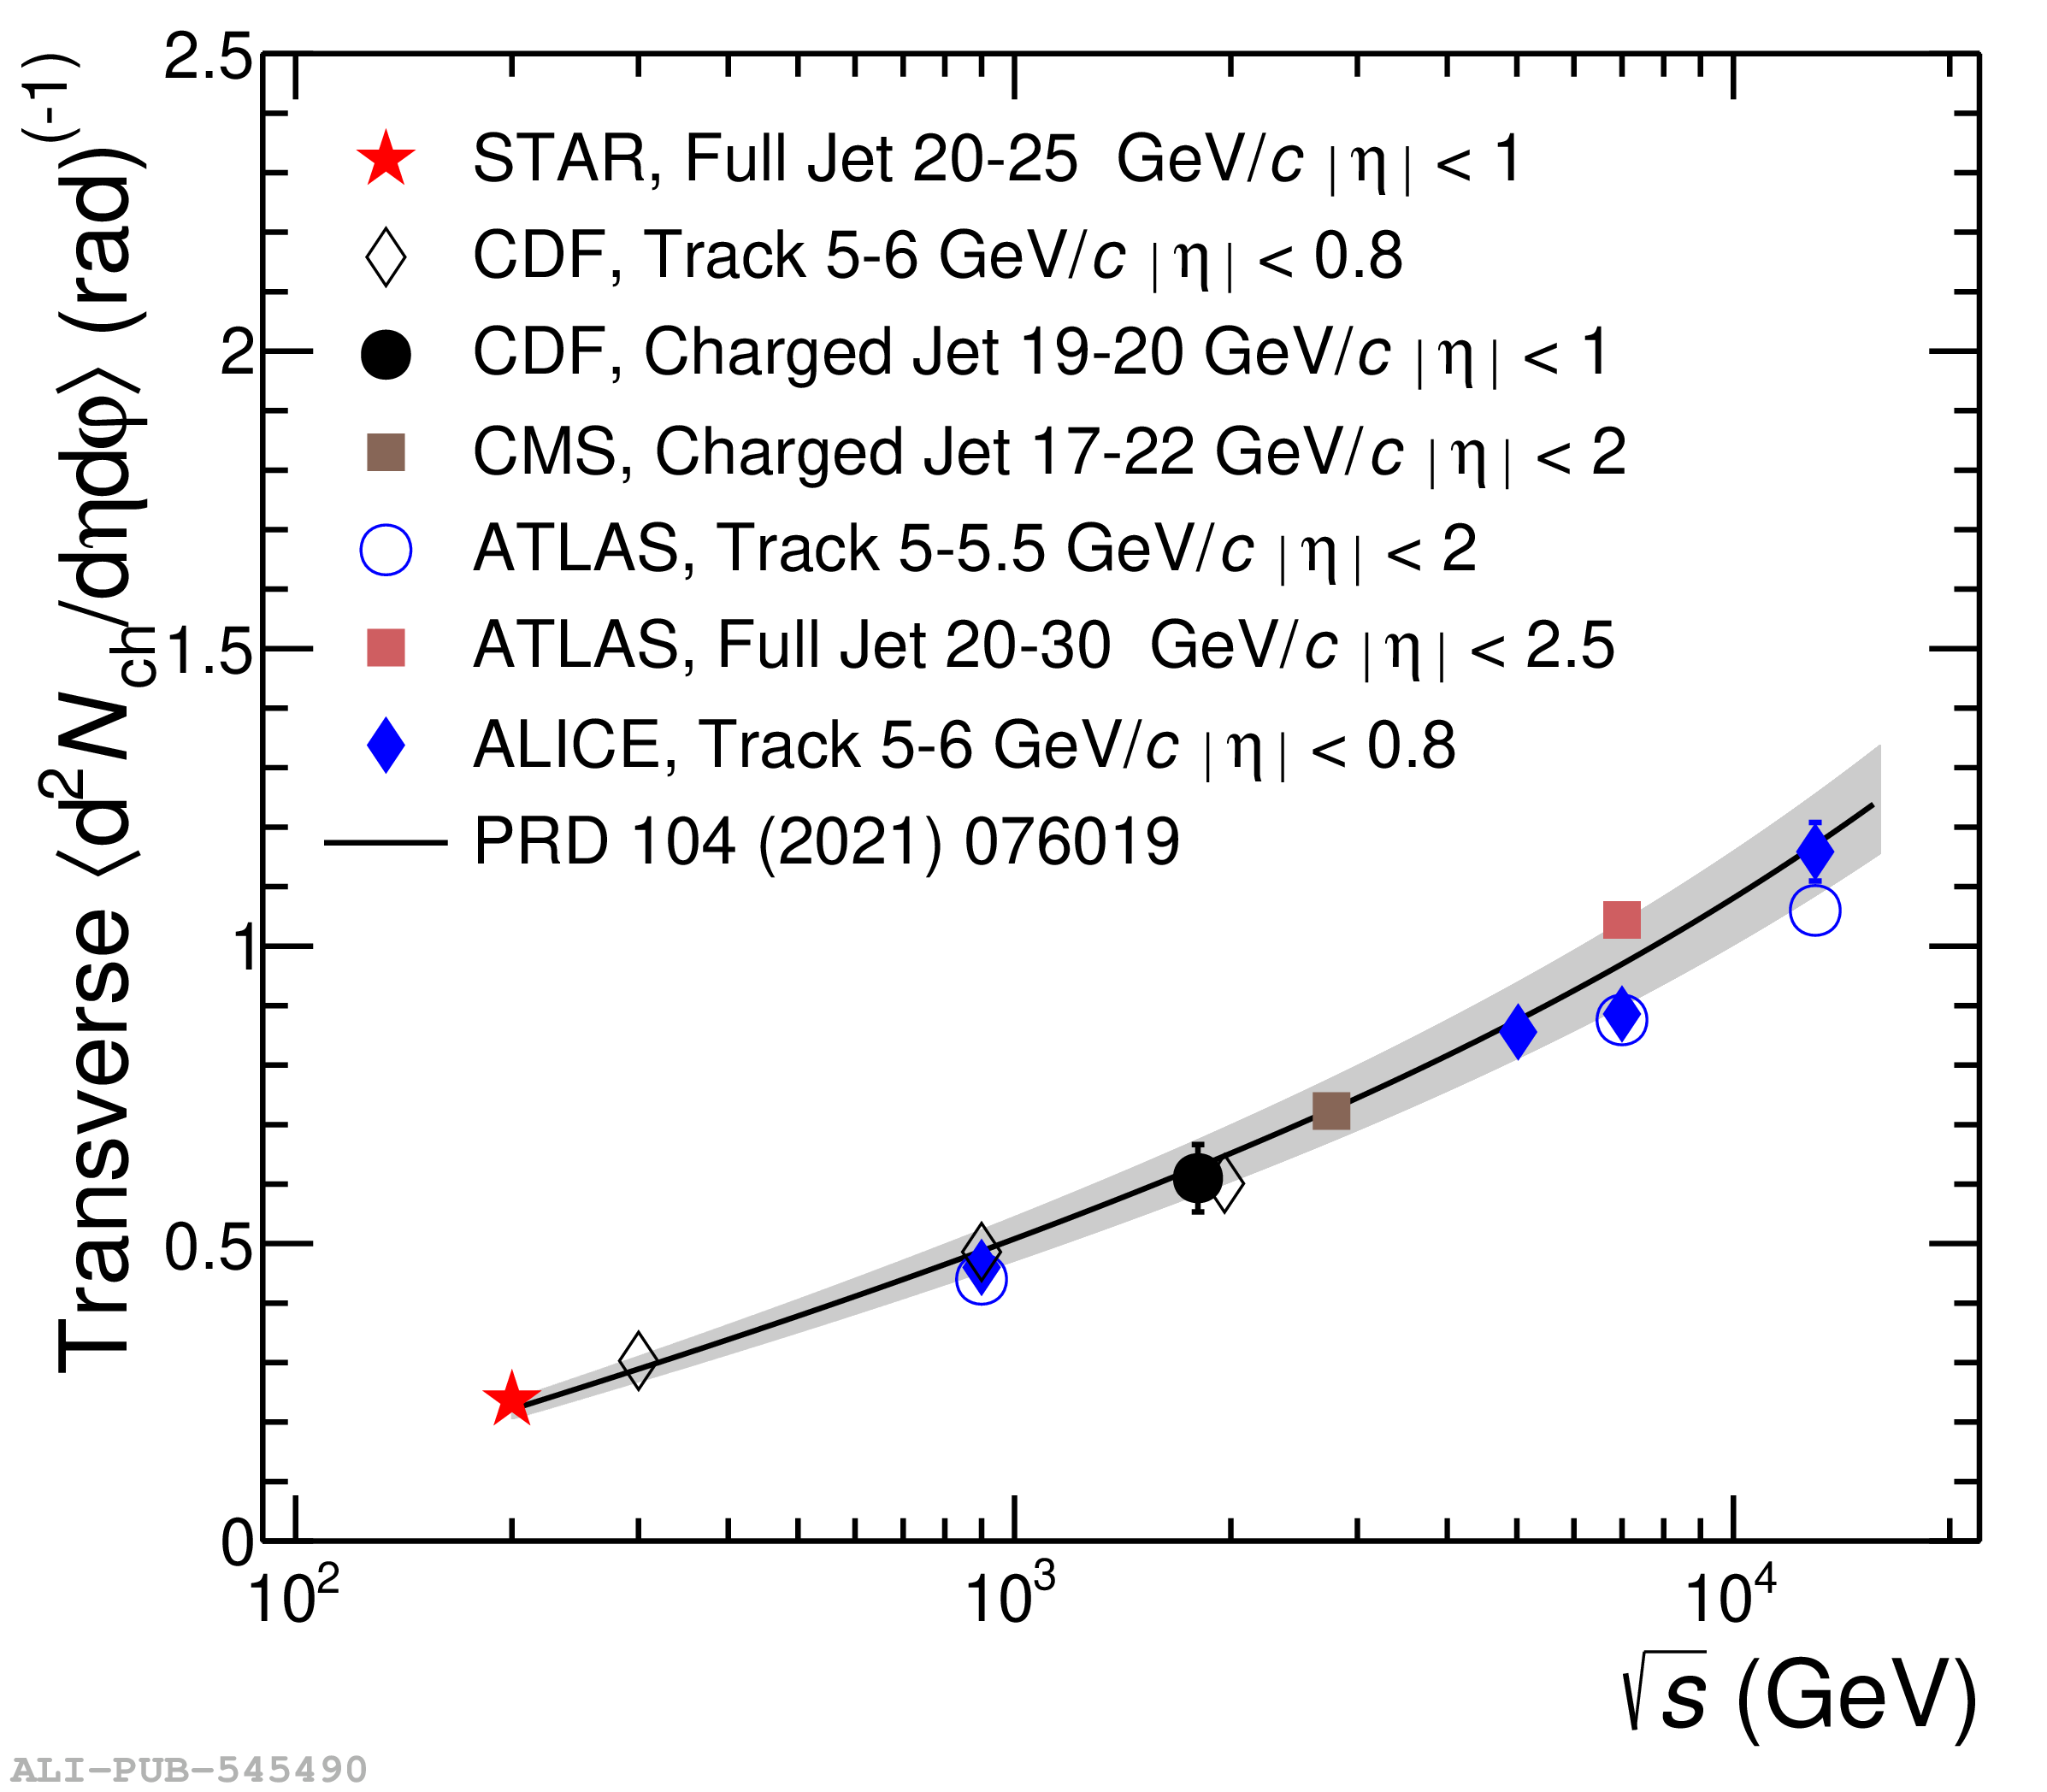 |
Figure A.1
The charged-particle number (left) and summed-$p_{\rm T}$ (right) densities as a function of $p_{\rm T}^{\rm trig}$ in pp collision at $\sqrt{s}=5.02$ TeV are displayed. Results for the transverse (top), away (middle), and toward (bottom) regions were obtained for the transverse momentum threshold $\pt>0.15$ GeV/$c$. The shaded area and the error bars around the data points represent the systematic and statistical uncertainties, respectively. Data are compared with PYTHIA 8/Monash (solid line) and EPOS LHC (dashed line) predictions. The data-to-model ratios are displayed in the bottom panel of each plot. The boxes around unity represent the statistical and systematic uncertainties added in quadrature. | 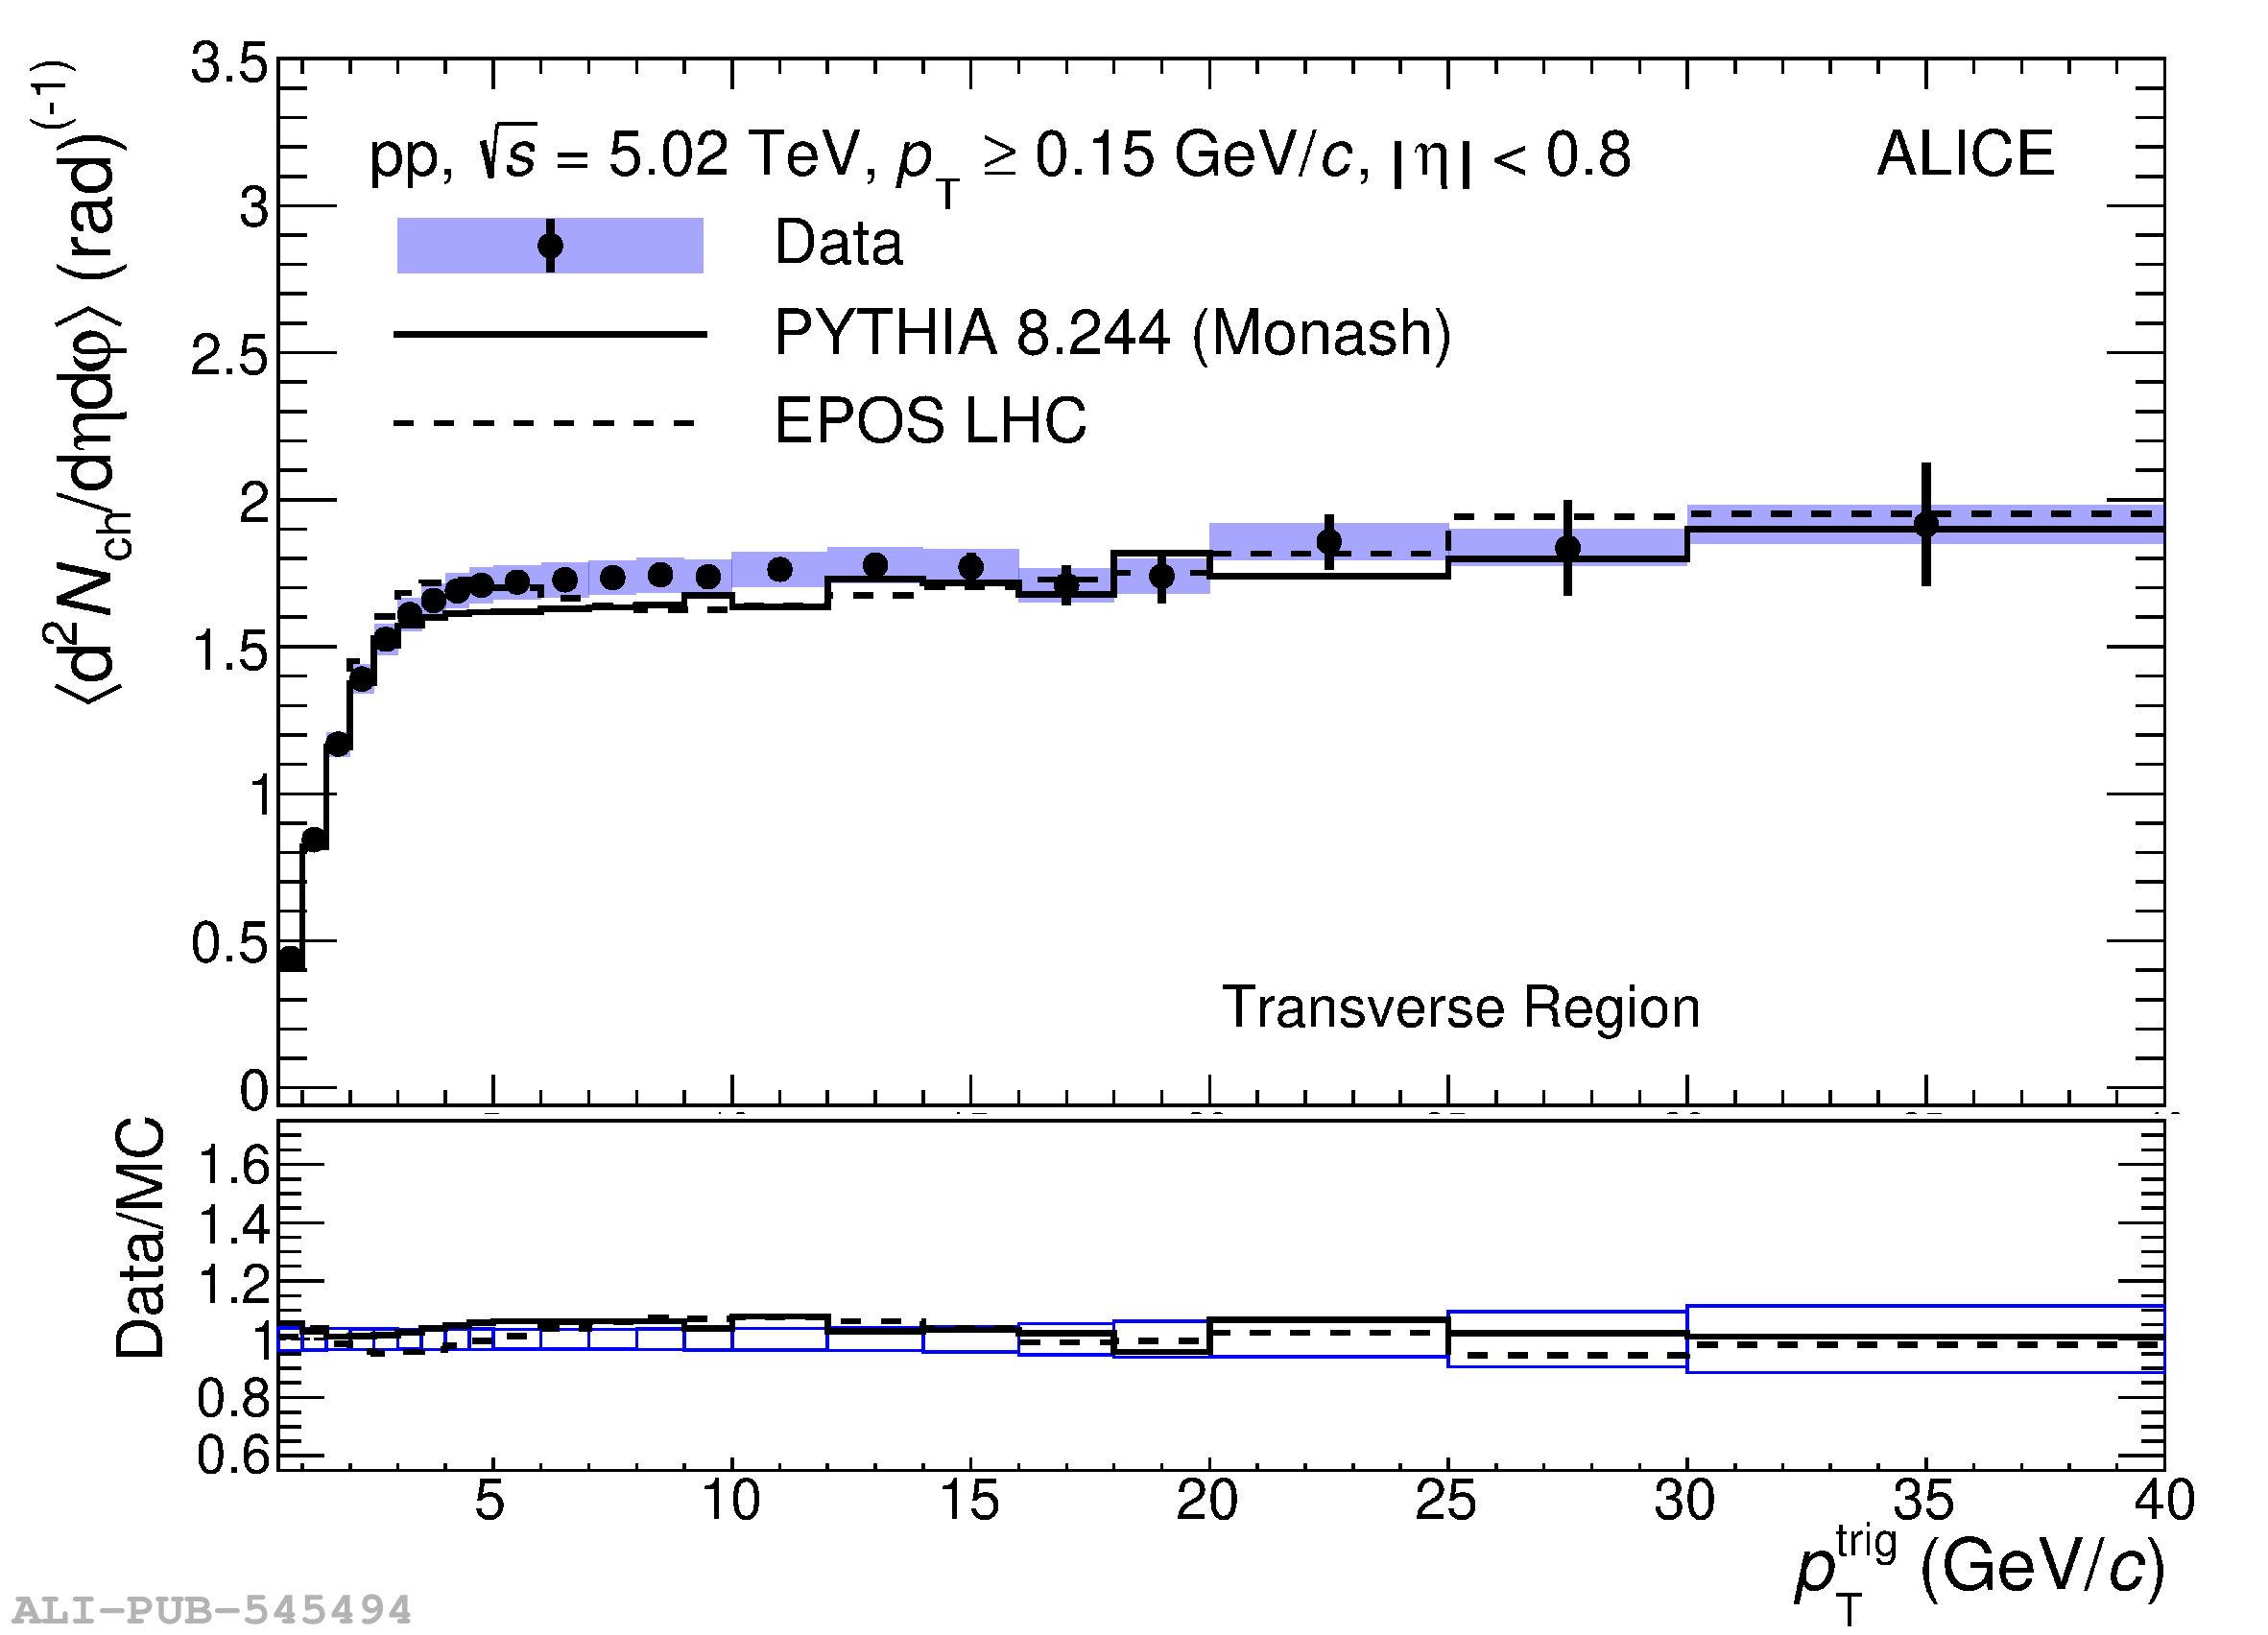 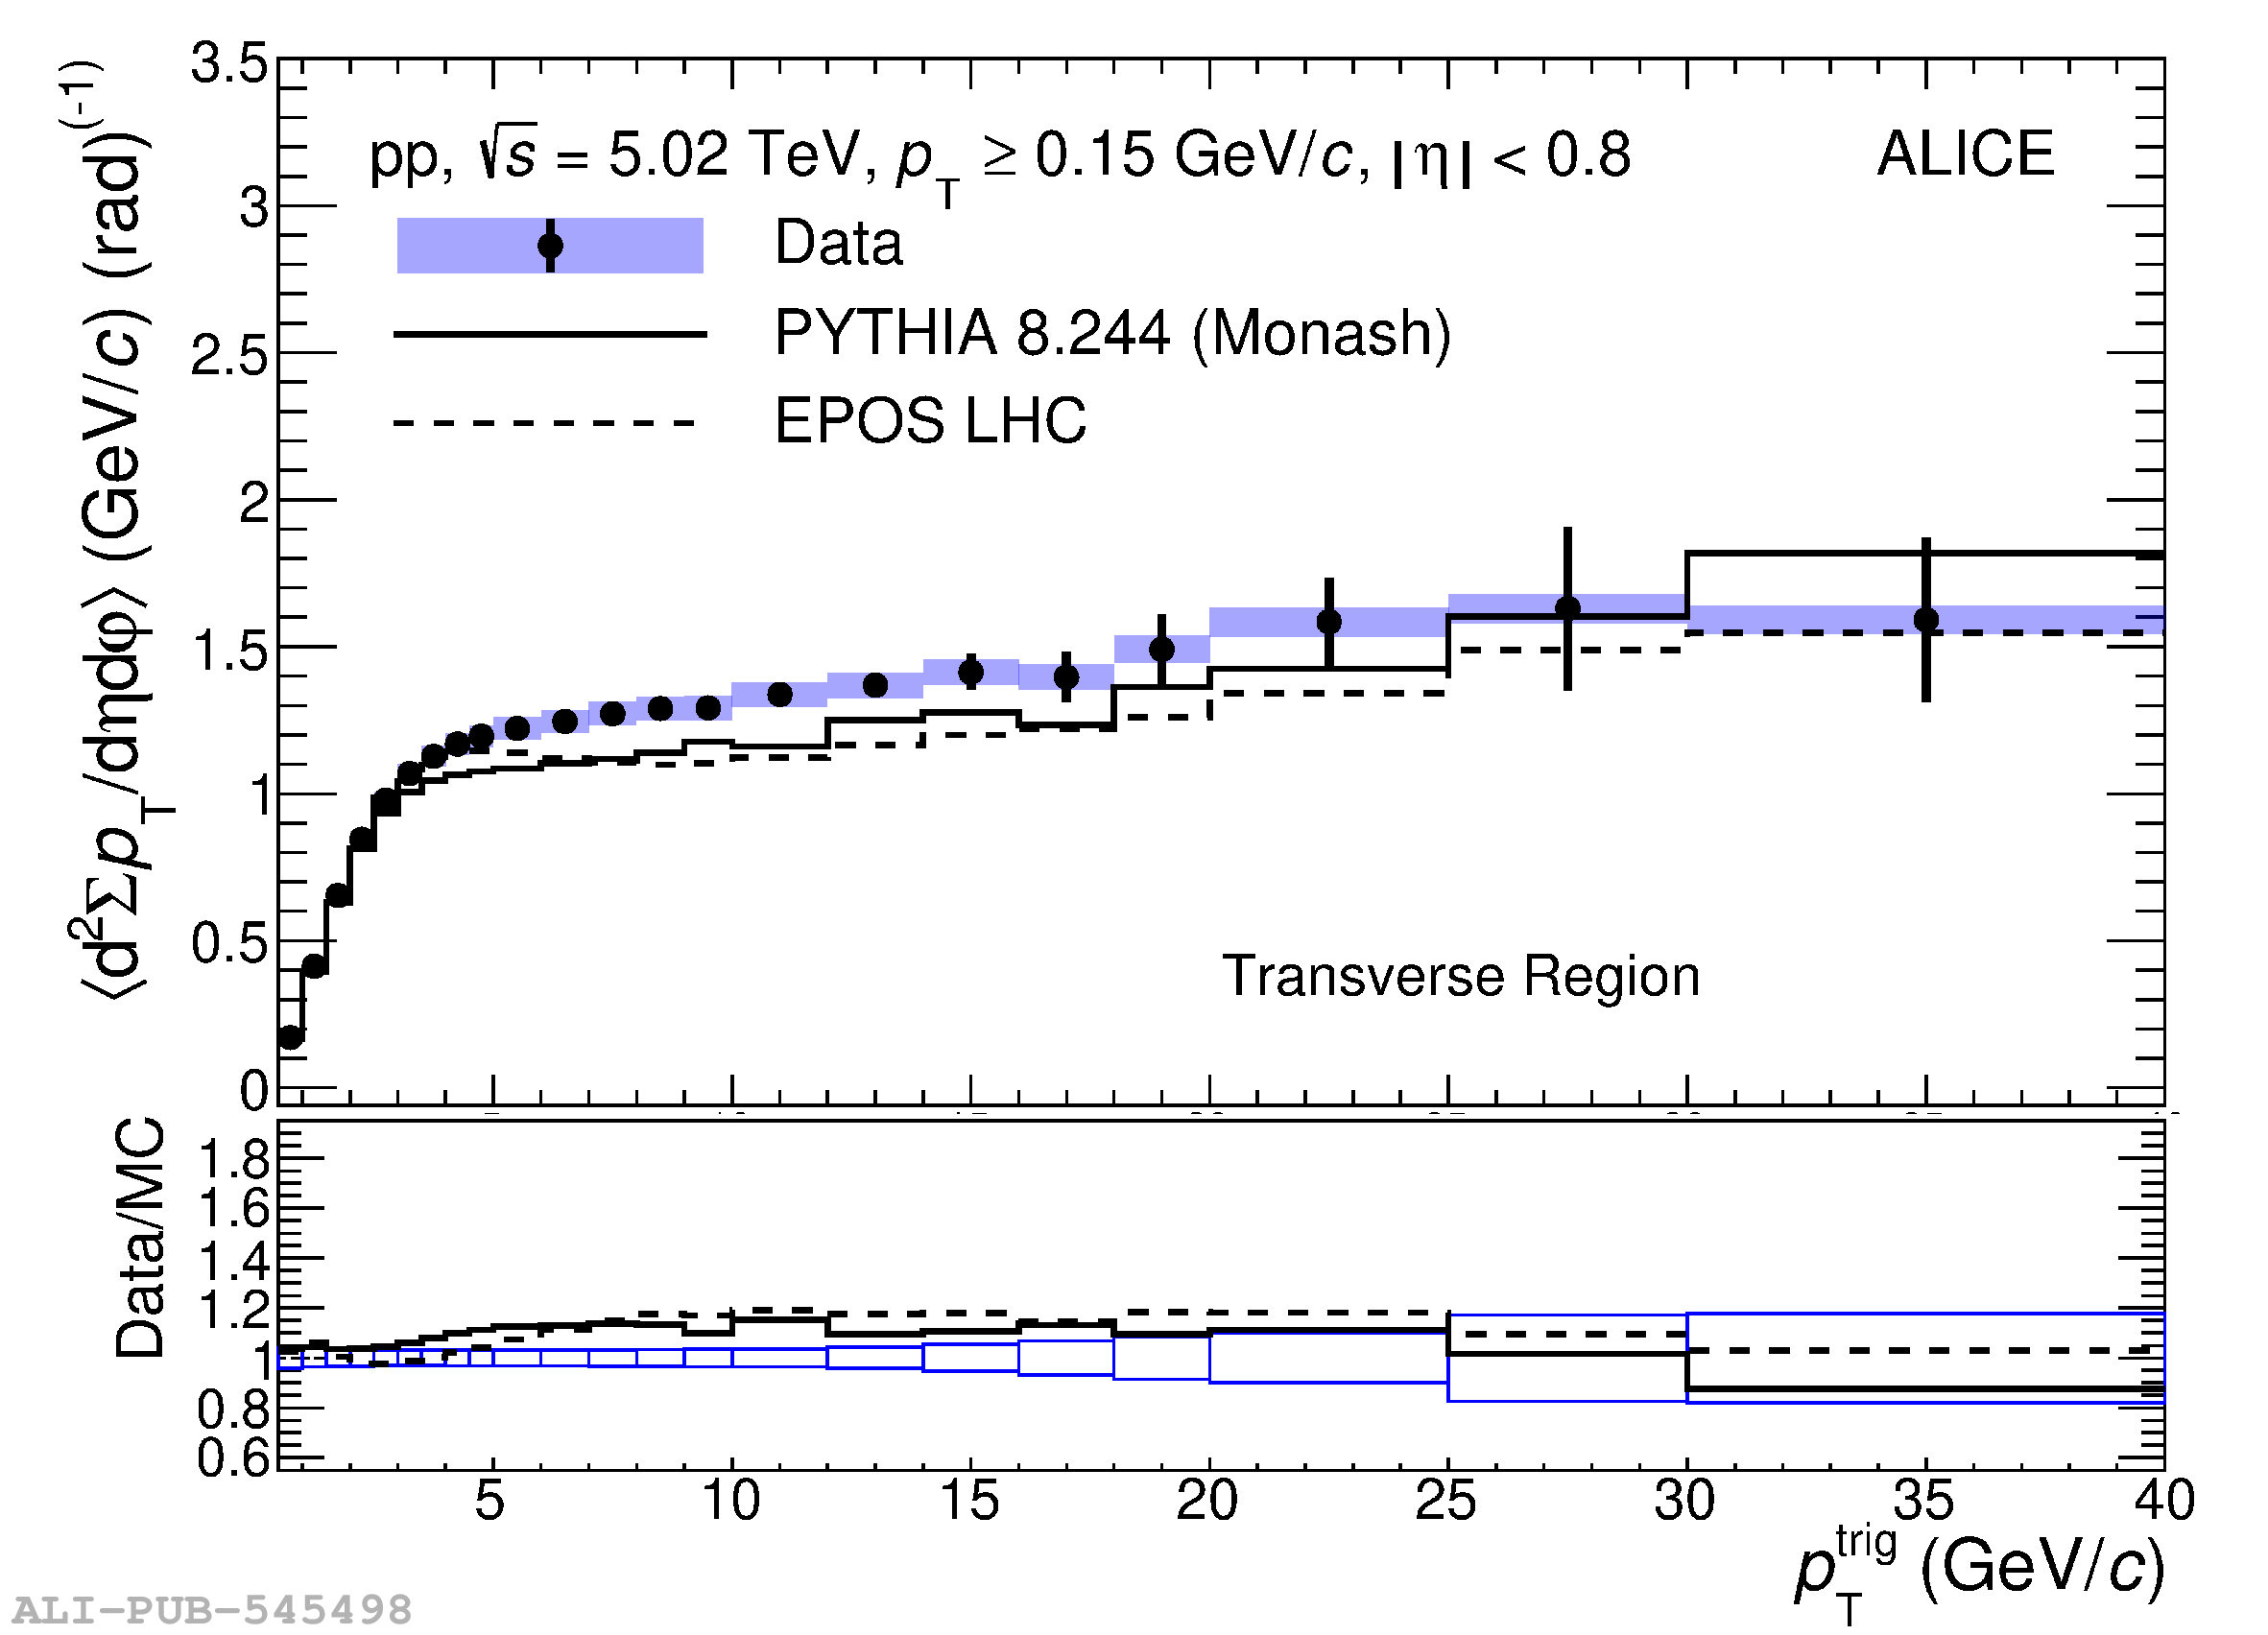 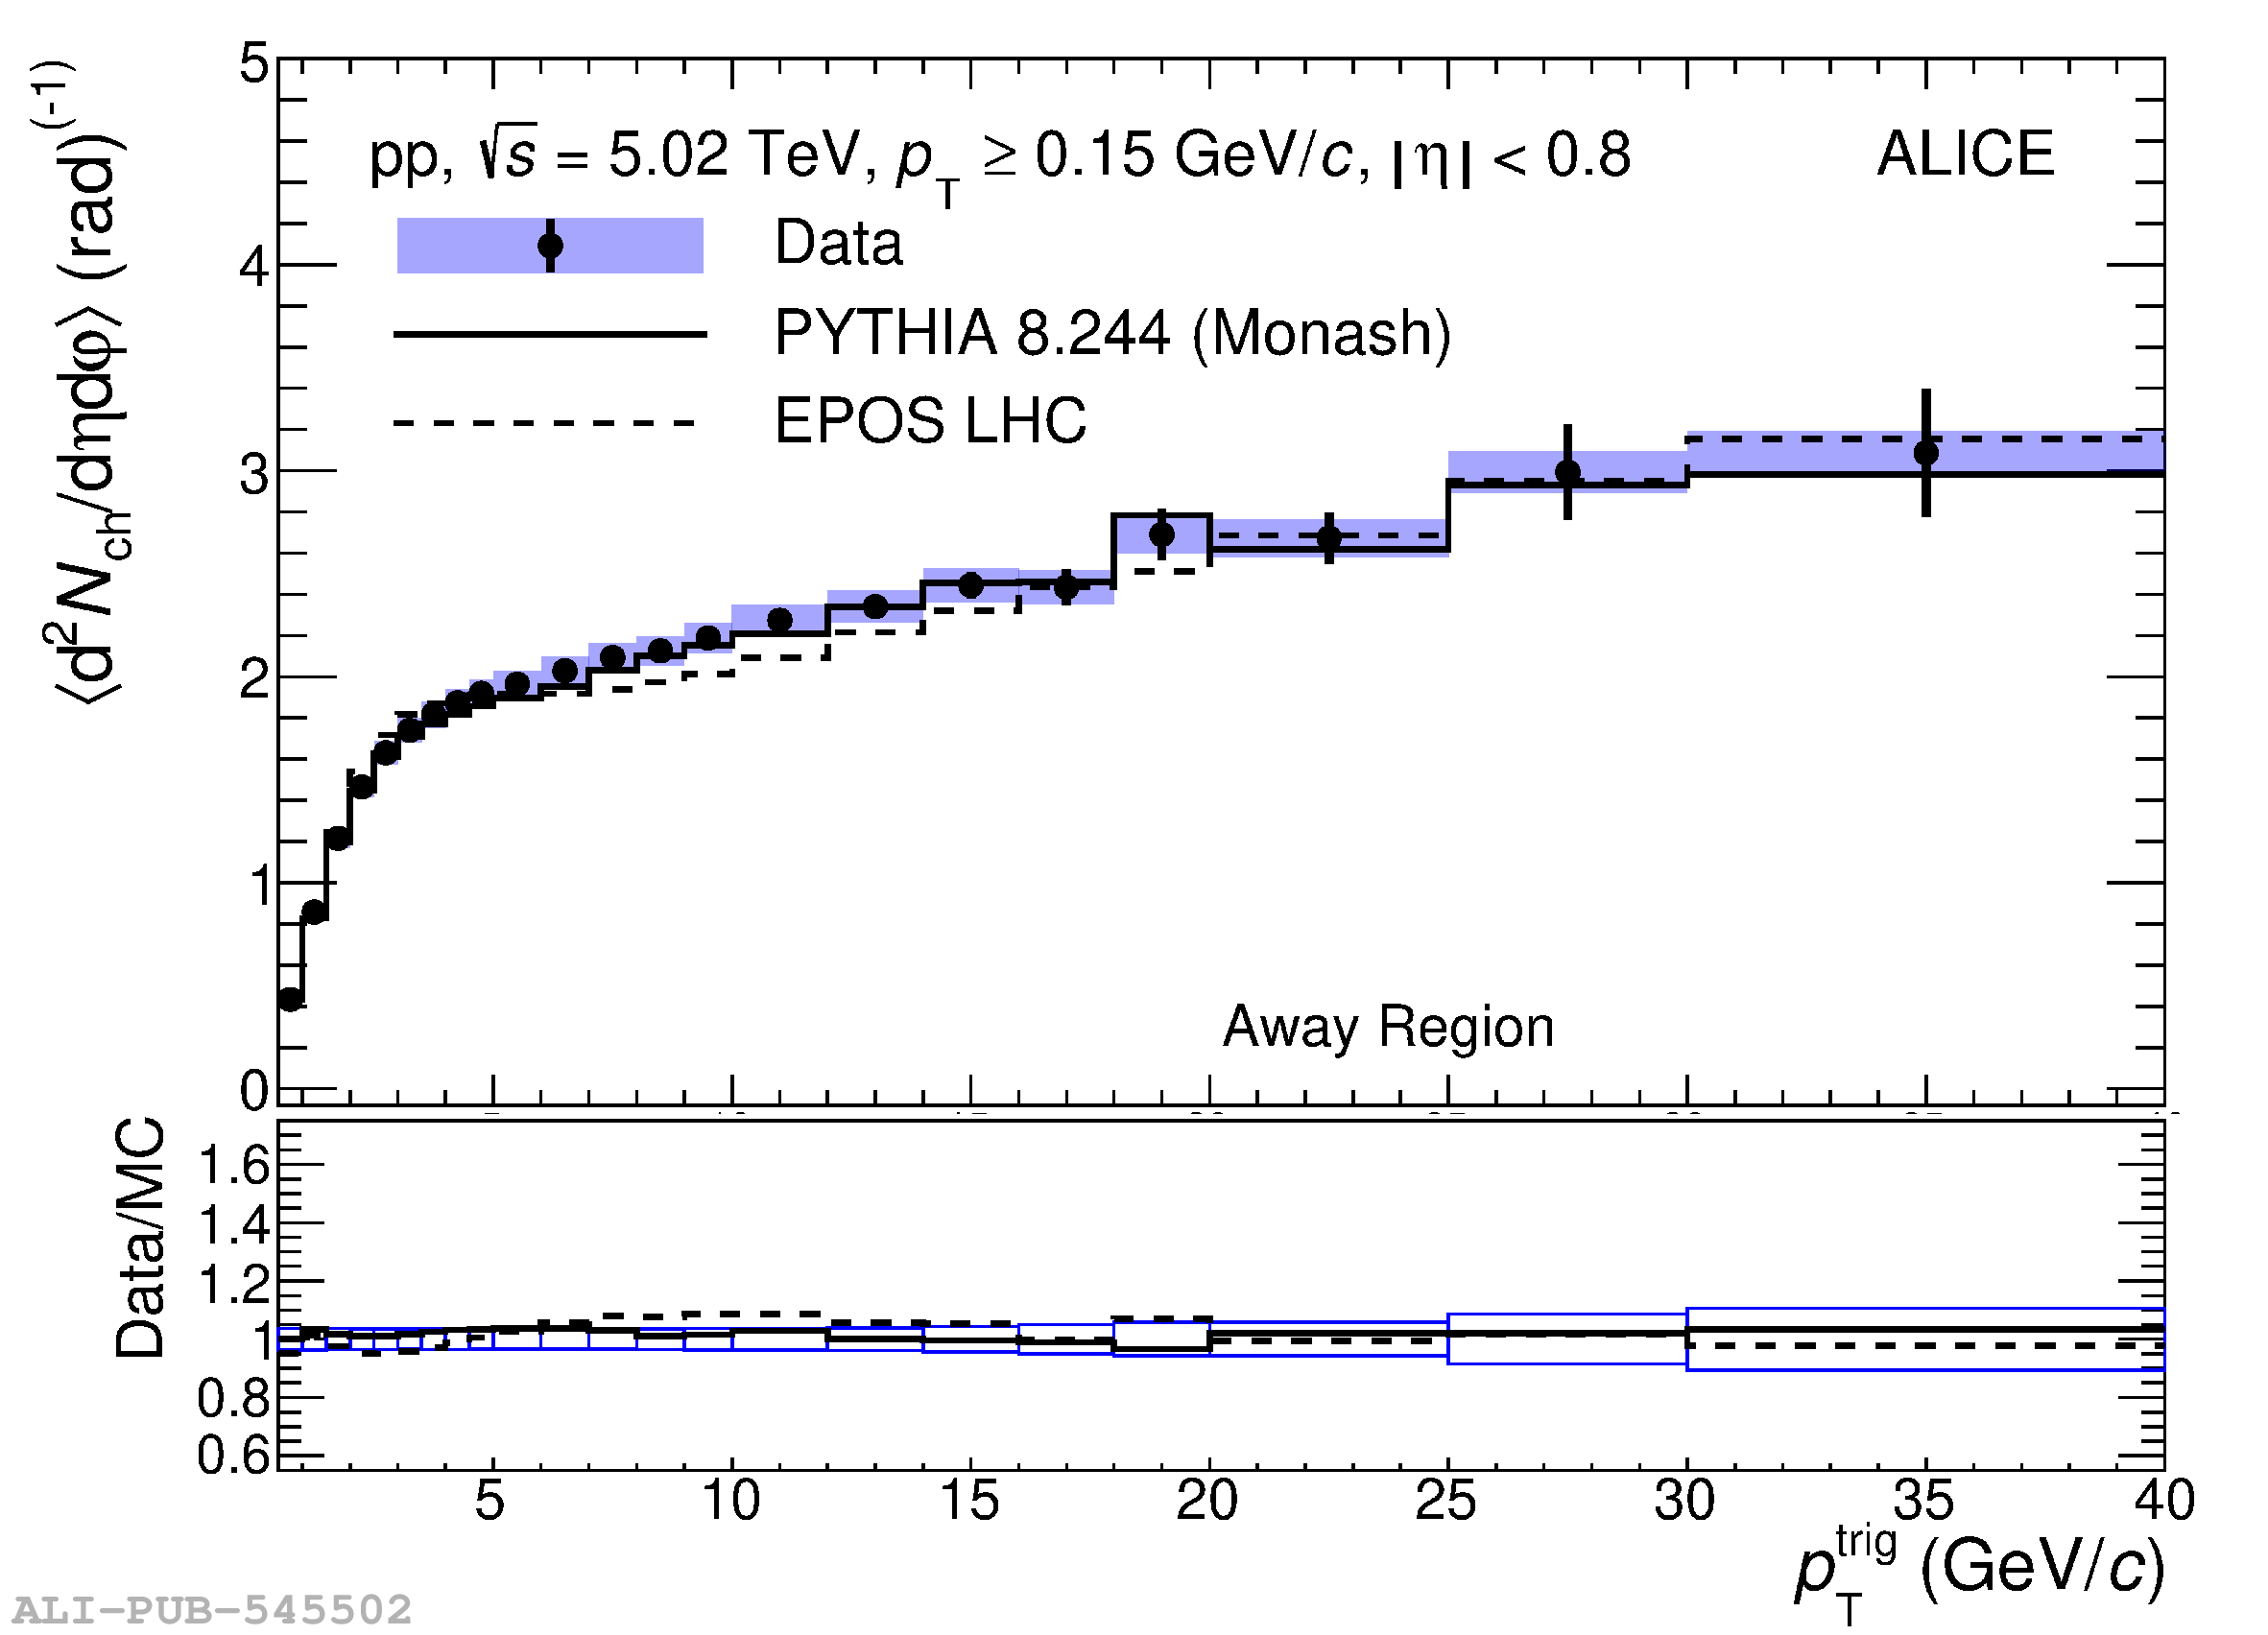 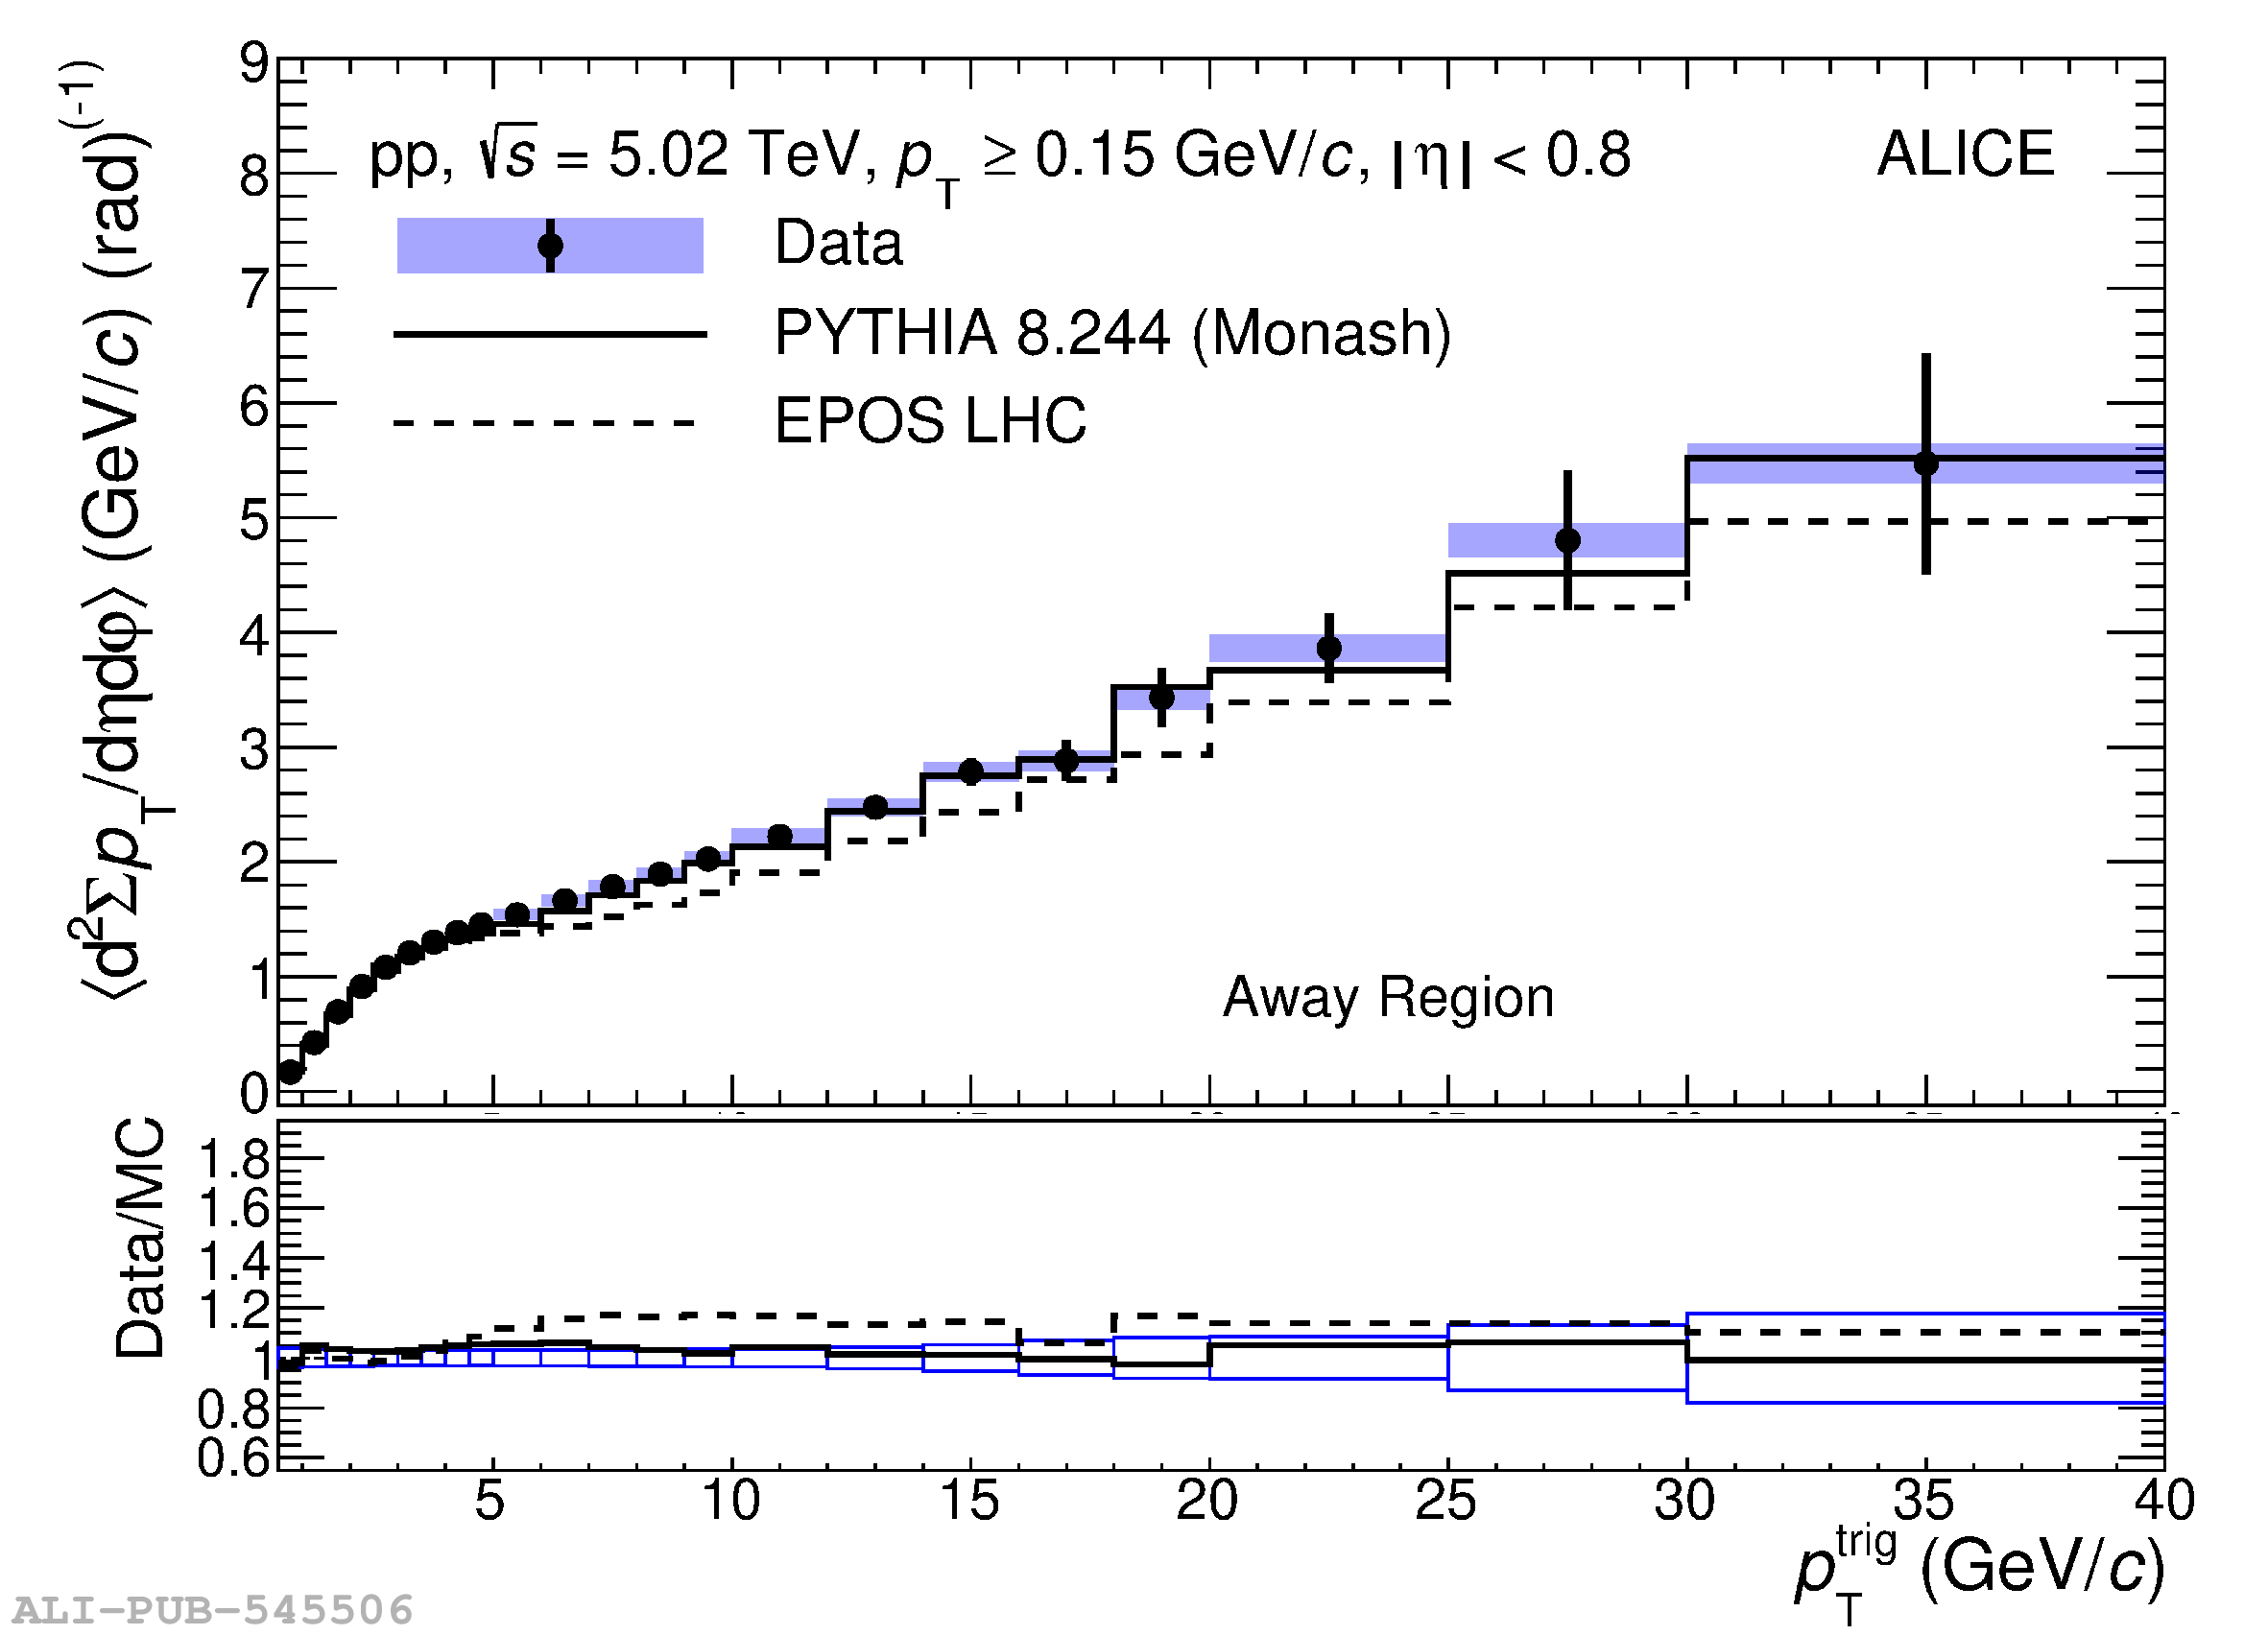 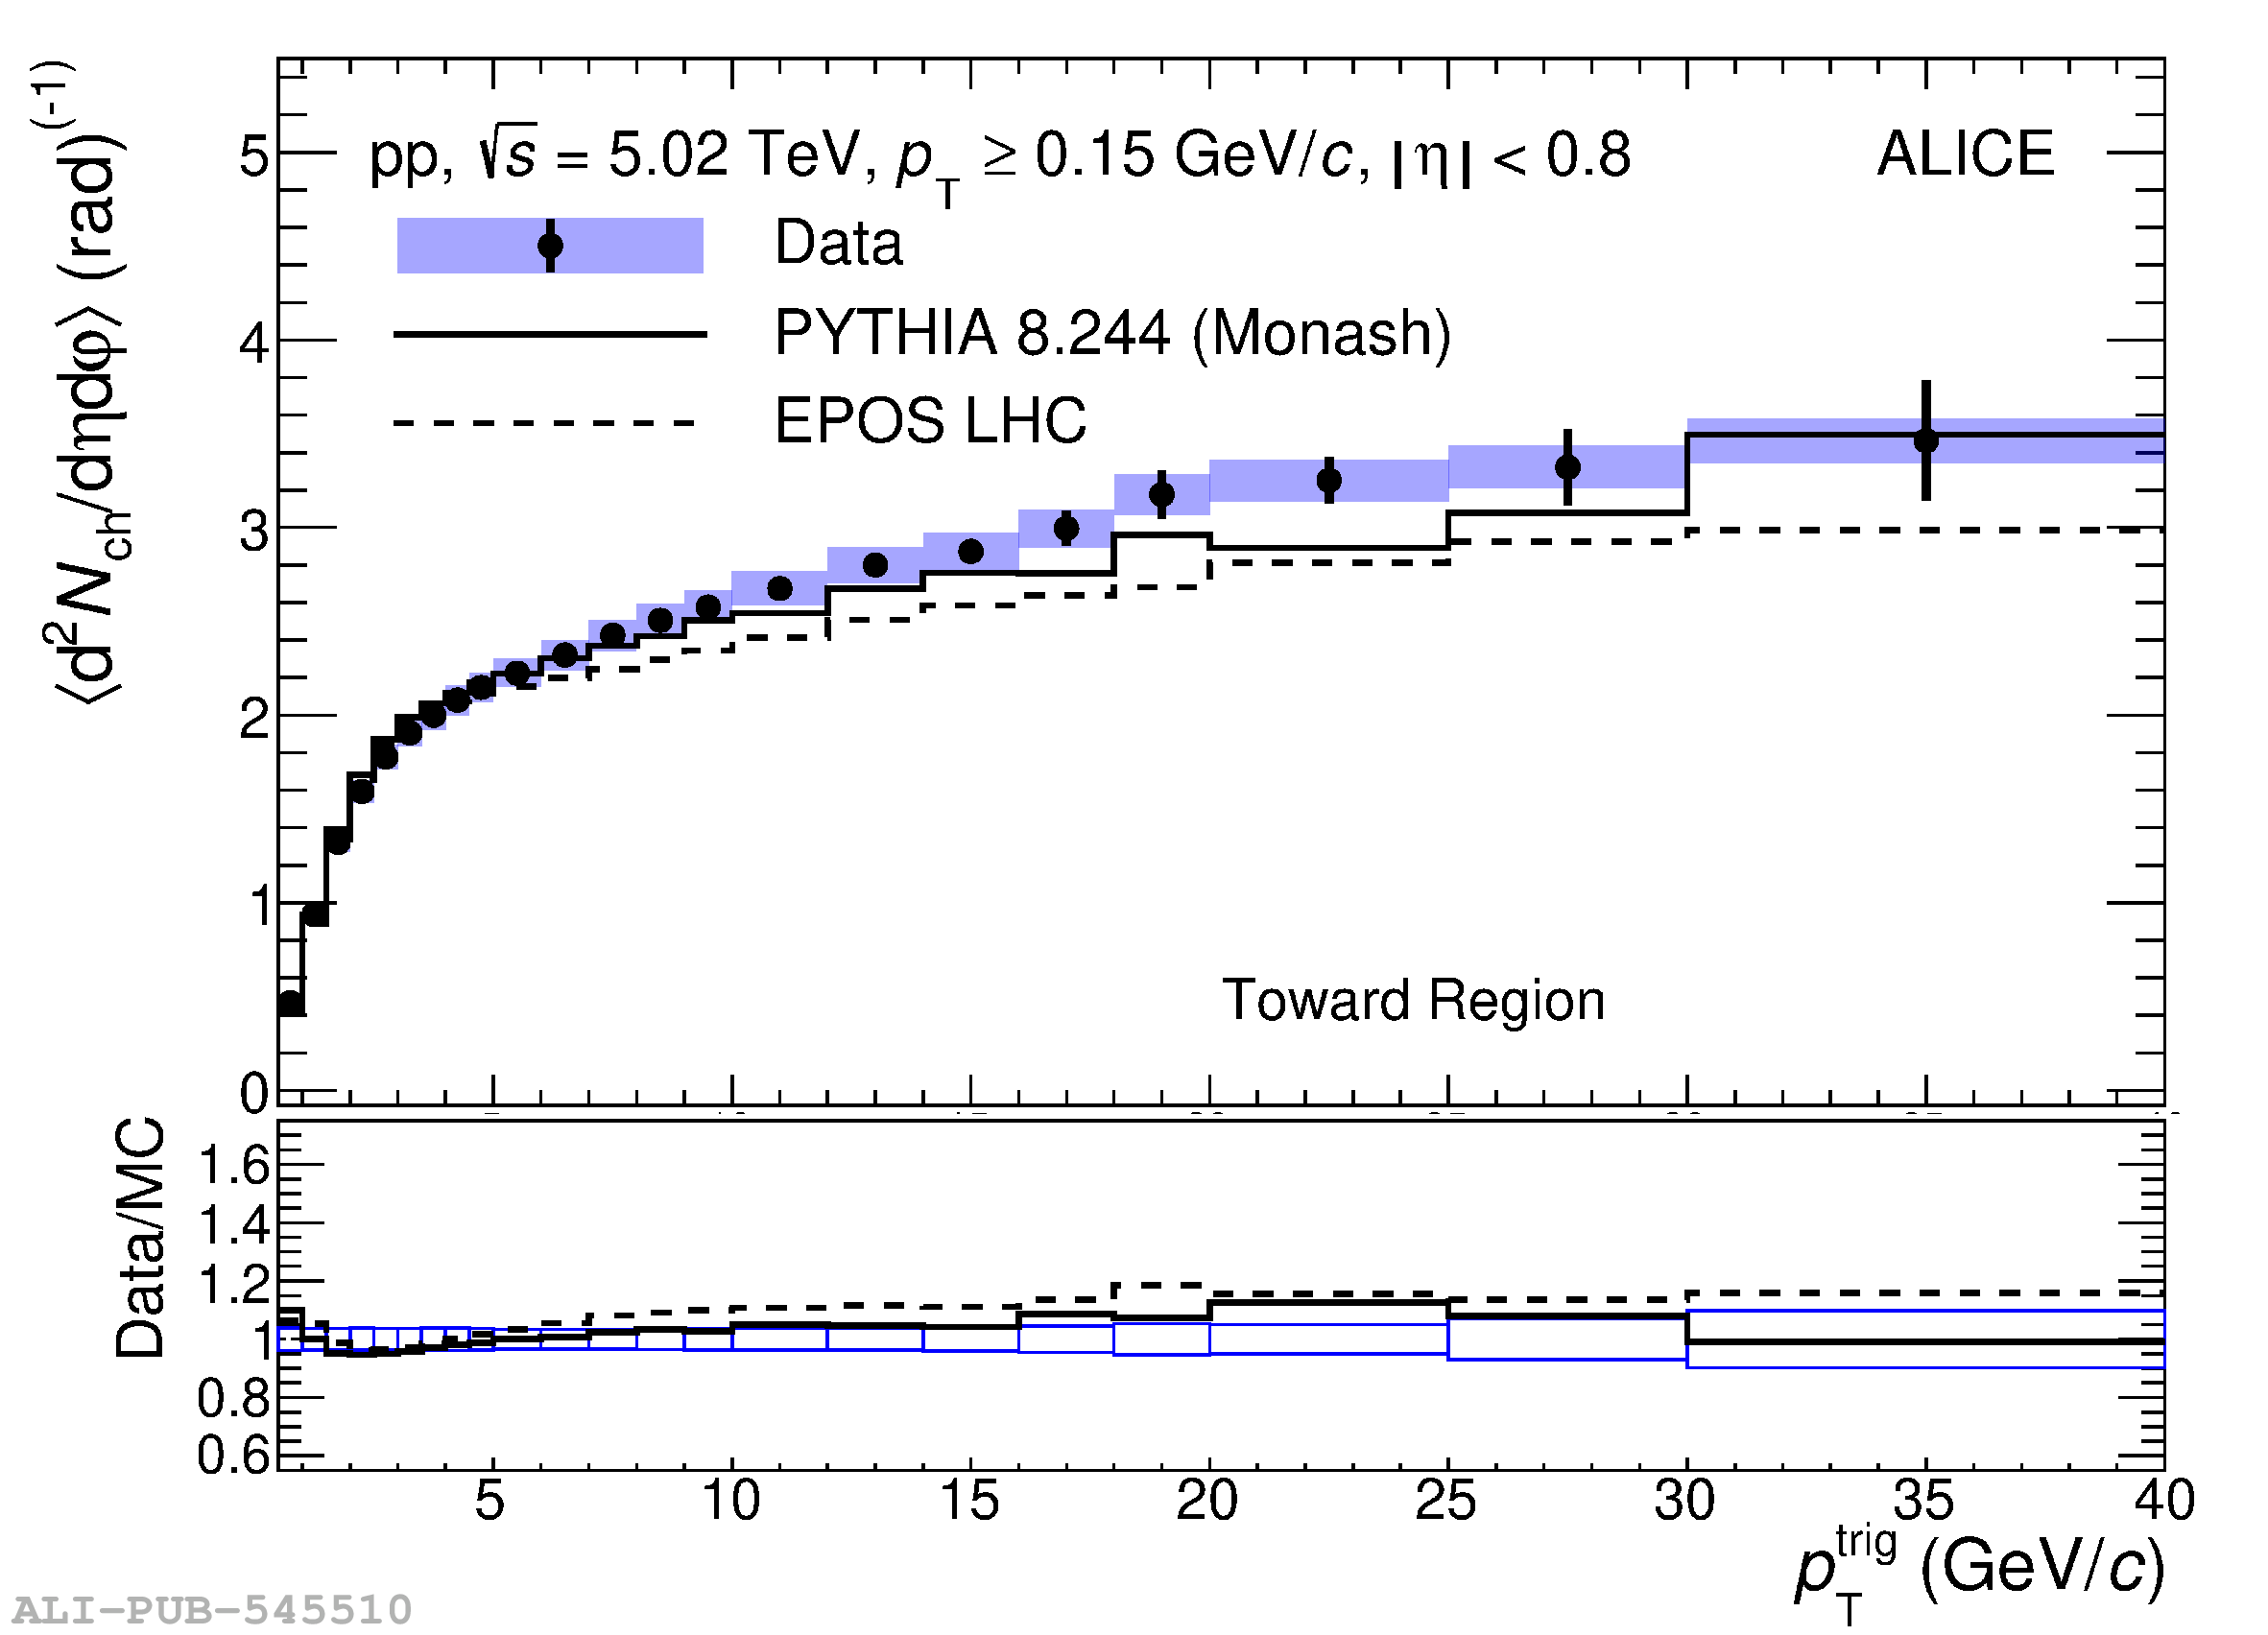 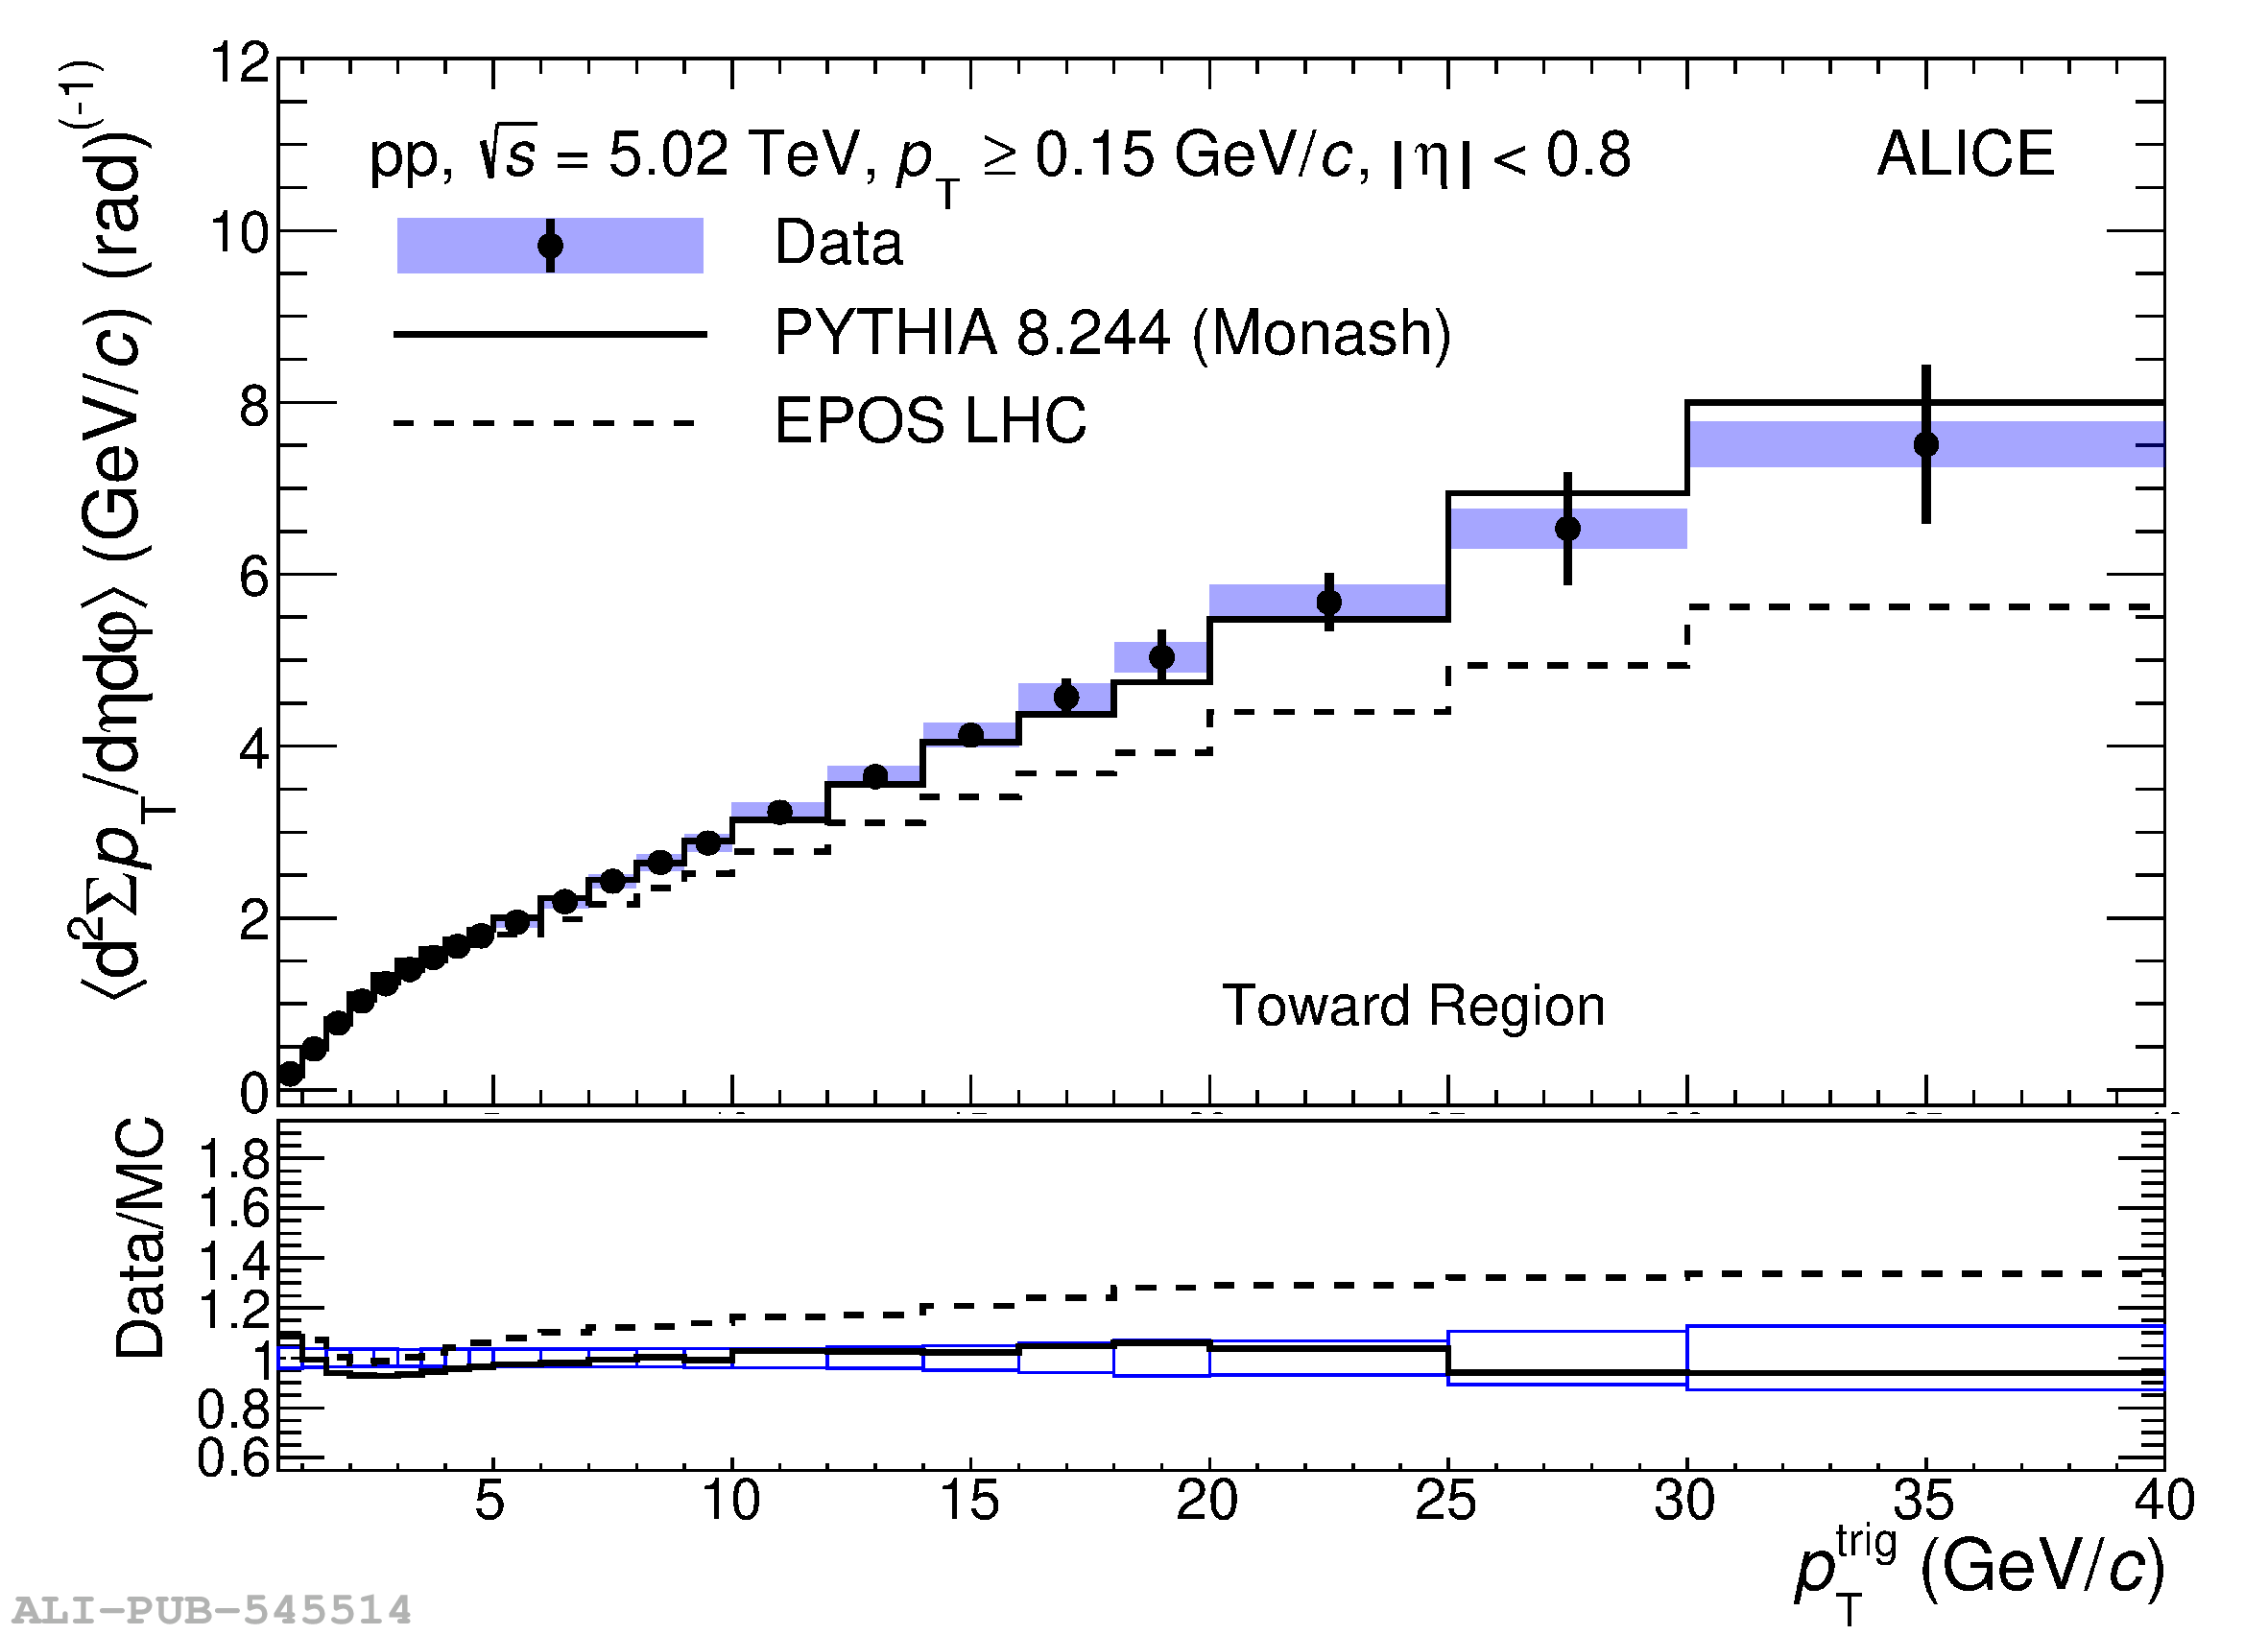 |
Figure A.2
The charged-particle number (left) and summed-$p_{\rm T}$ (right) densities as a function of $p_{\rm T}^{\rm trig}$ in pp collision at $\sqrt{s}=5.02$ TeV are displayed. Results for the transverse (top), away (middle), and toward (bottom) regions were obtained for the transverse momentum threshold $\pt>1$ GeV/$c$. The shaded area and the error bars around the data points represent the systematic and statistical uncertainties, respectively. Data are compared with PYTHIA 8/Monash (solid line) and EPOS LHC (dashed line) predictions. The data-to-model ratios are displayed in the bottom panel of each plot. The boxes around unity represent the statistical and systematic uncertainties added in quadrature. | 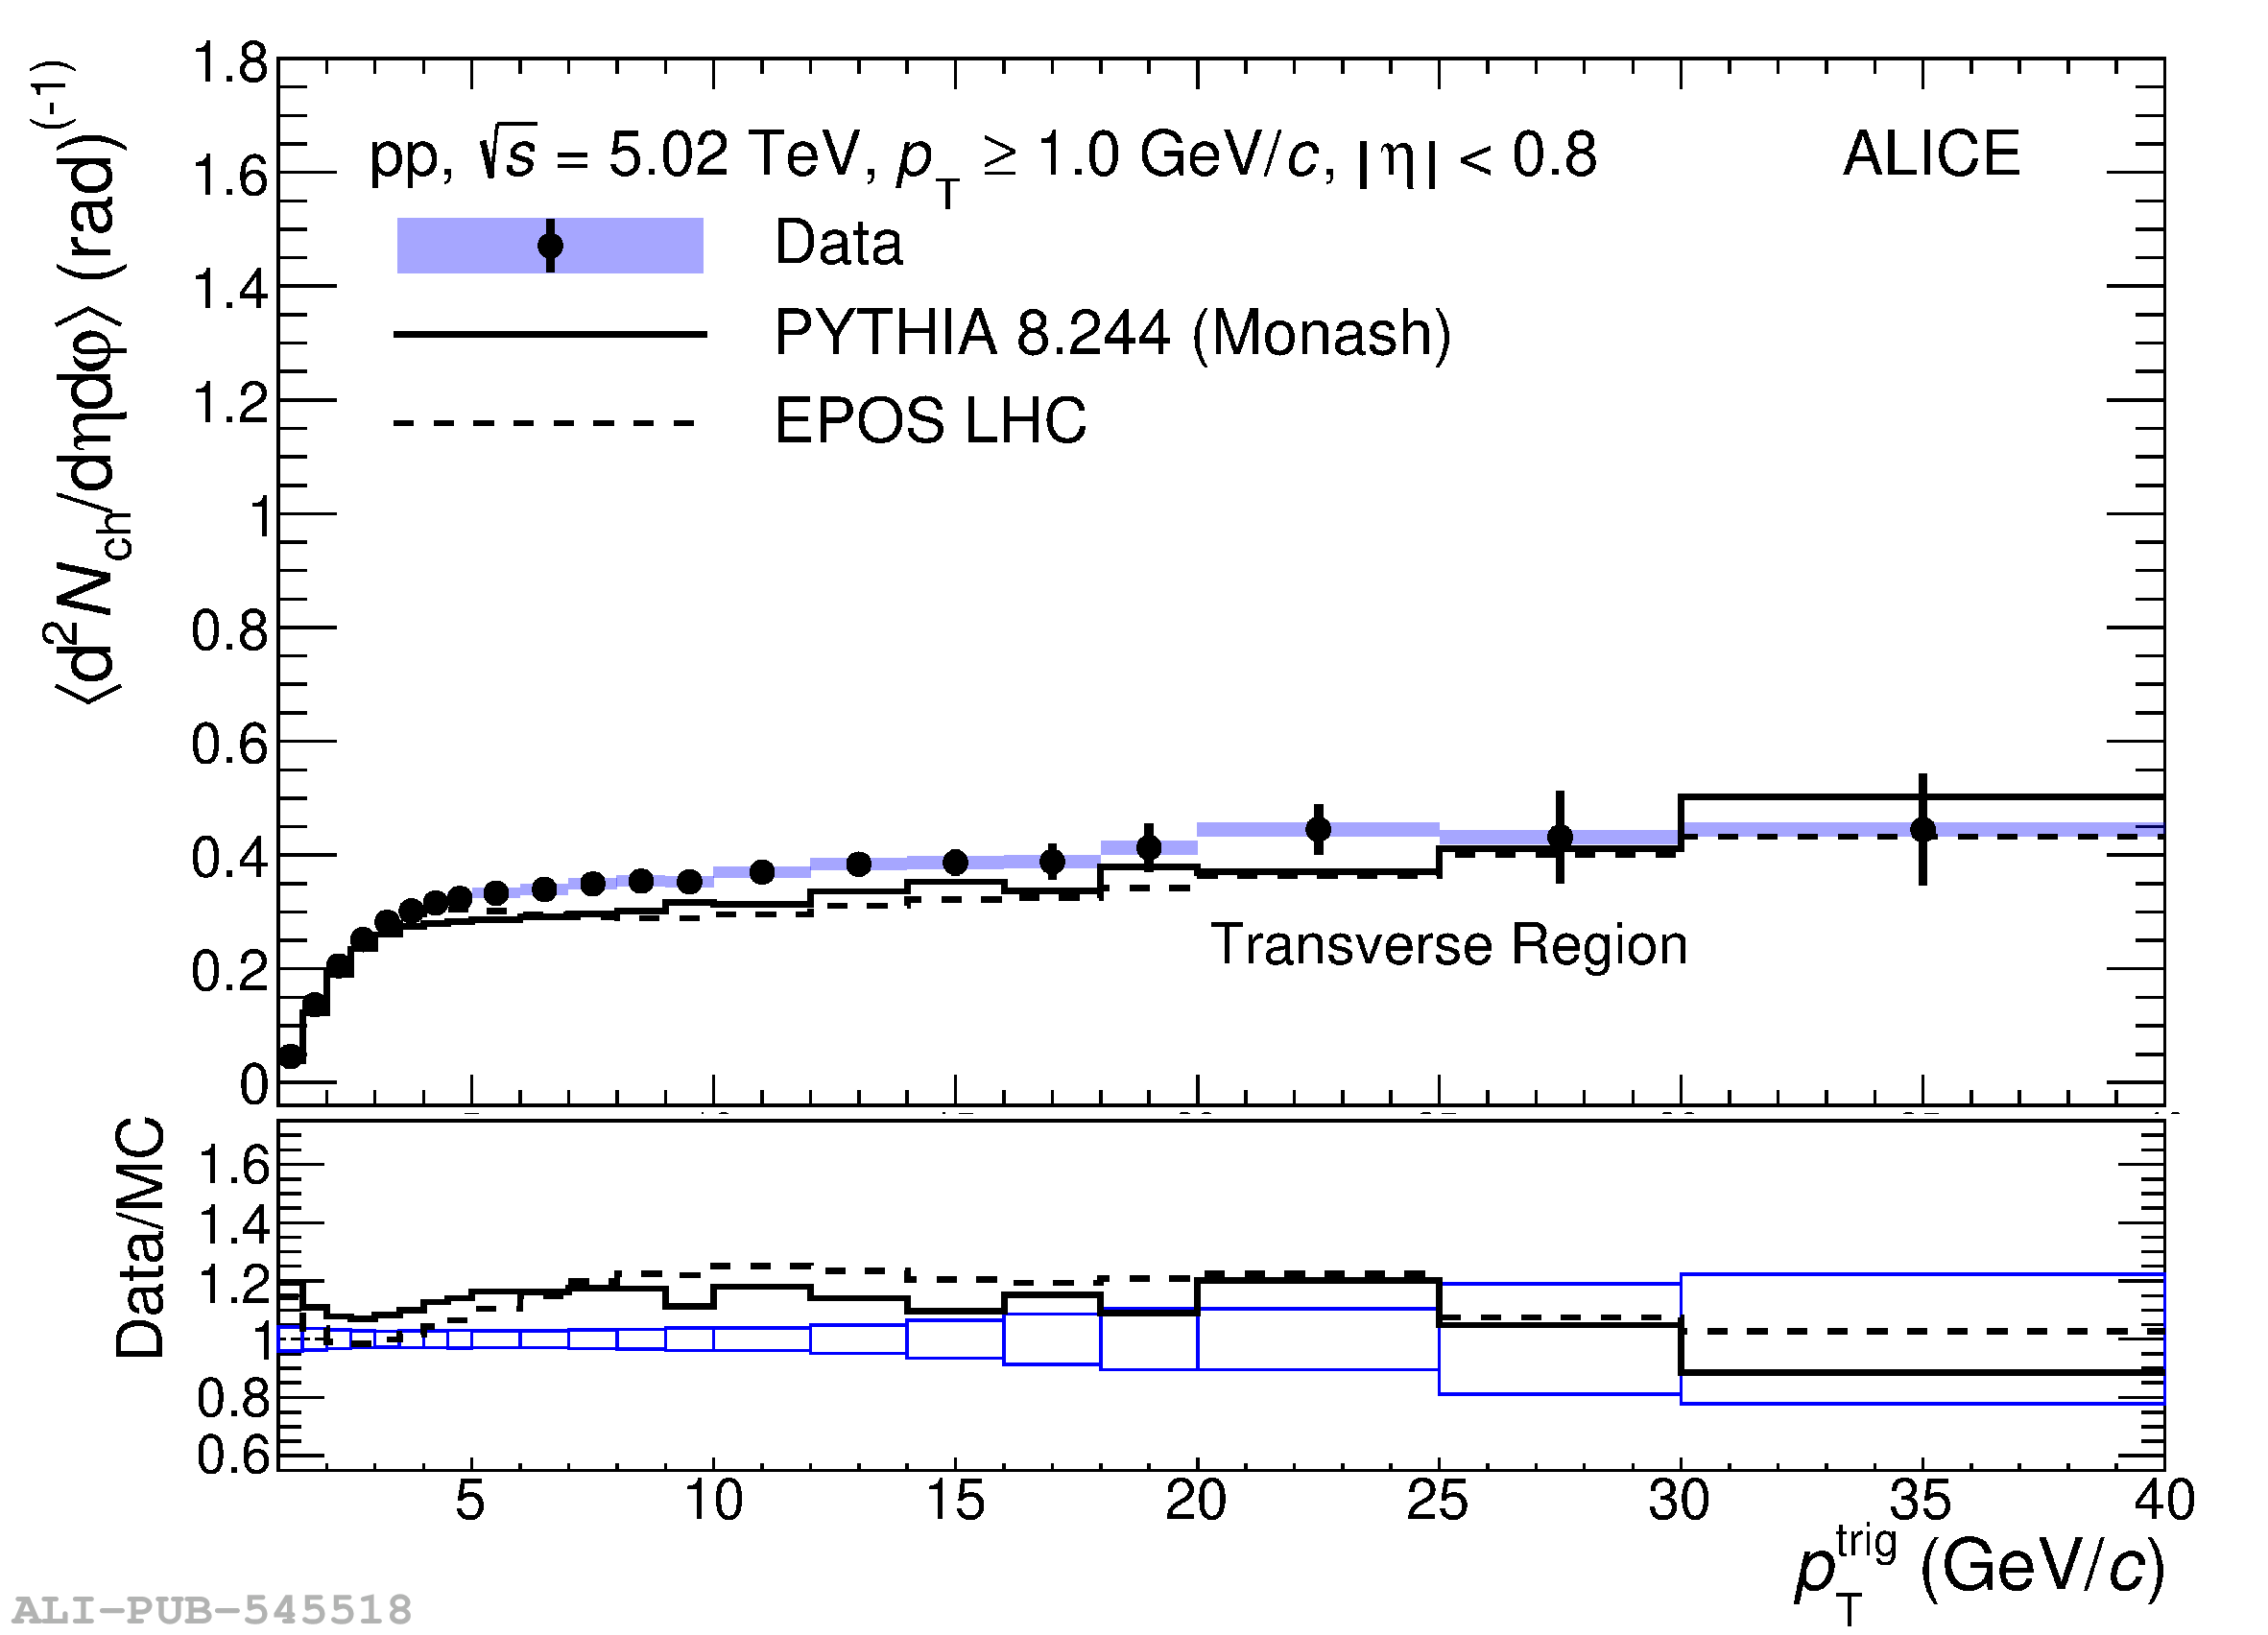 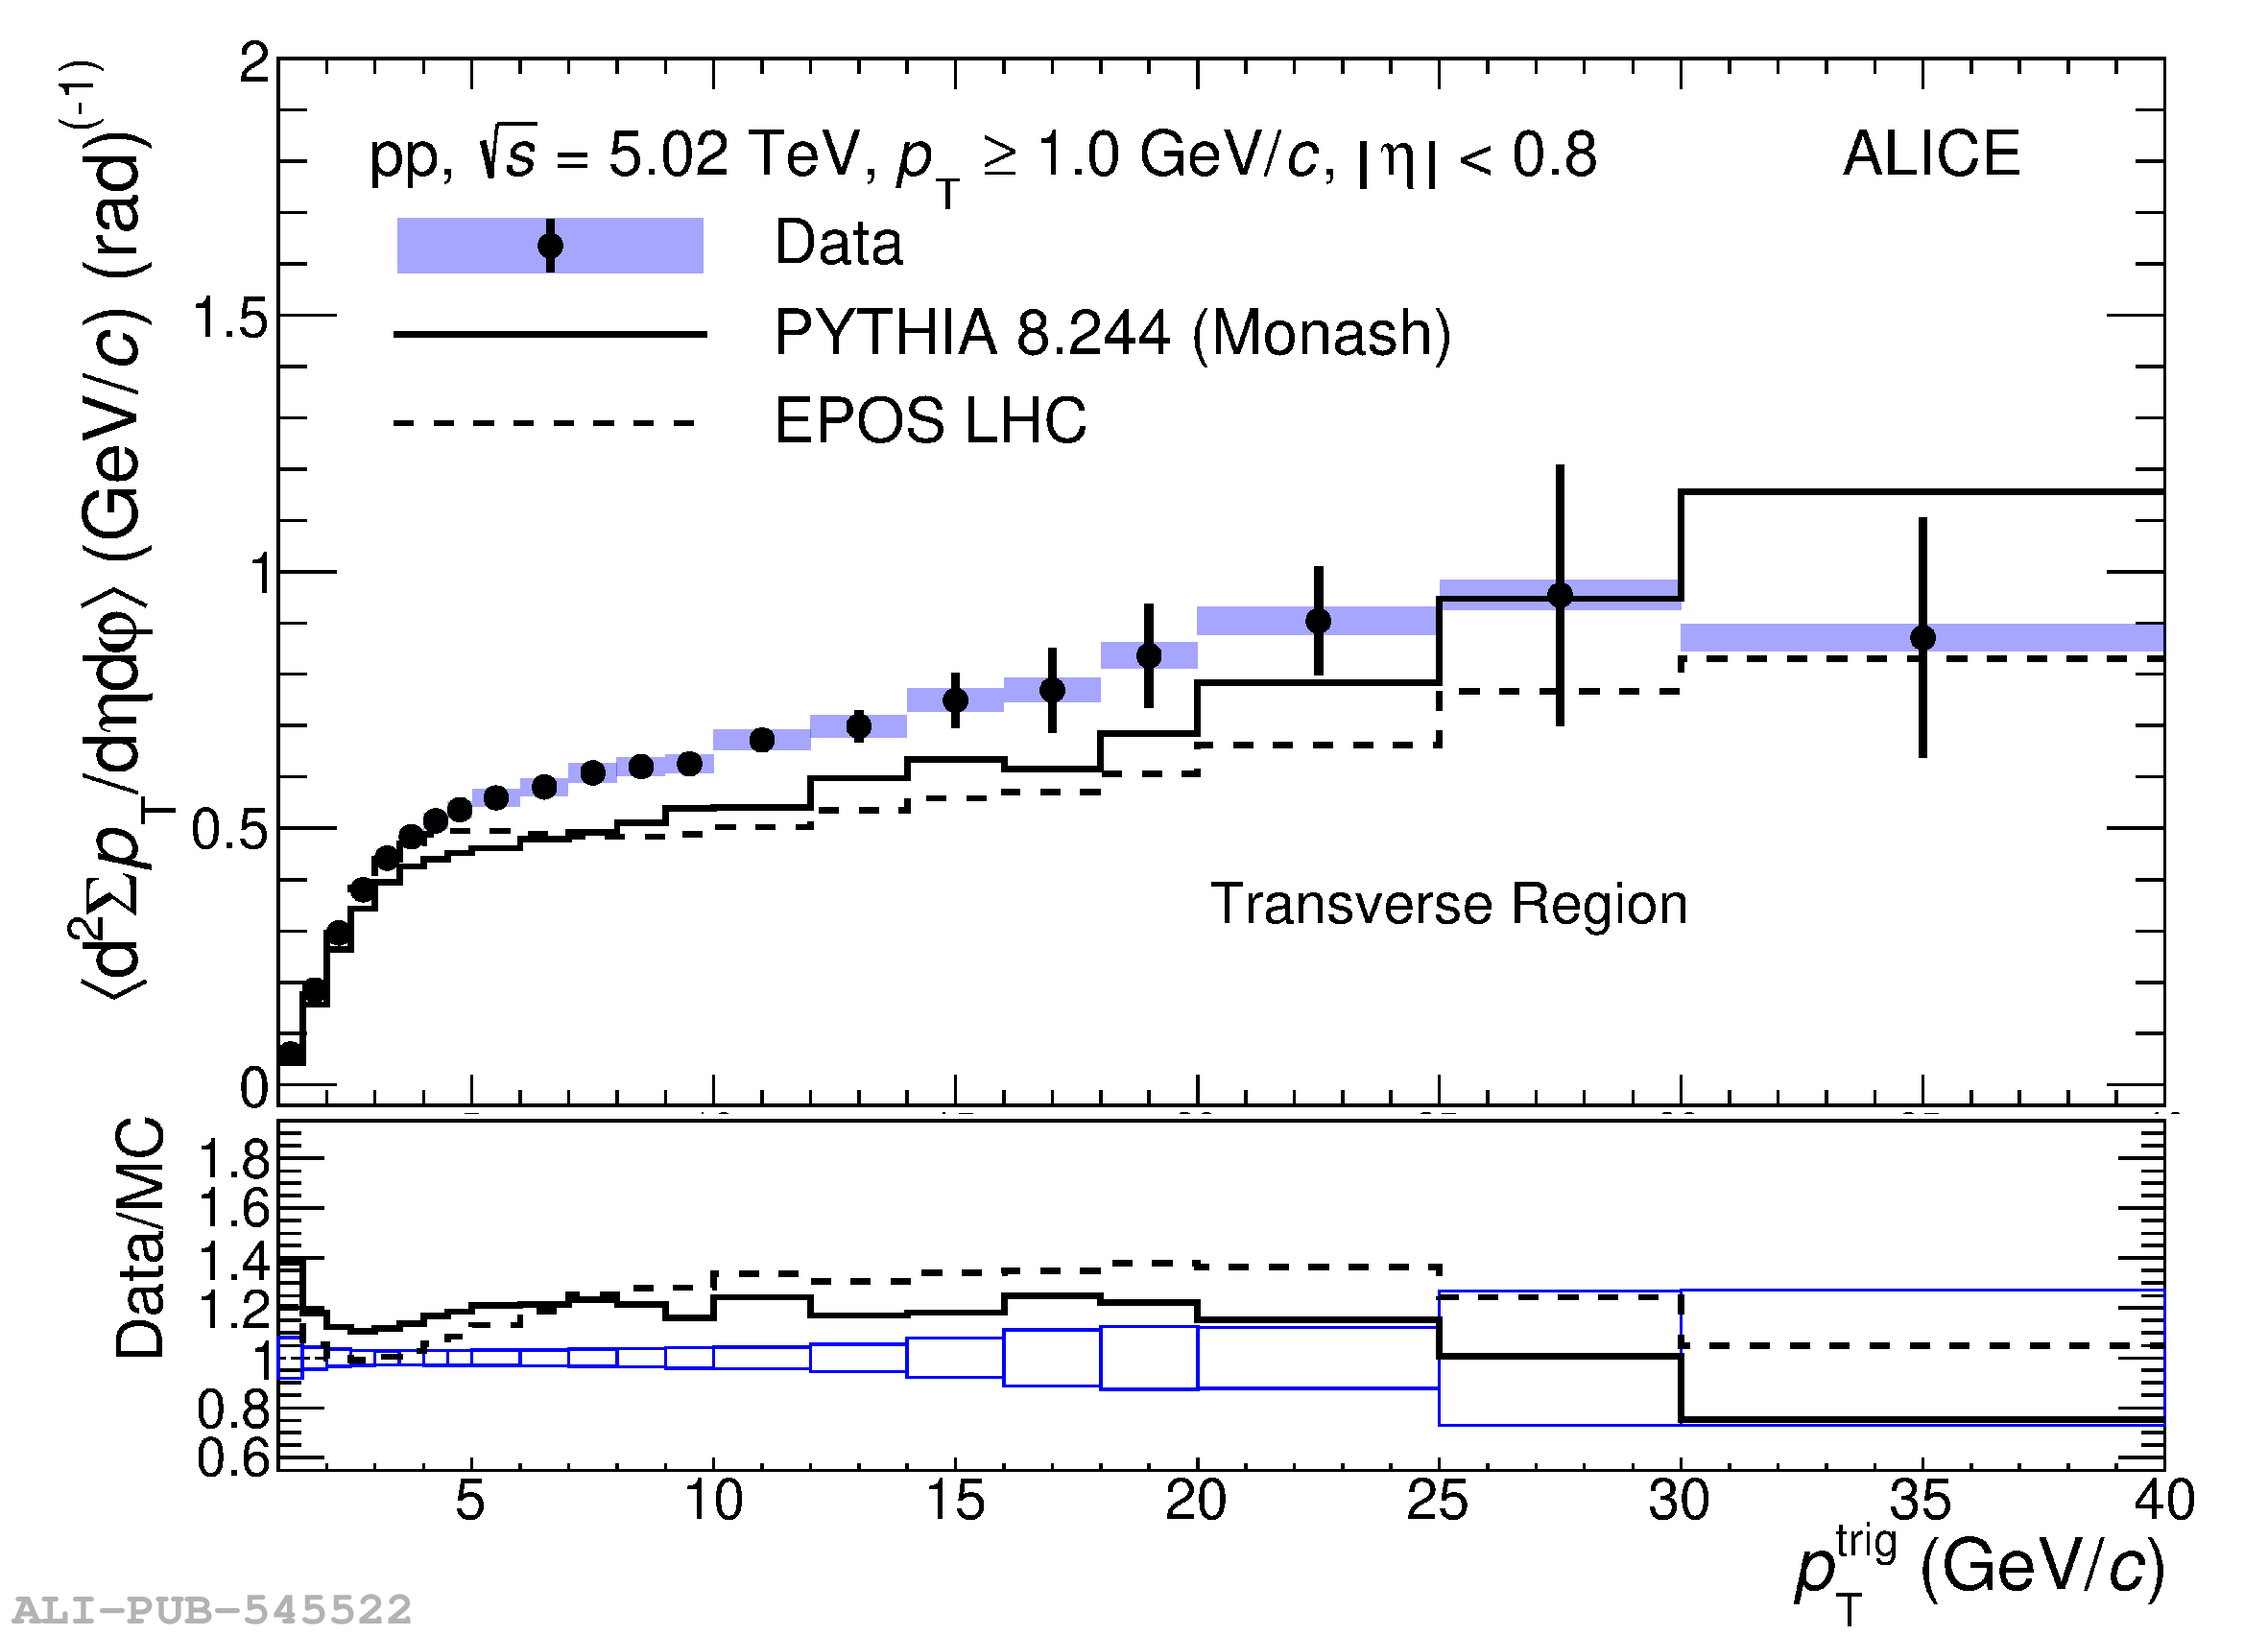 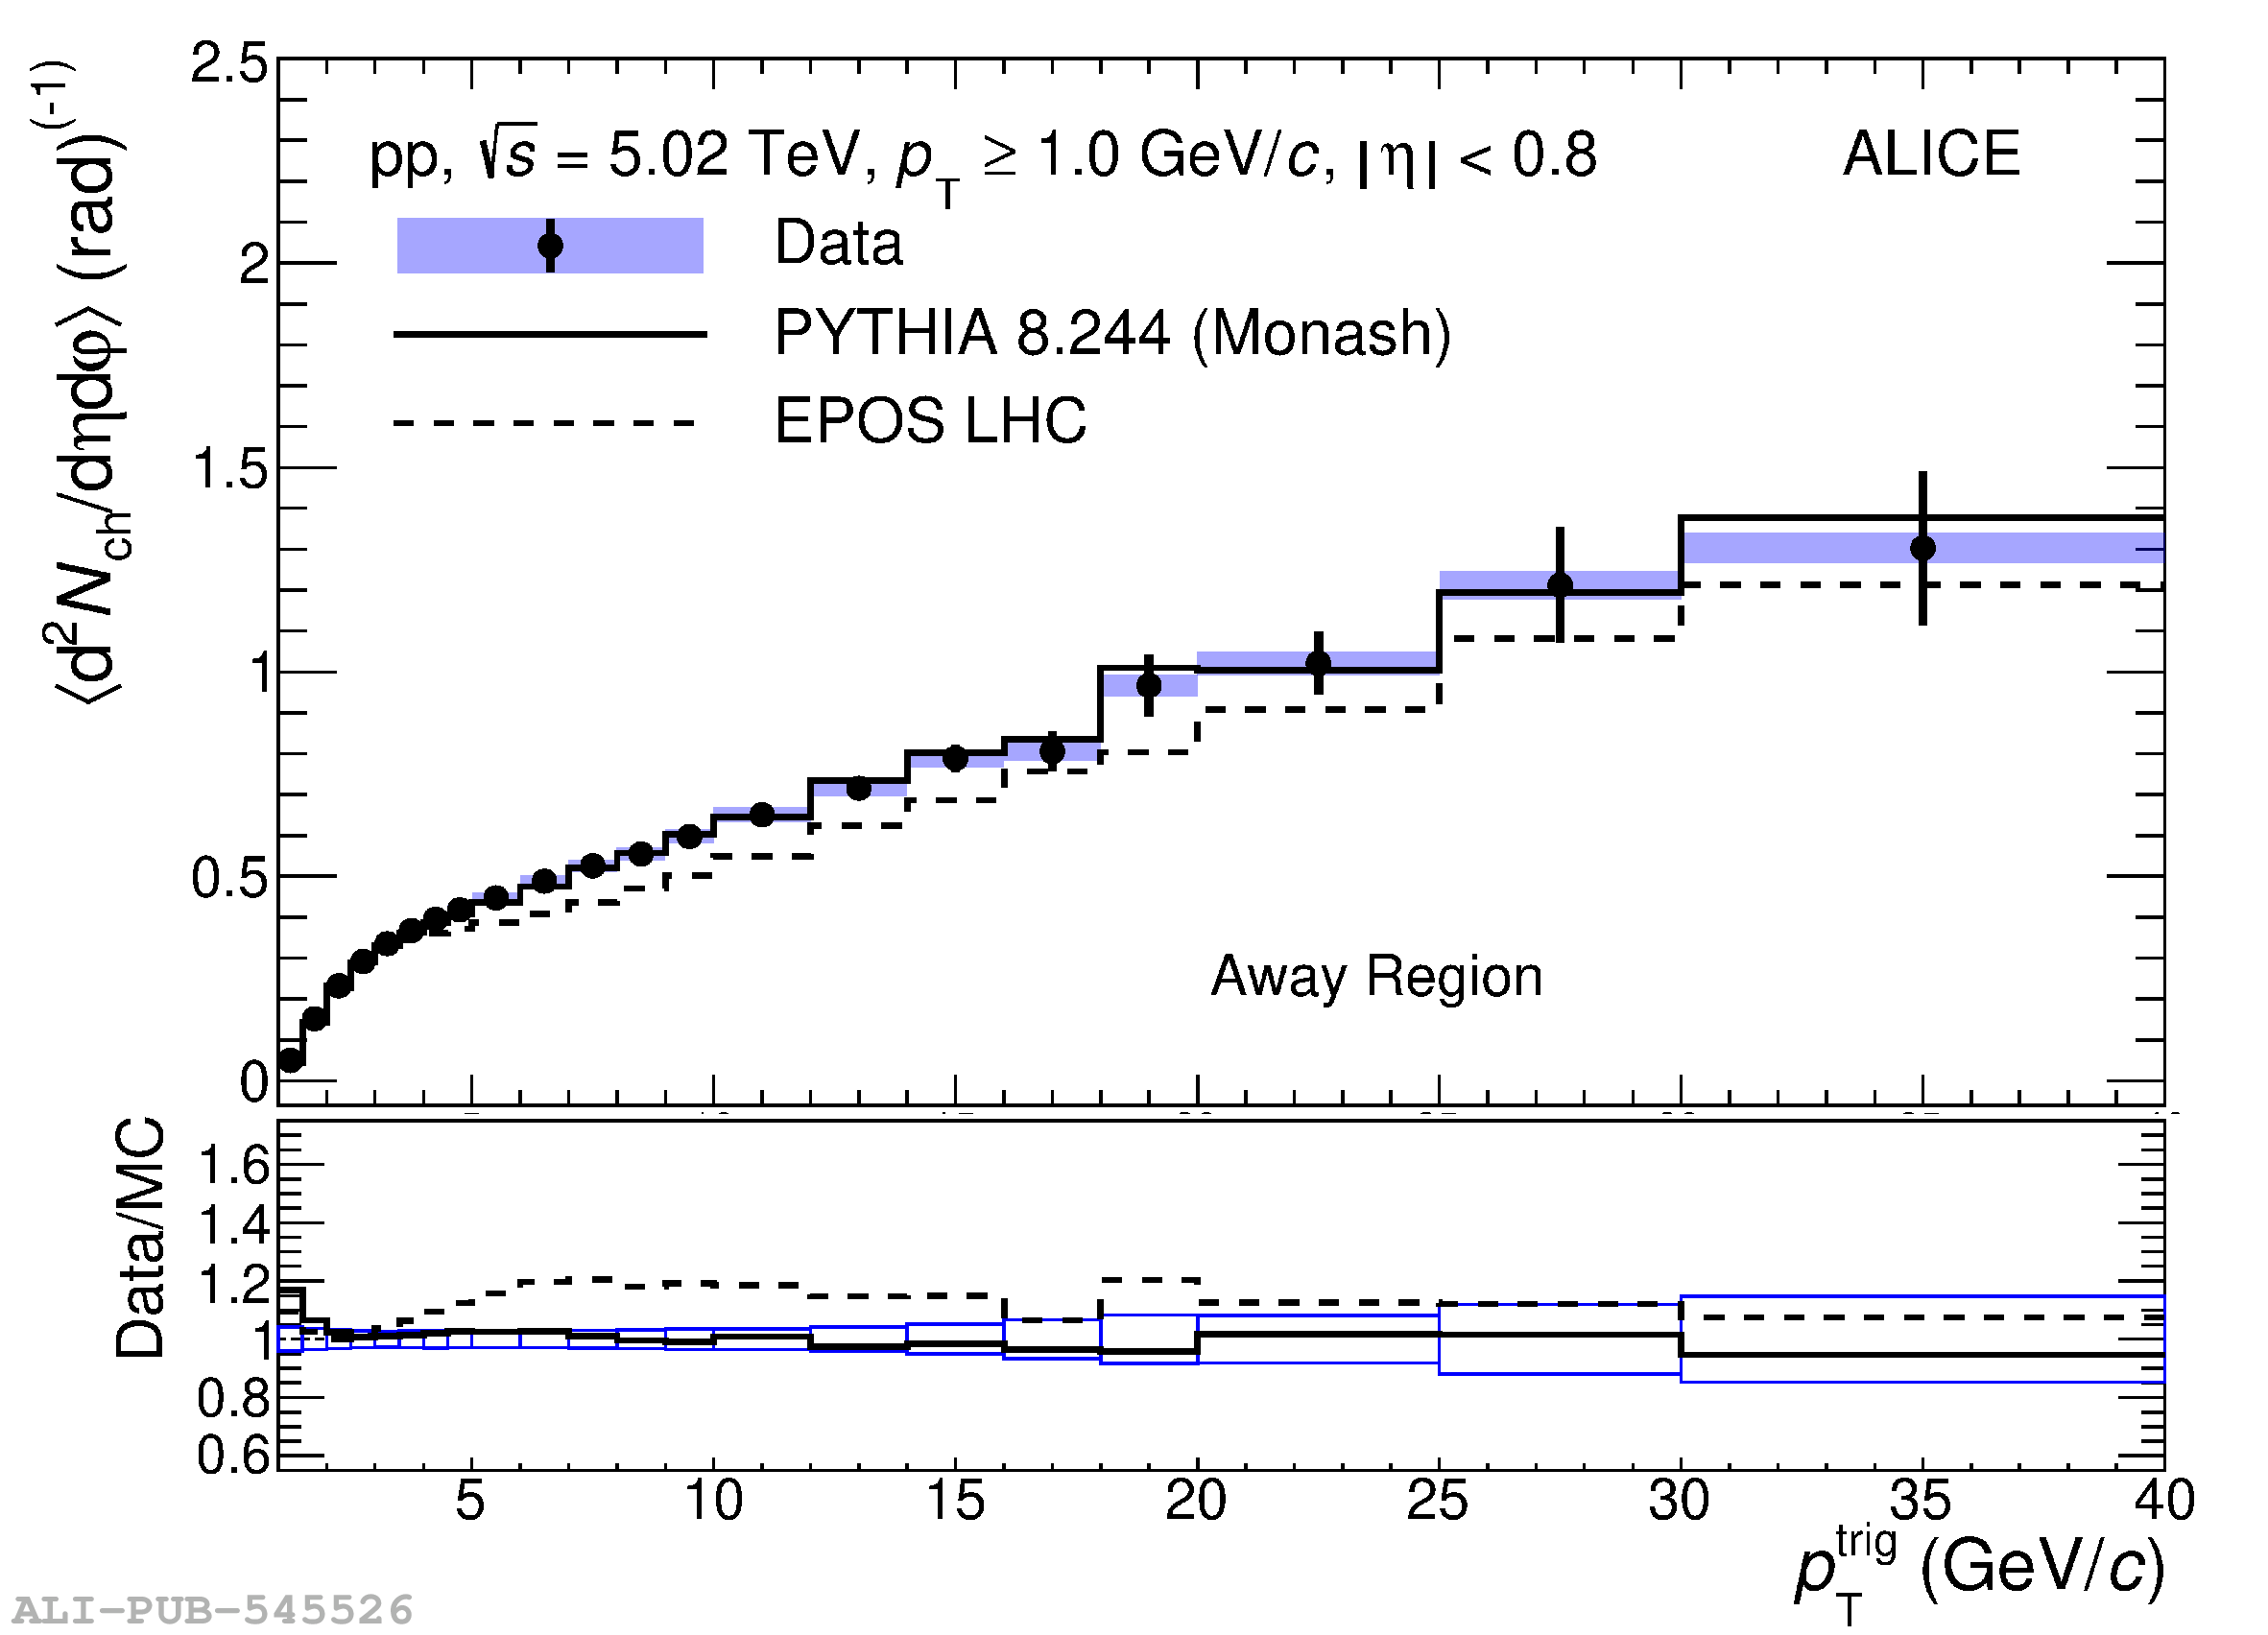 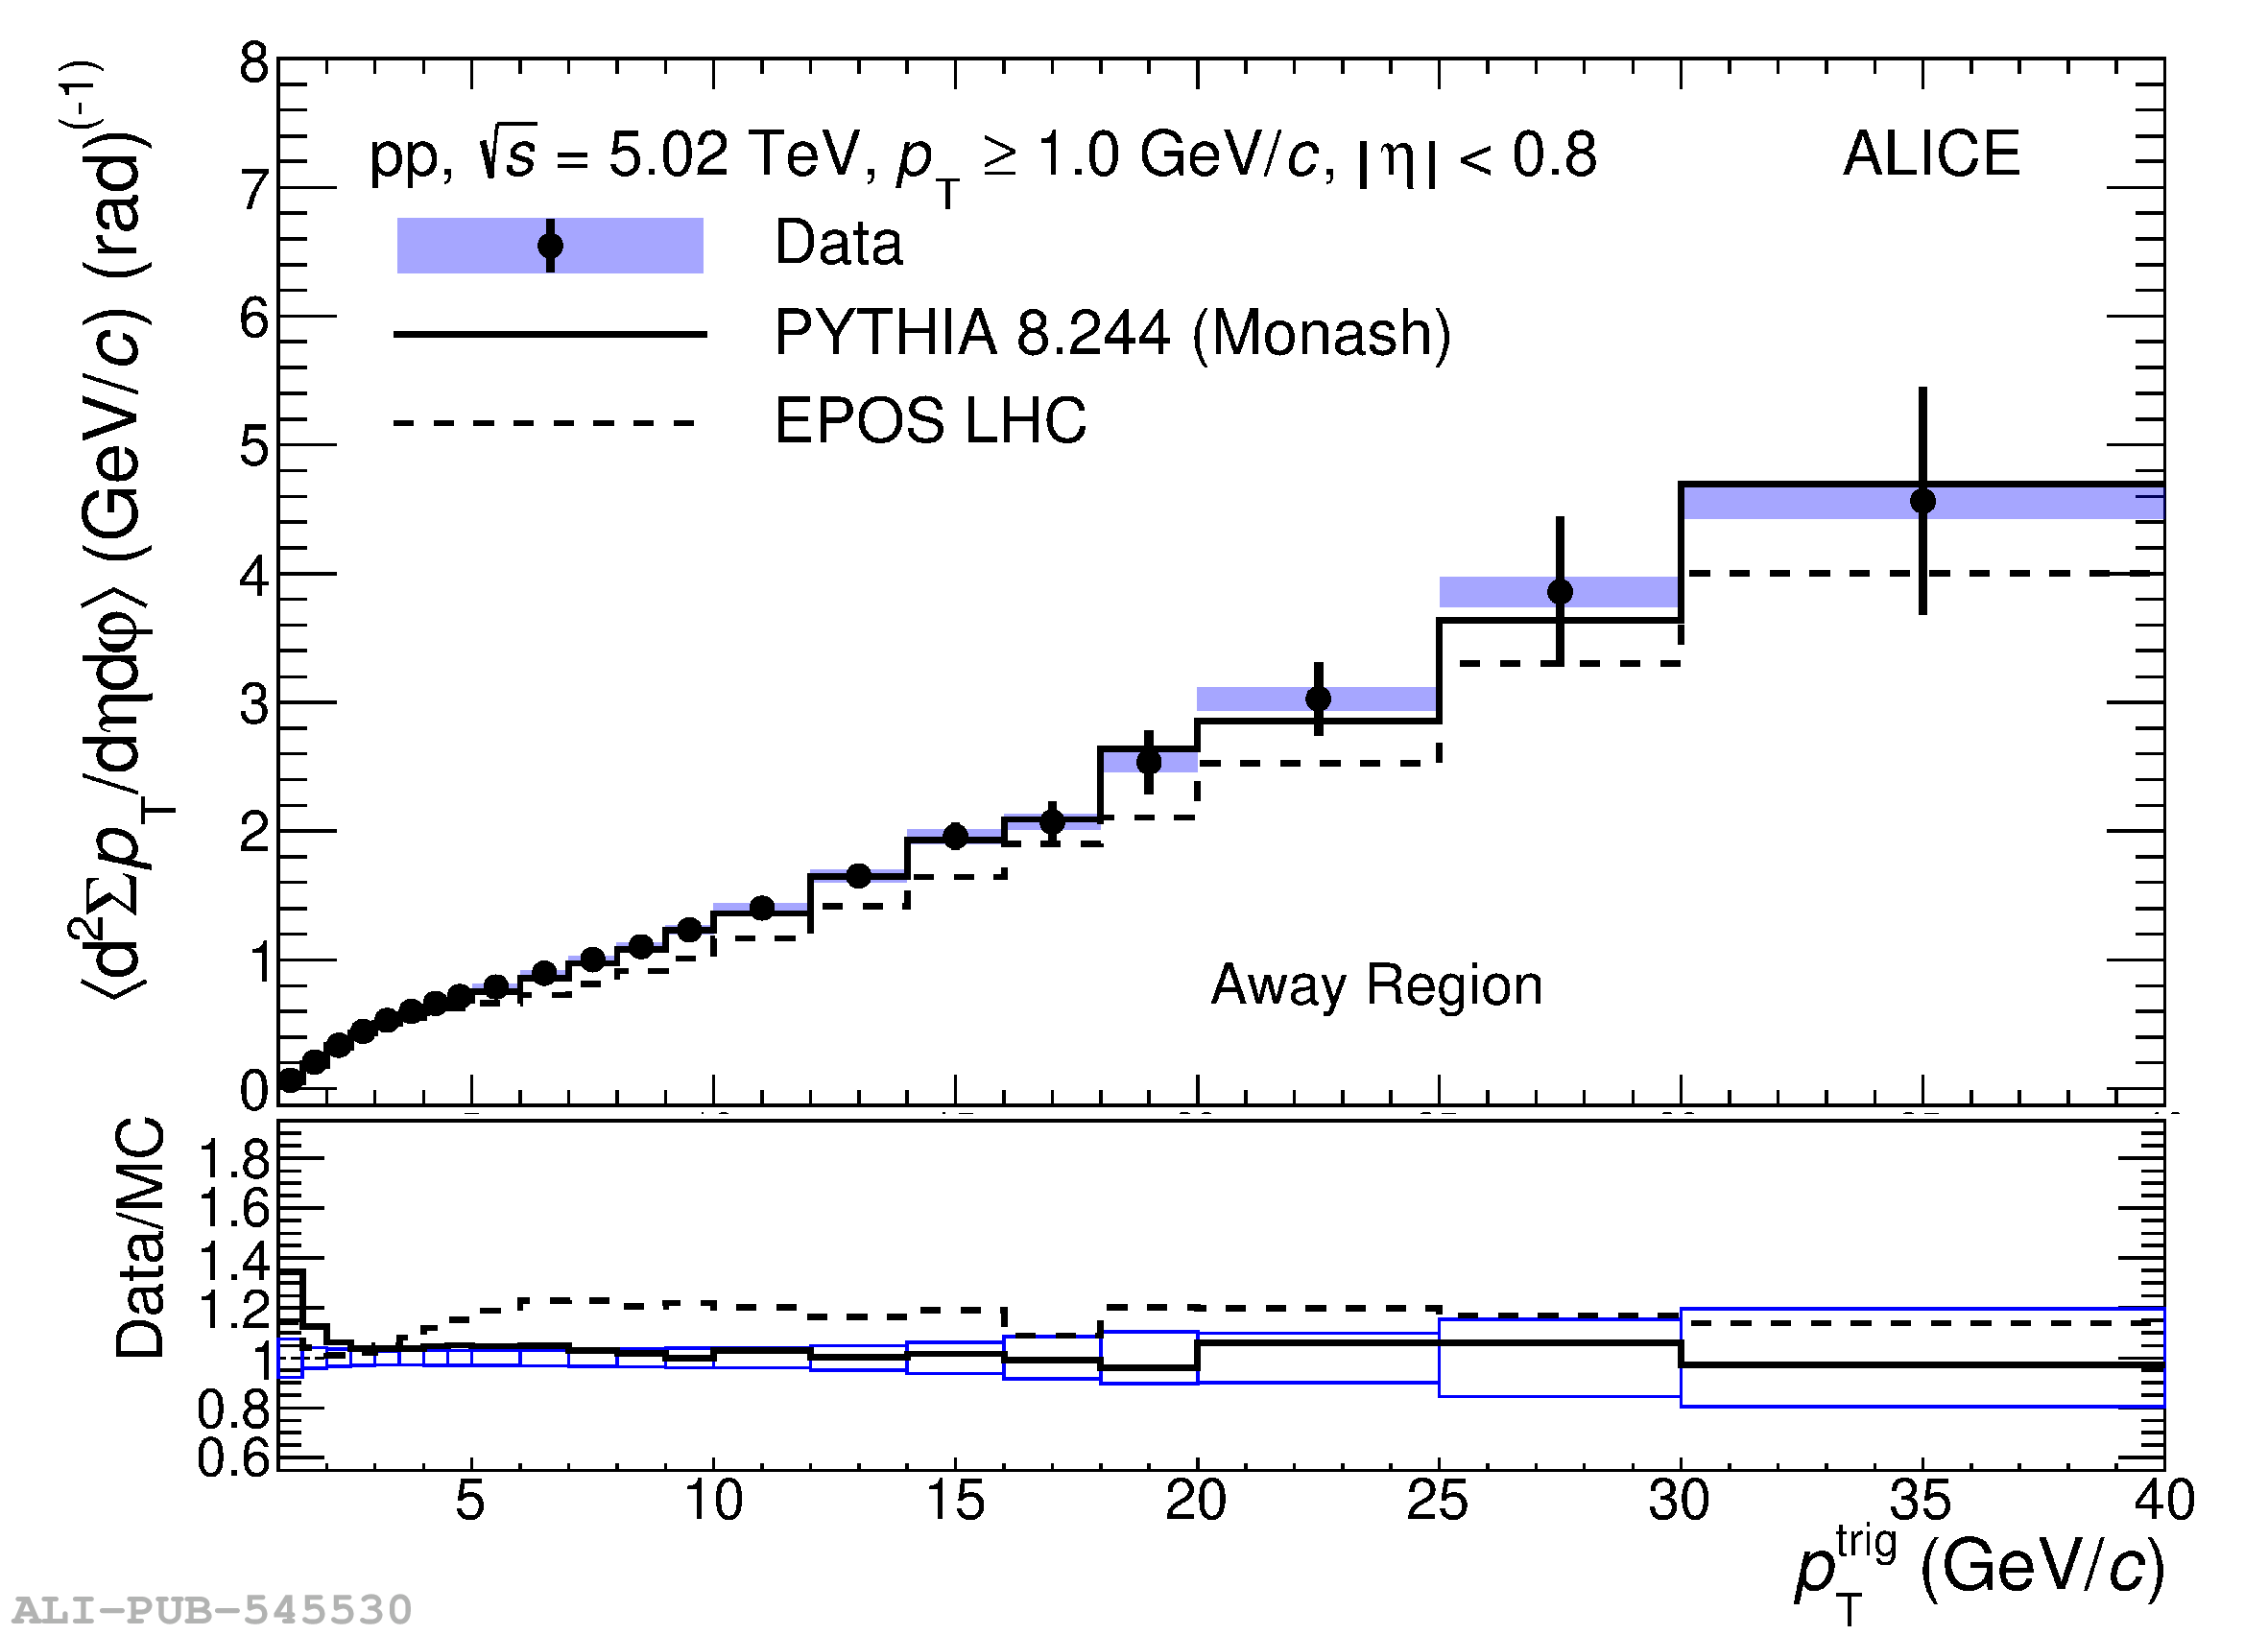 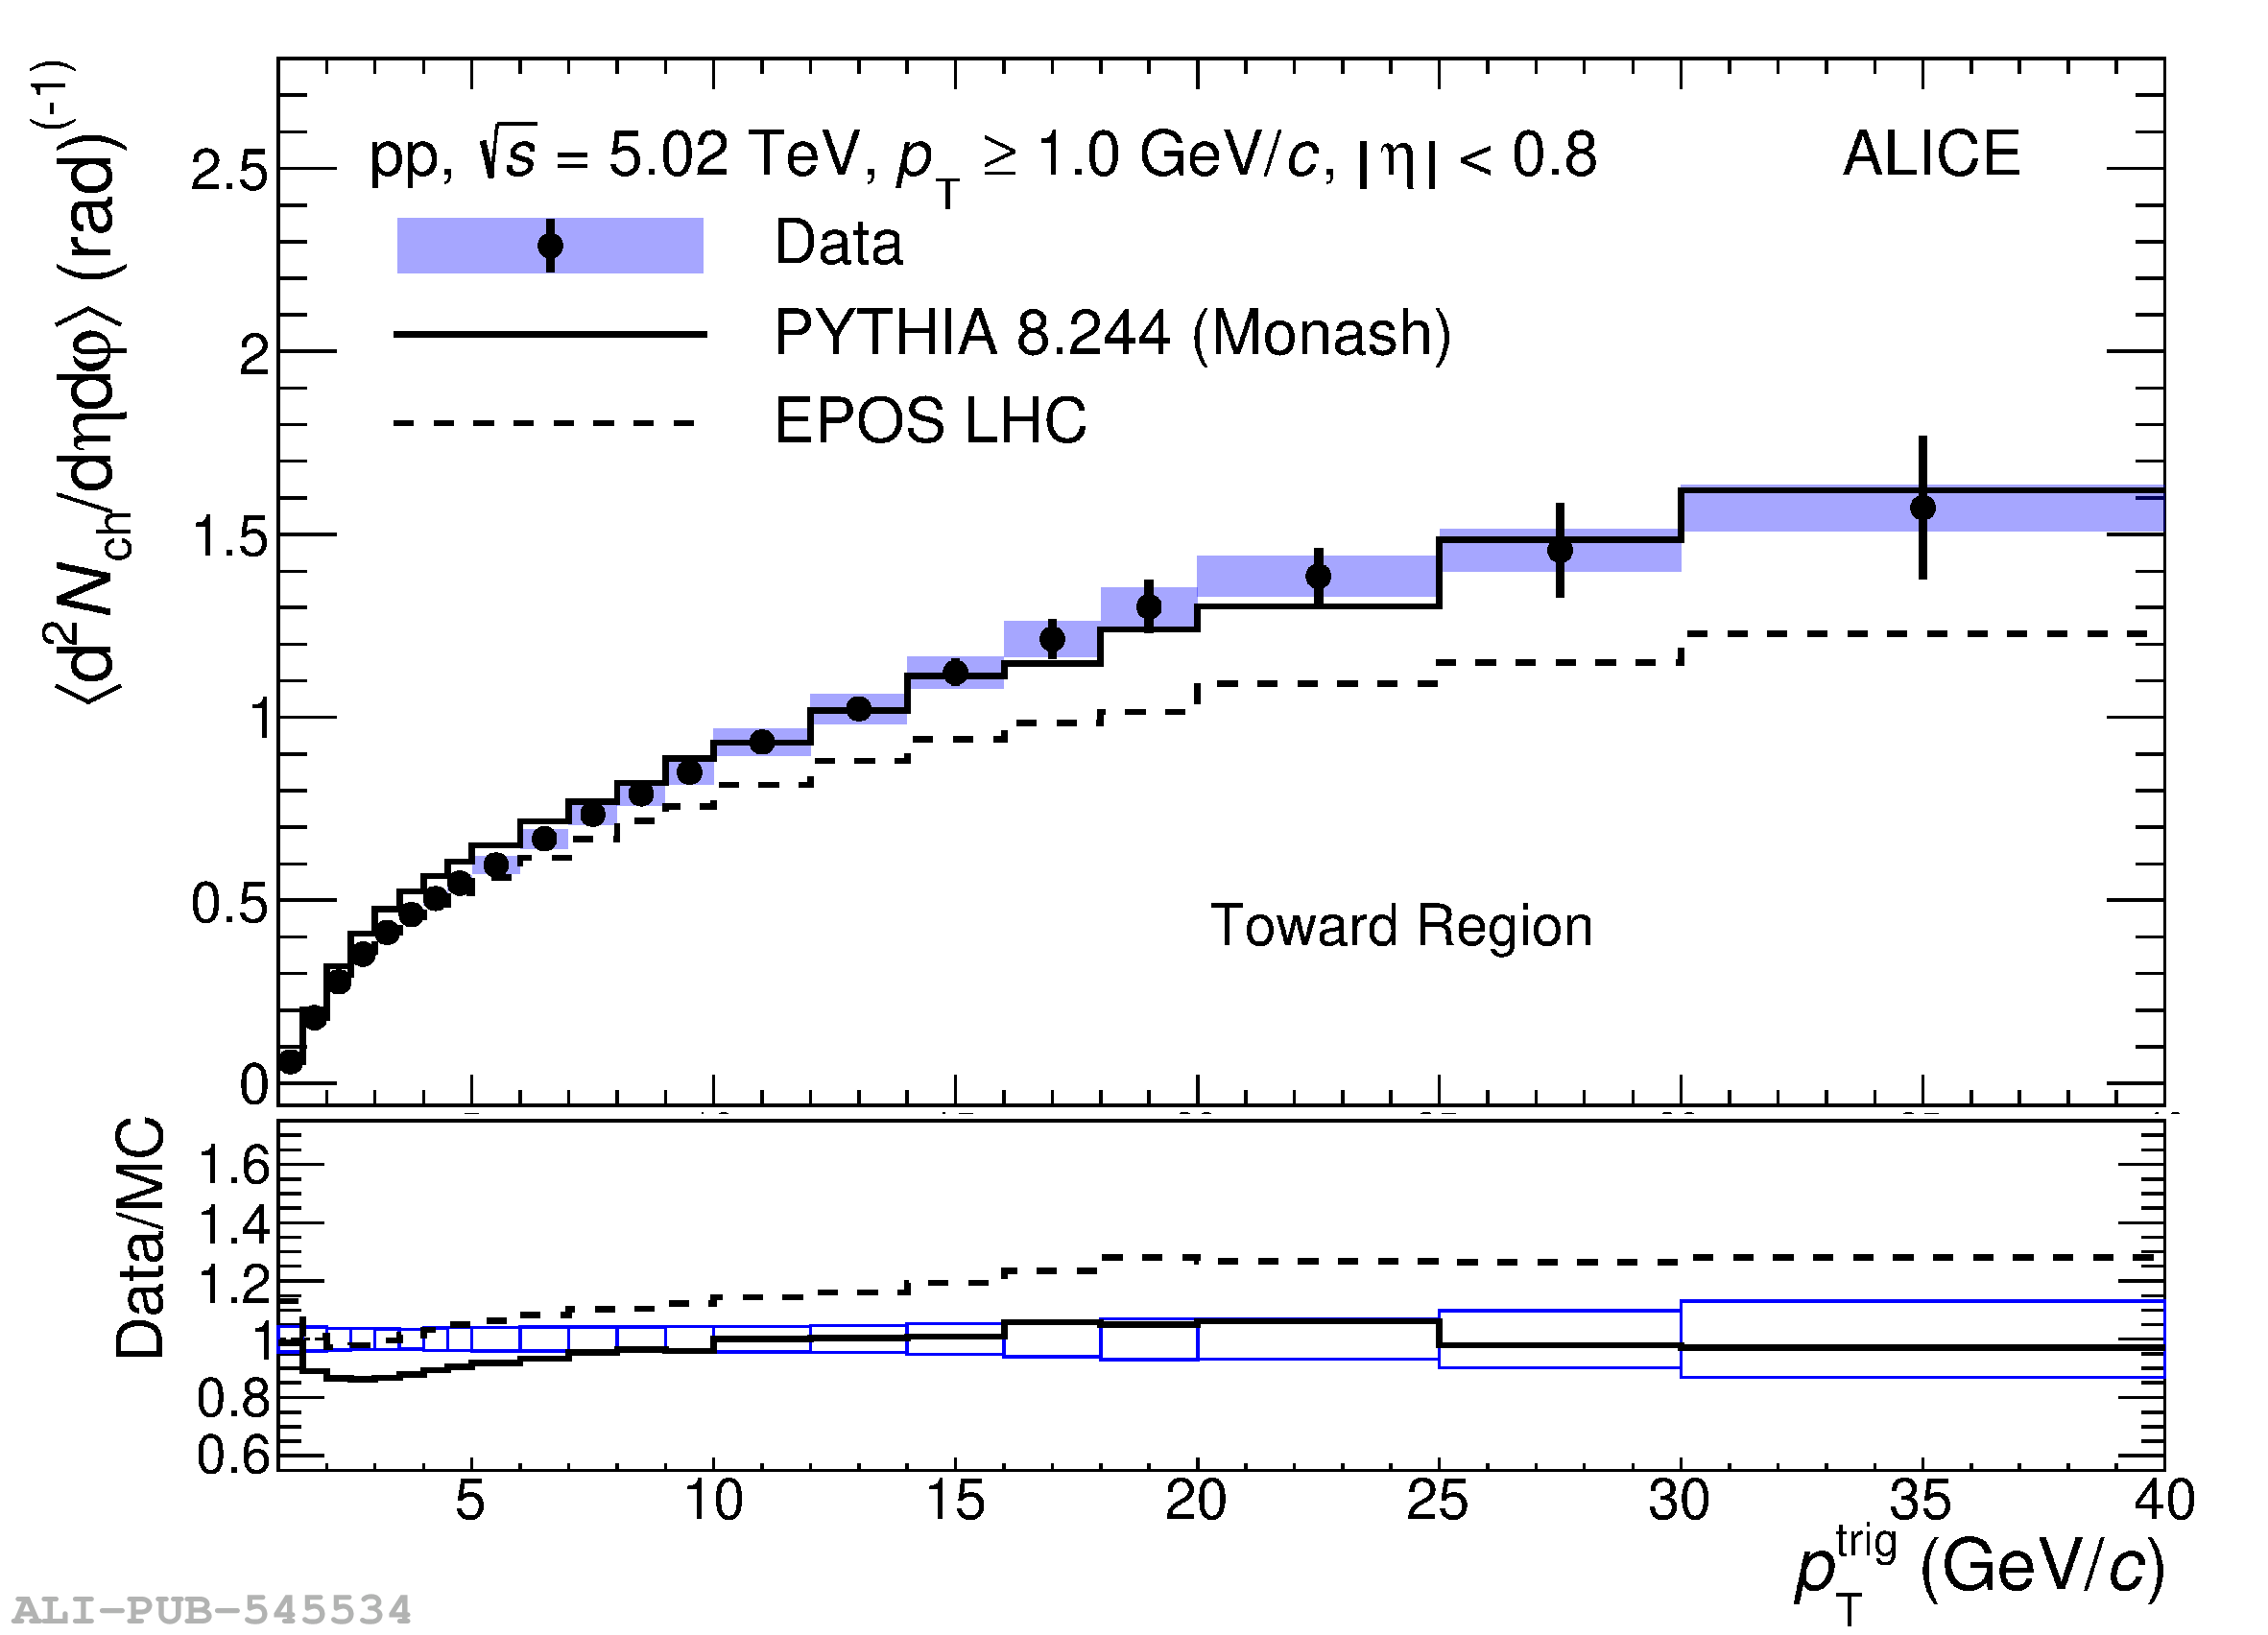 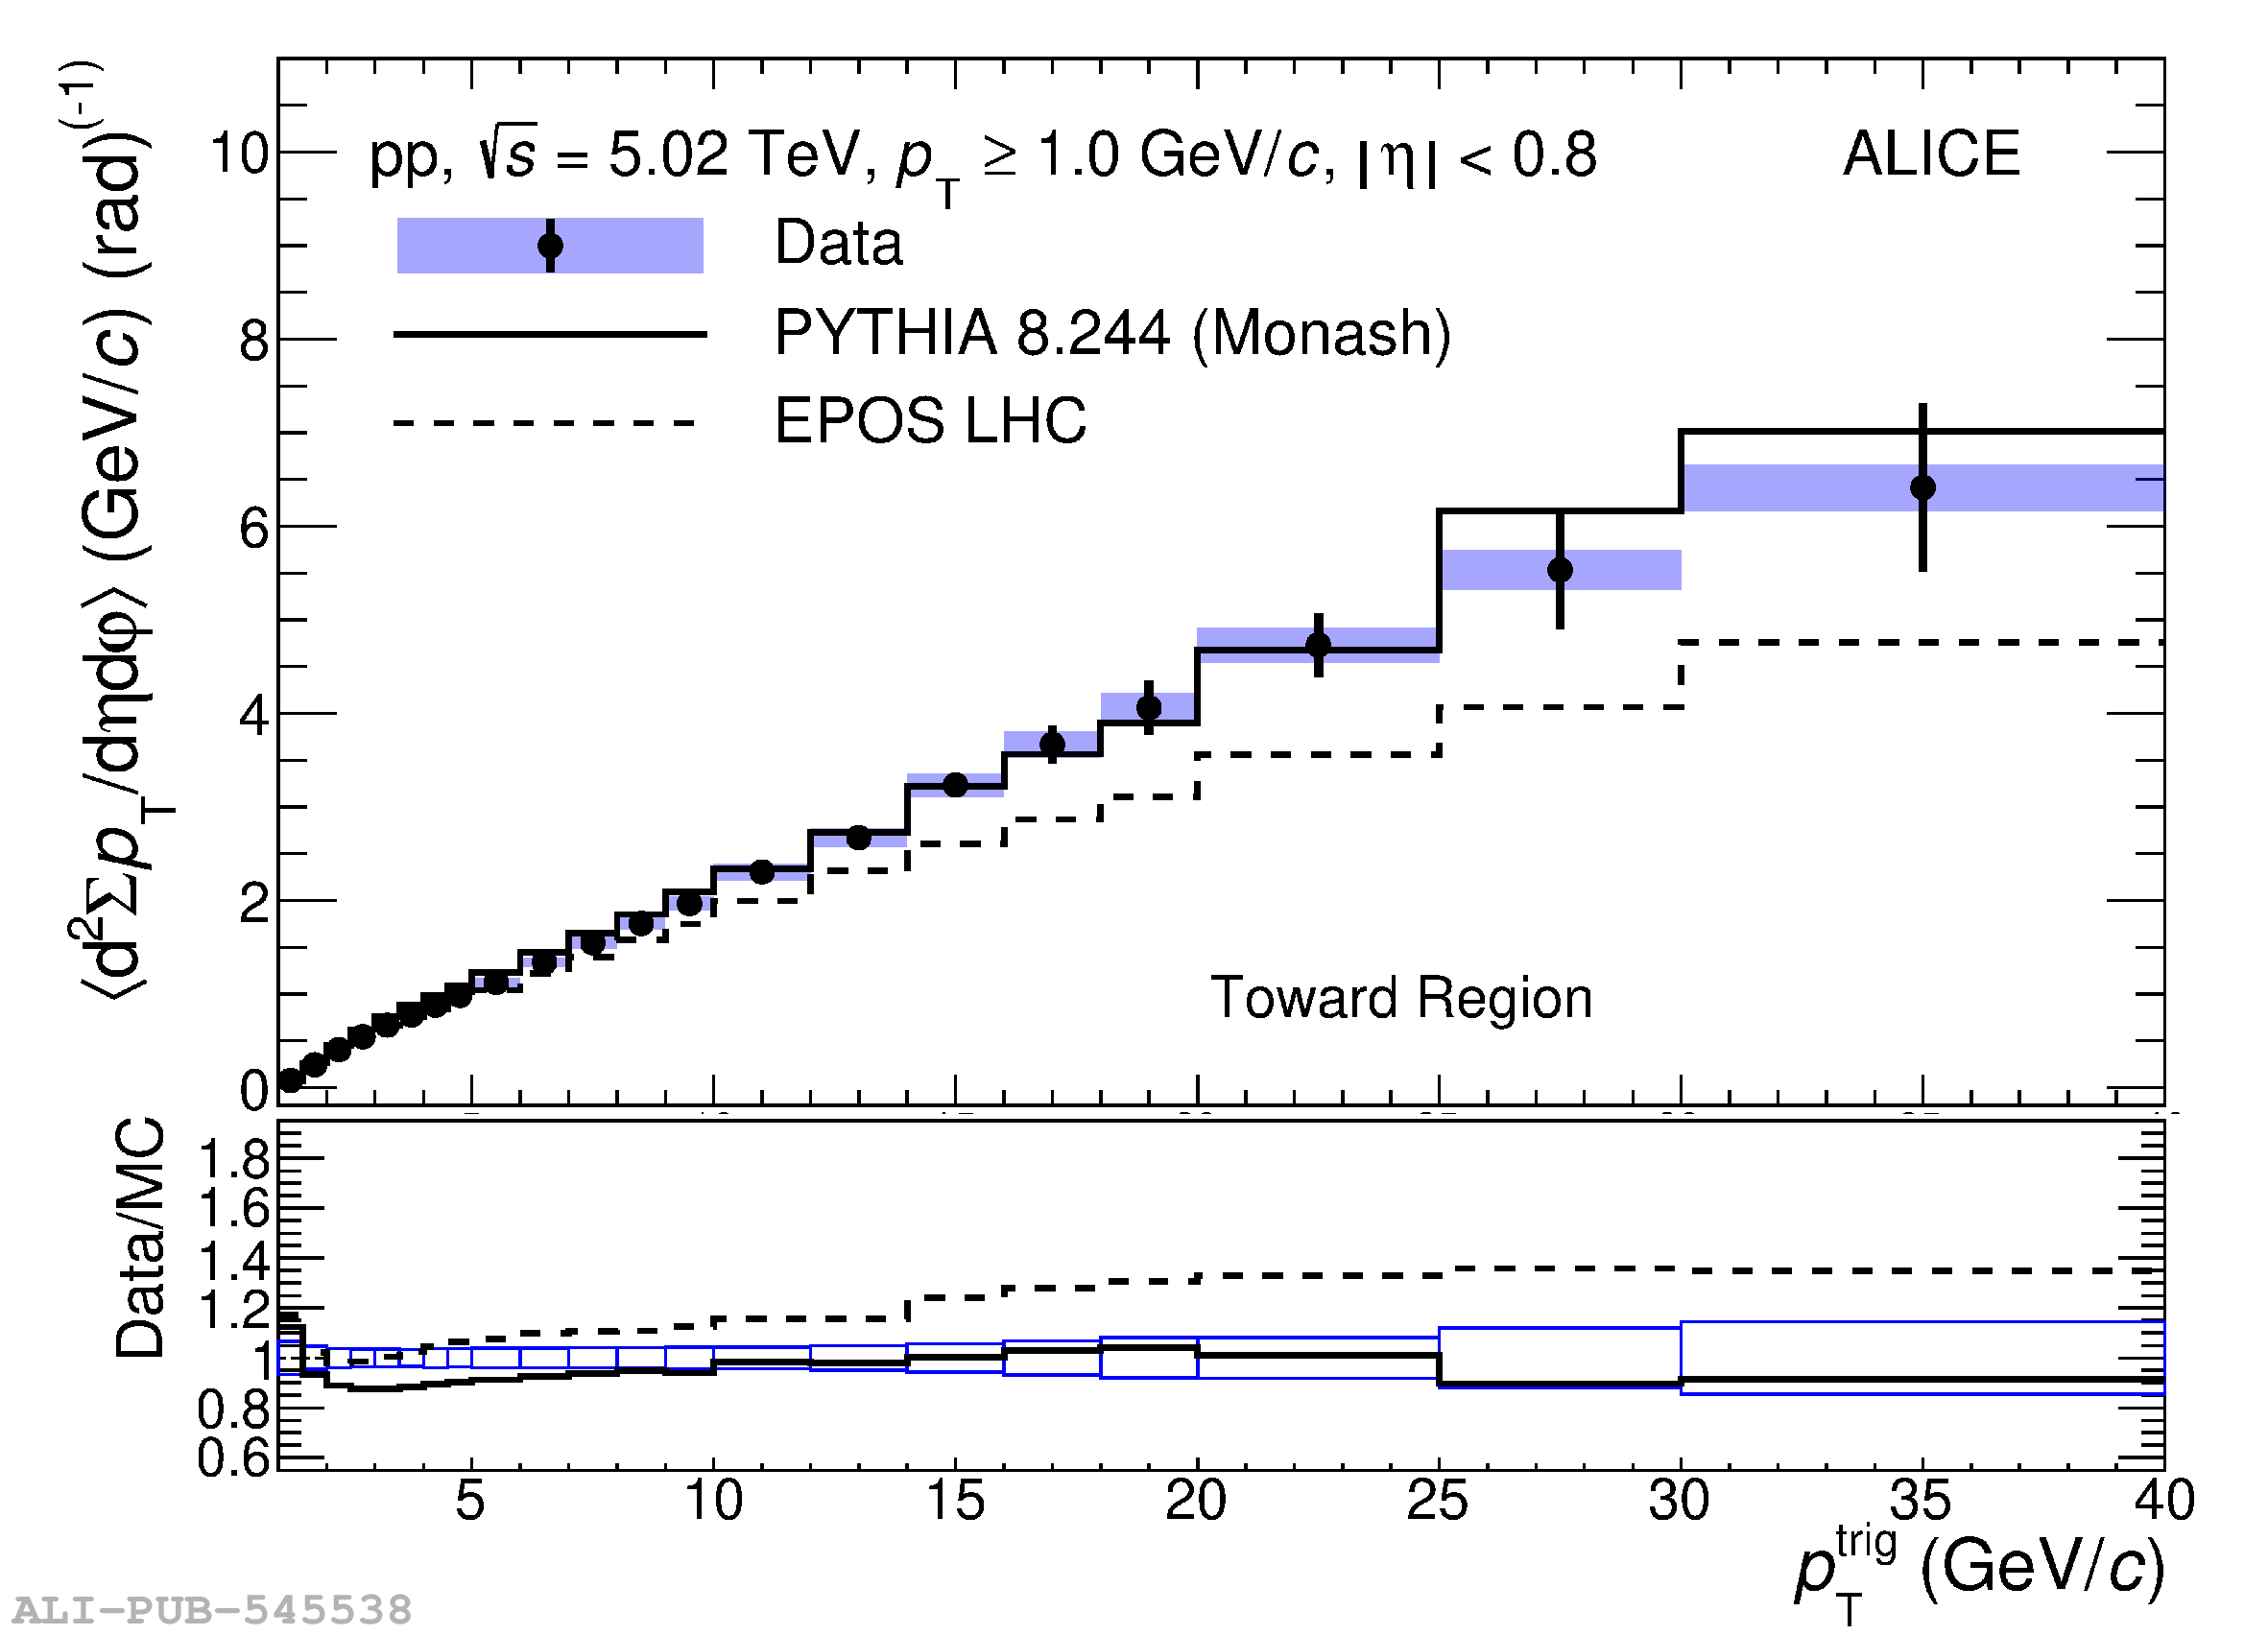 |
Figure A.3
The charged-particle number (left) and summed-$p_{\rm T}$ (right) densities as a function of $p_{\rm T}^{\rm trig}$ in p-Pb collision at $\sqrt{s_{\rm NN}}=5.02$ TeV are displayed. Results for the transverse (top), away (middle), and toward (bottom) regions were obtained for the transverse momentum threshold $\pt>0.15$ GeV/$c$. The shaded area and the error bars around the data points represent the systematic and statistical uncertainties, respectively. Data are compared with PYTHIA 8/Angantyr (solid line) and EPOS LHC (dashed line) predictions. The data-to-model ratios are displayed in the bottom panel of each plot. The boxes around unity represent the statistical and systematic uncertainties added in quadrature. | 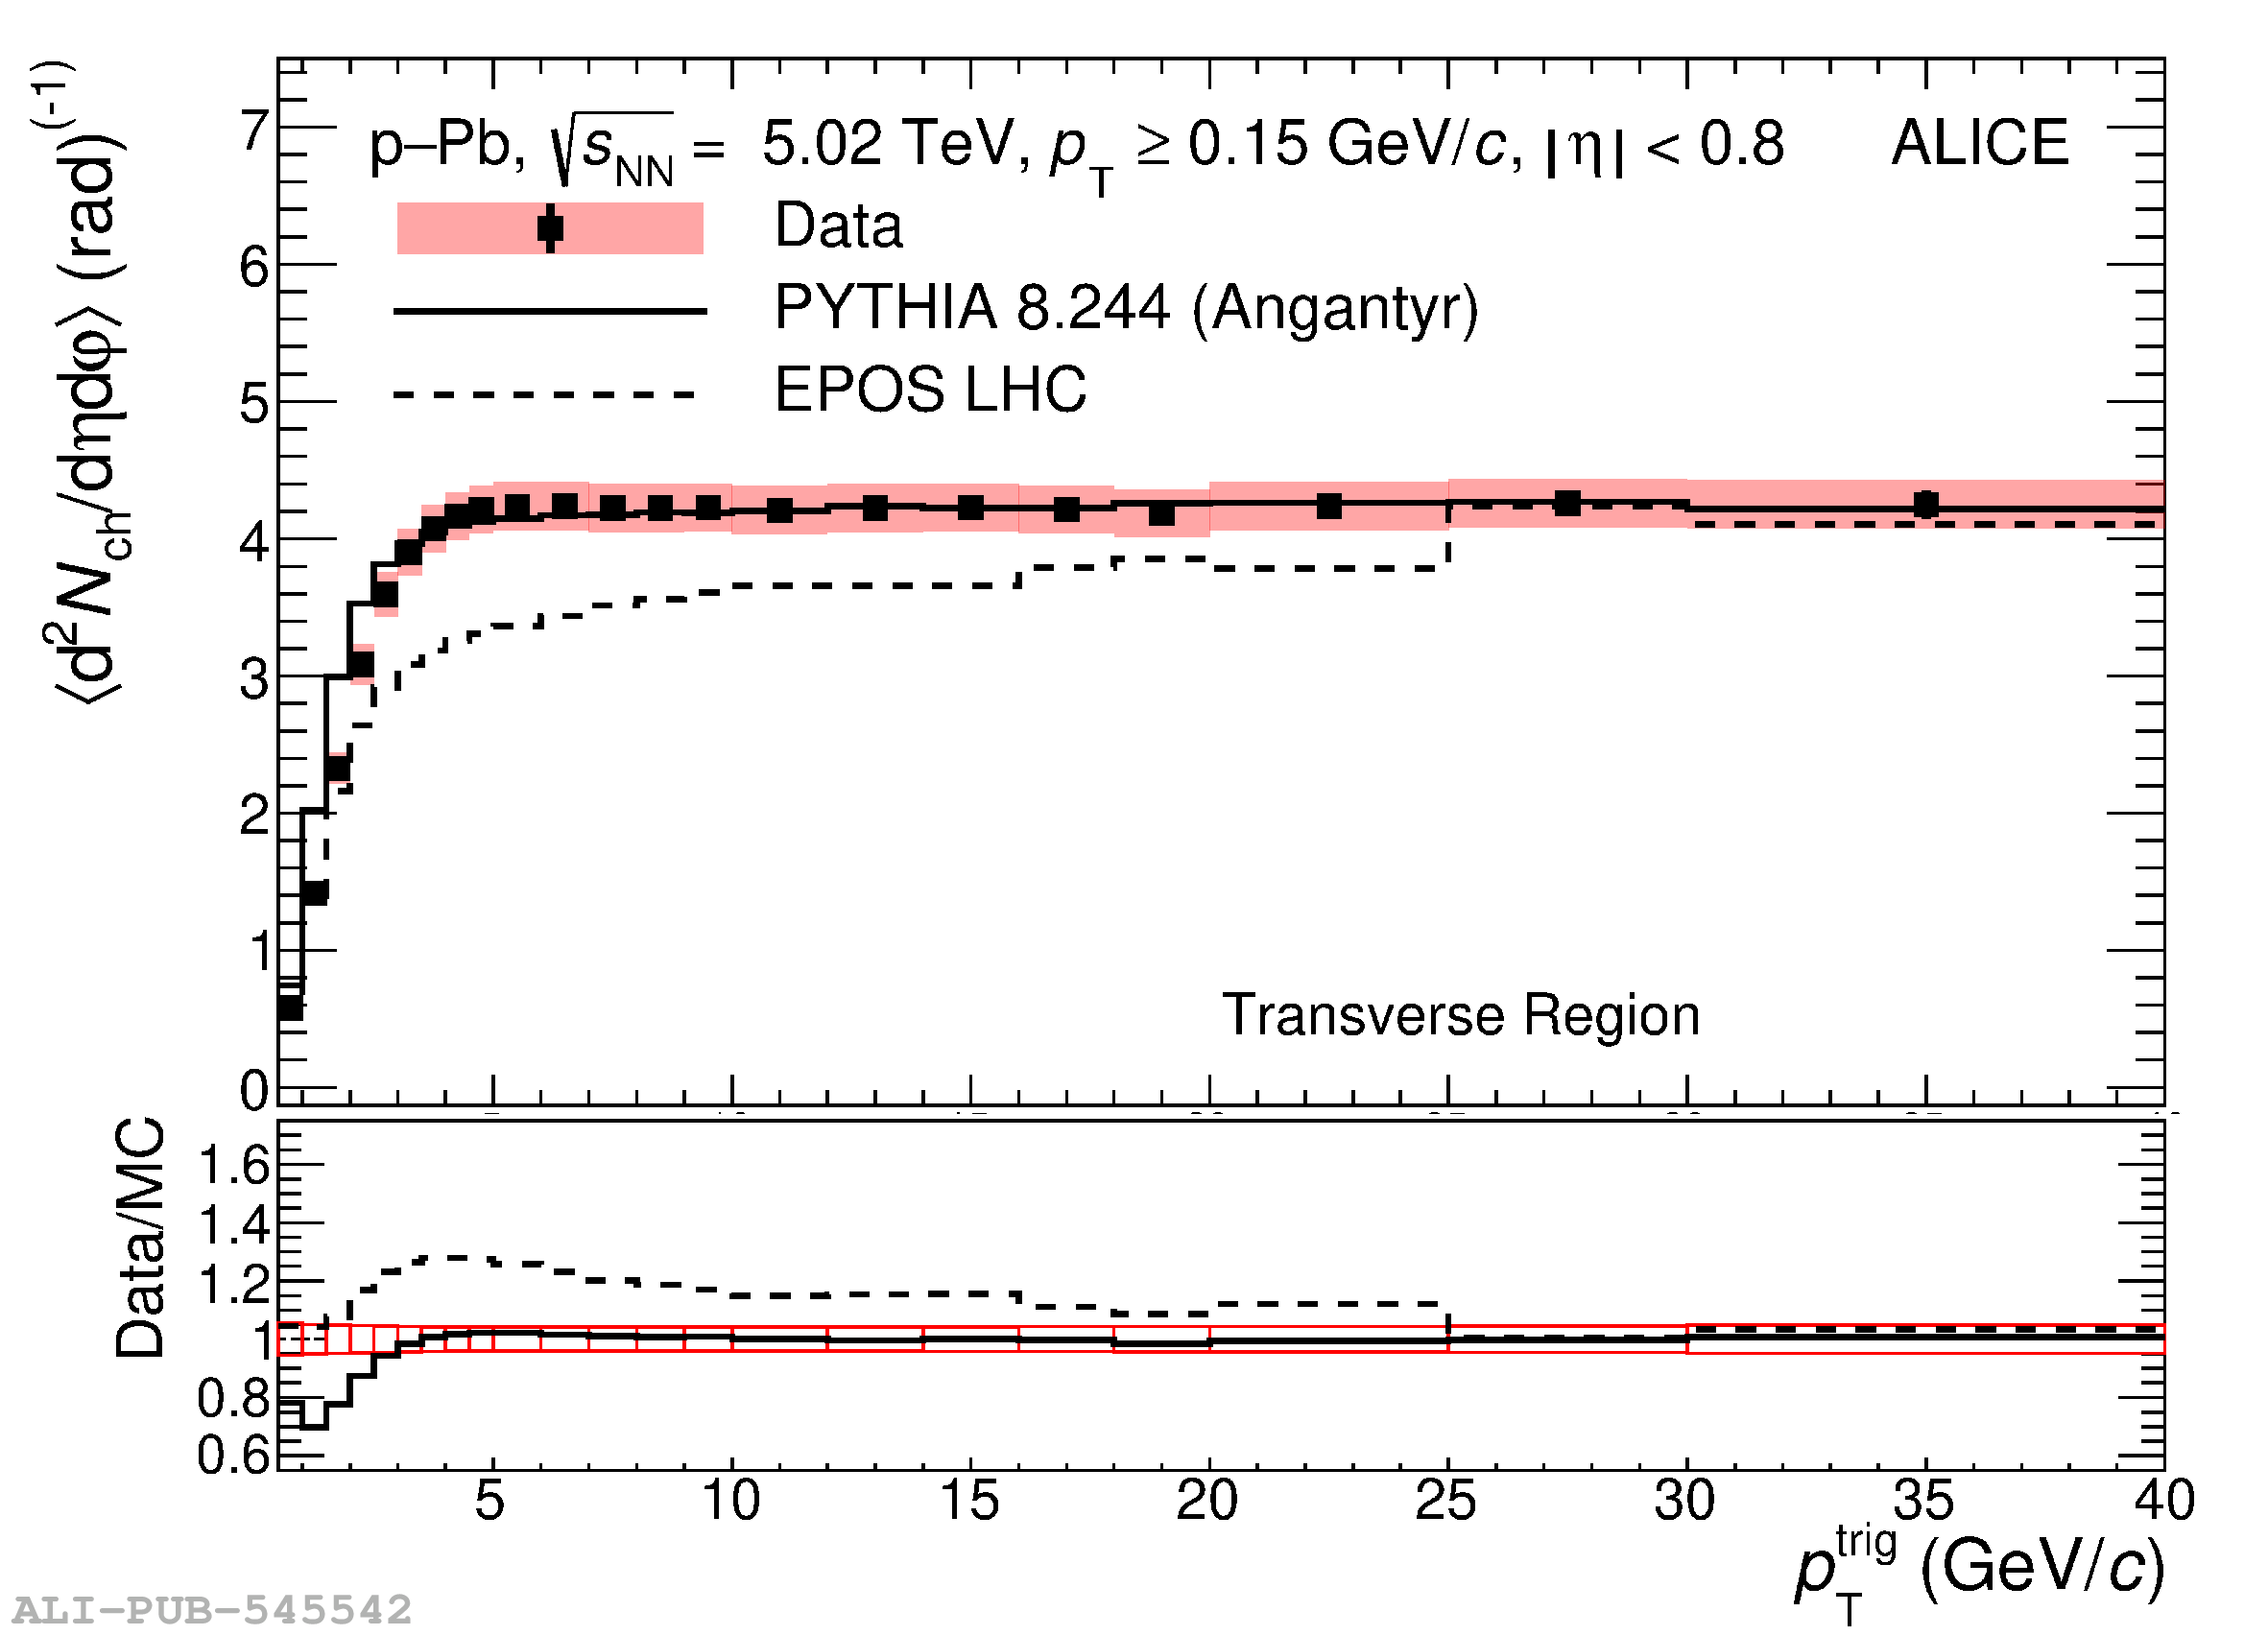 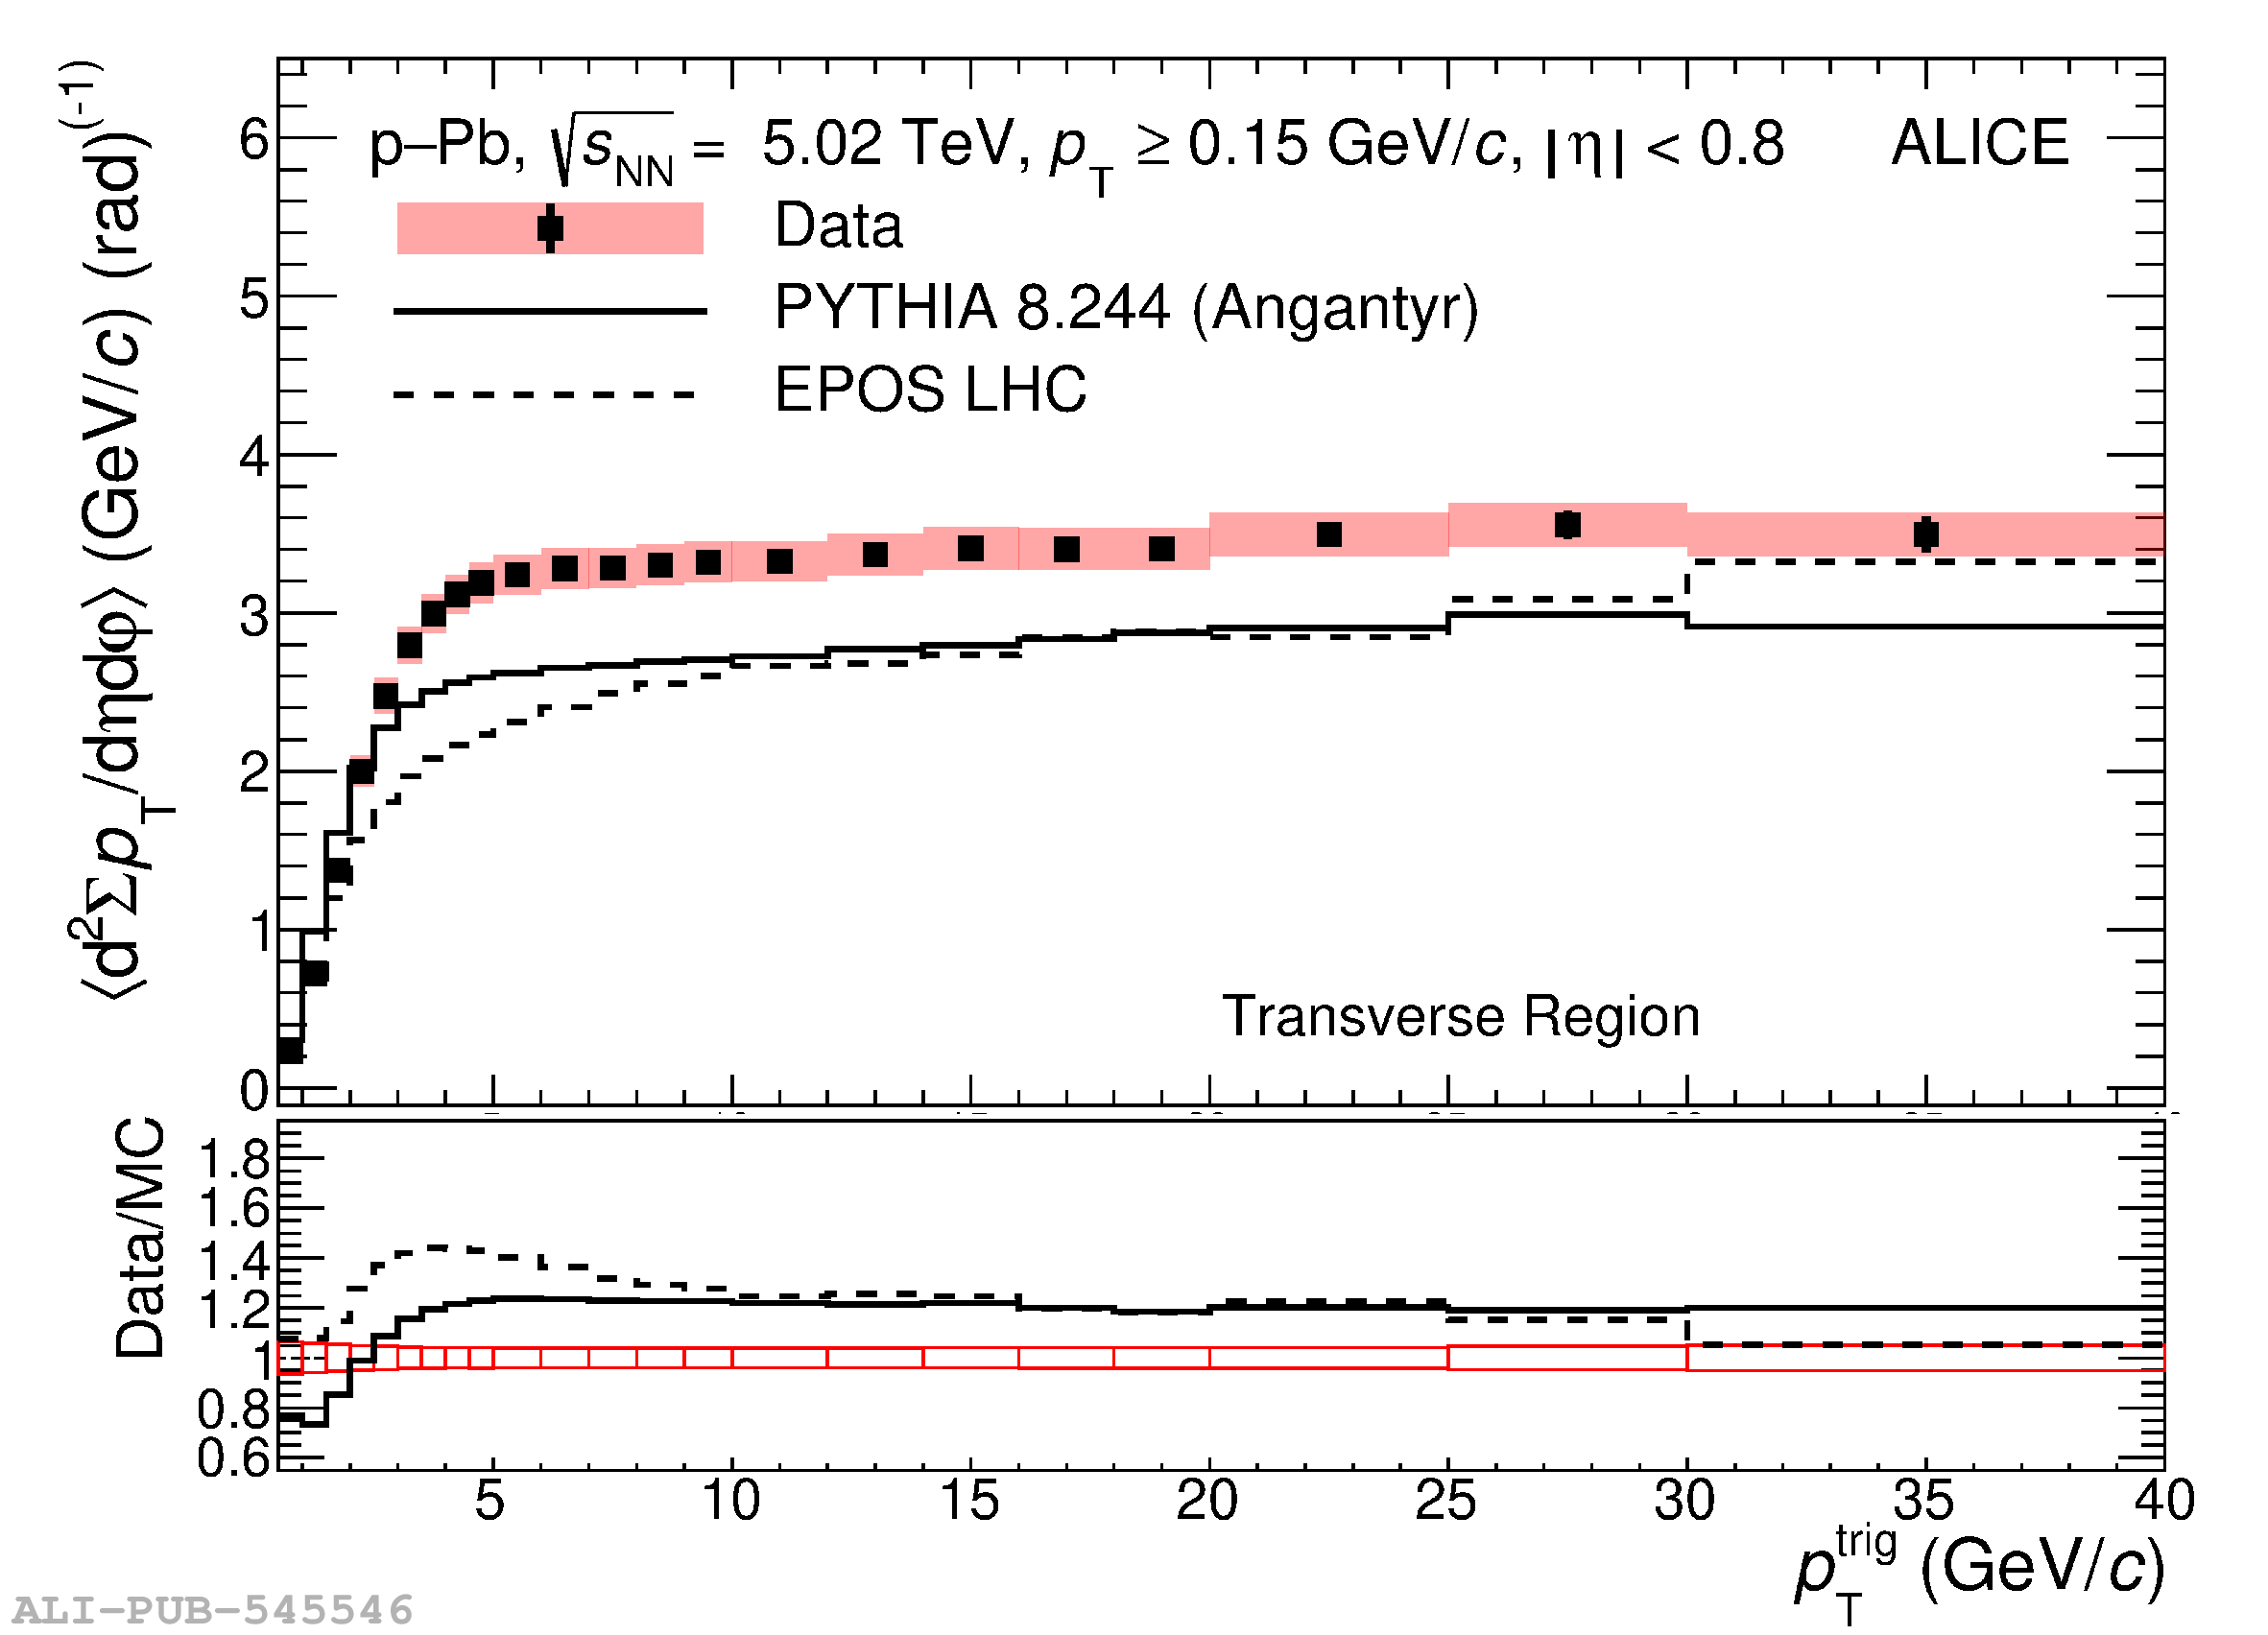 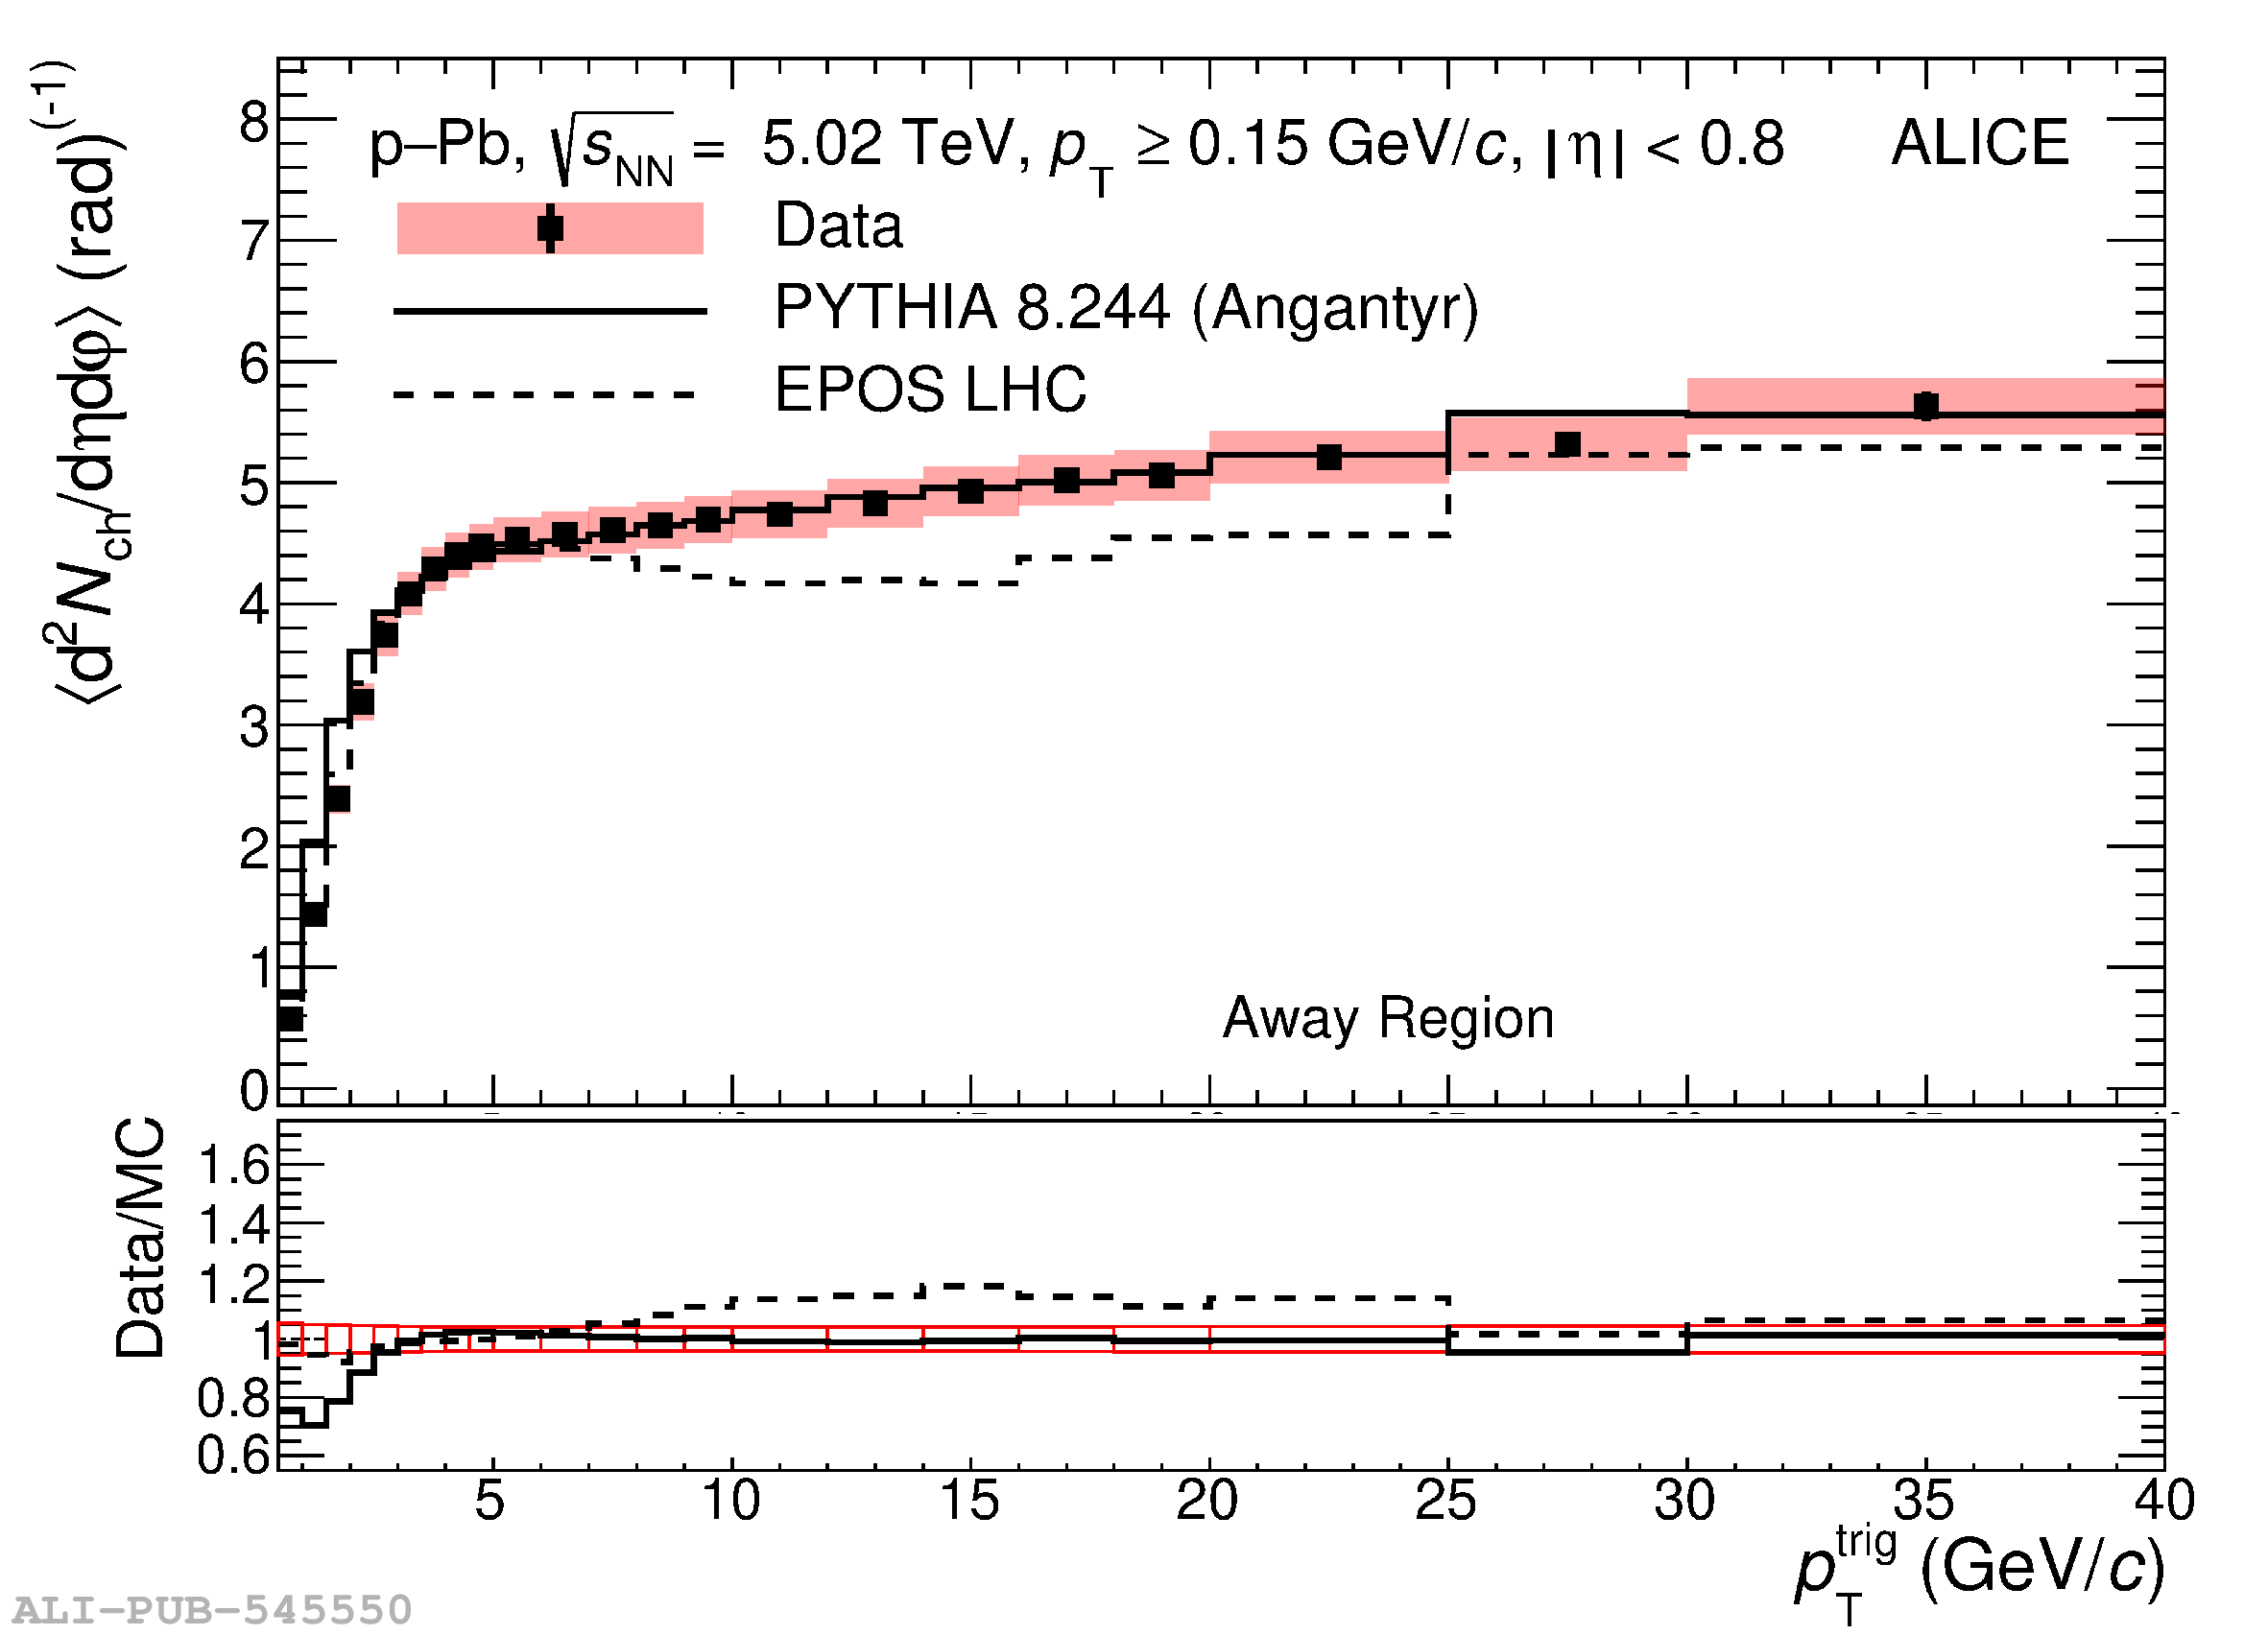 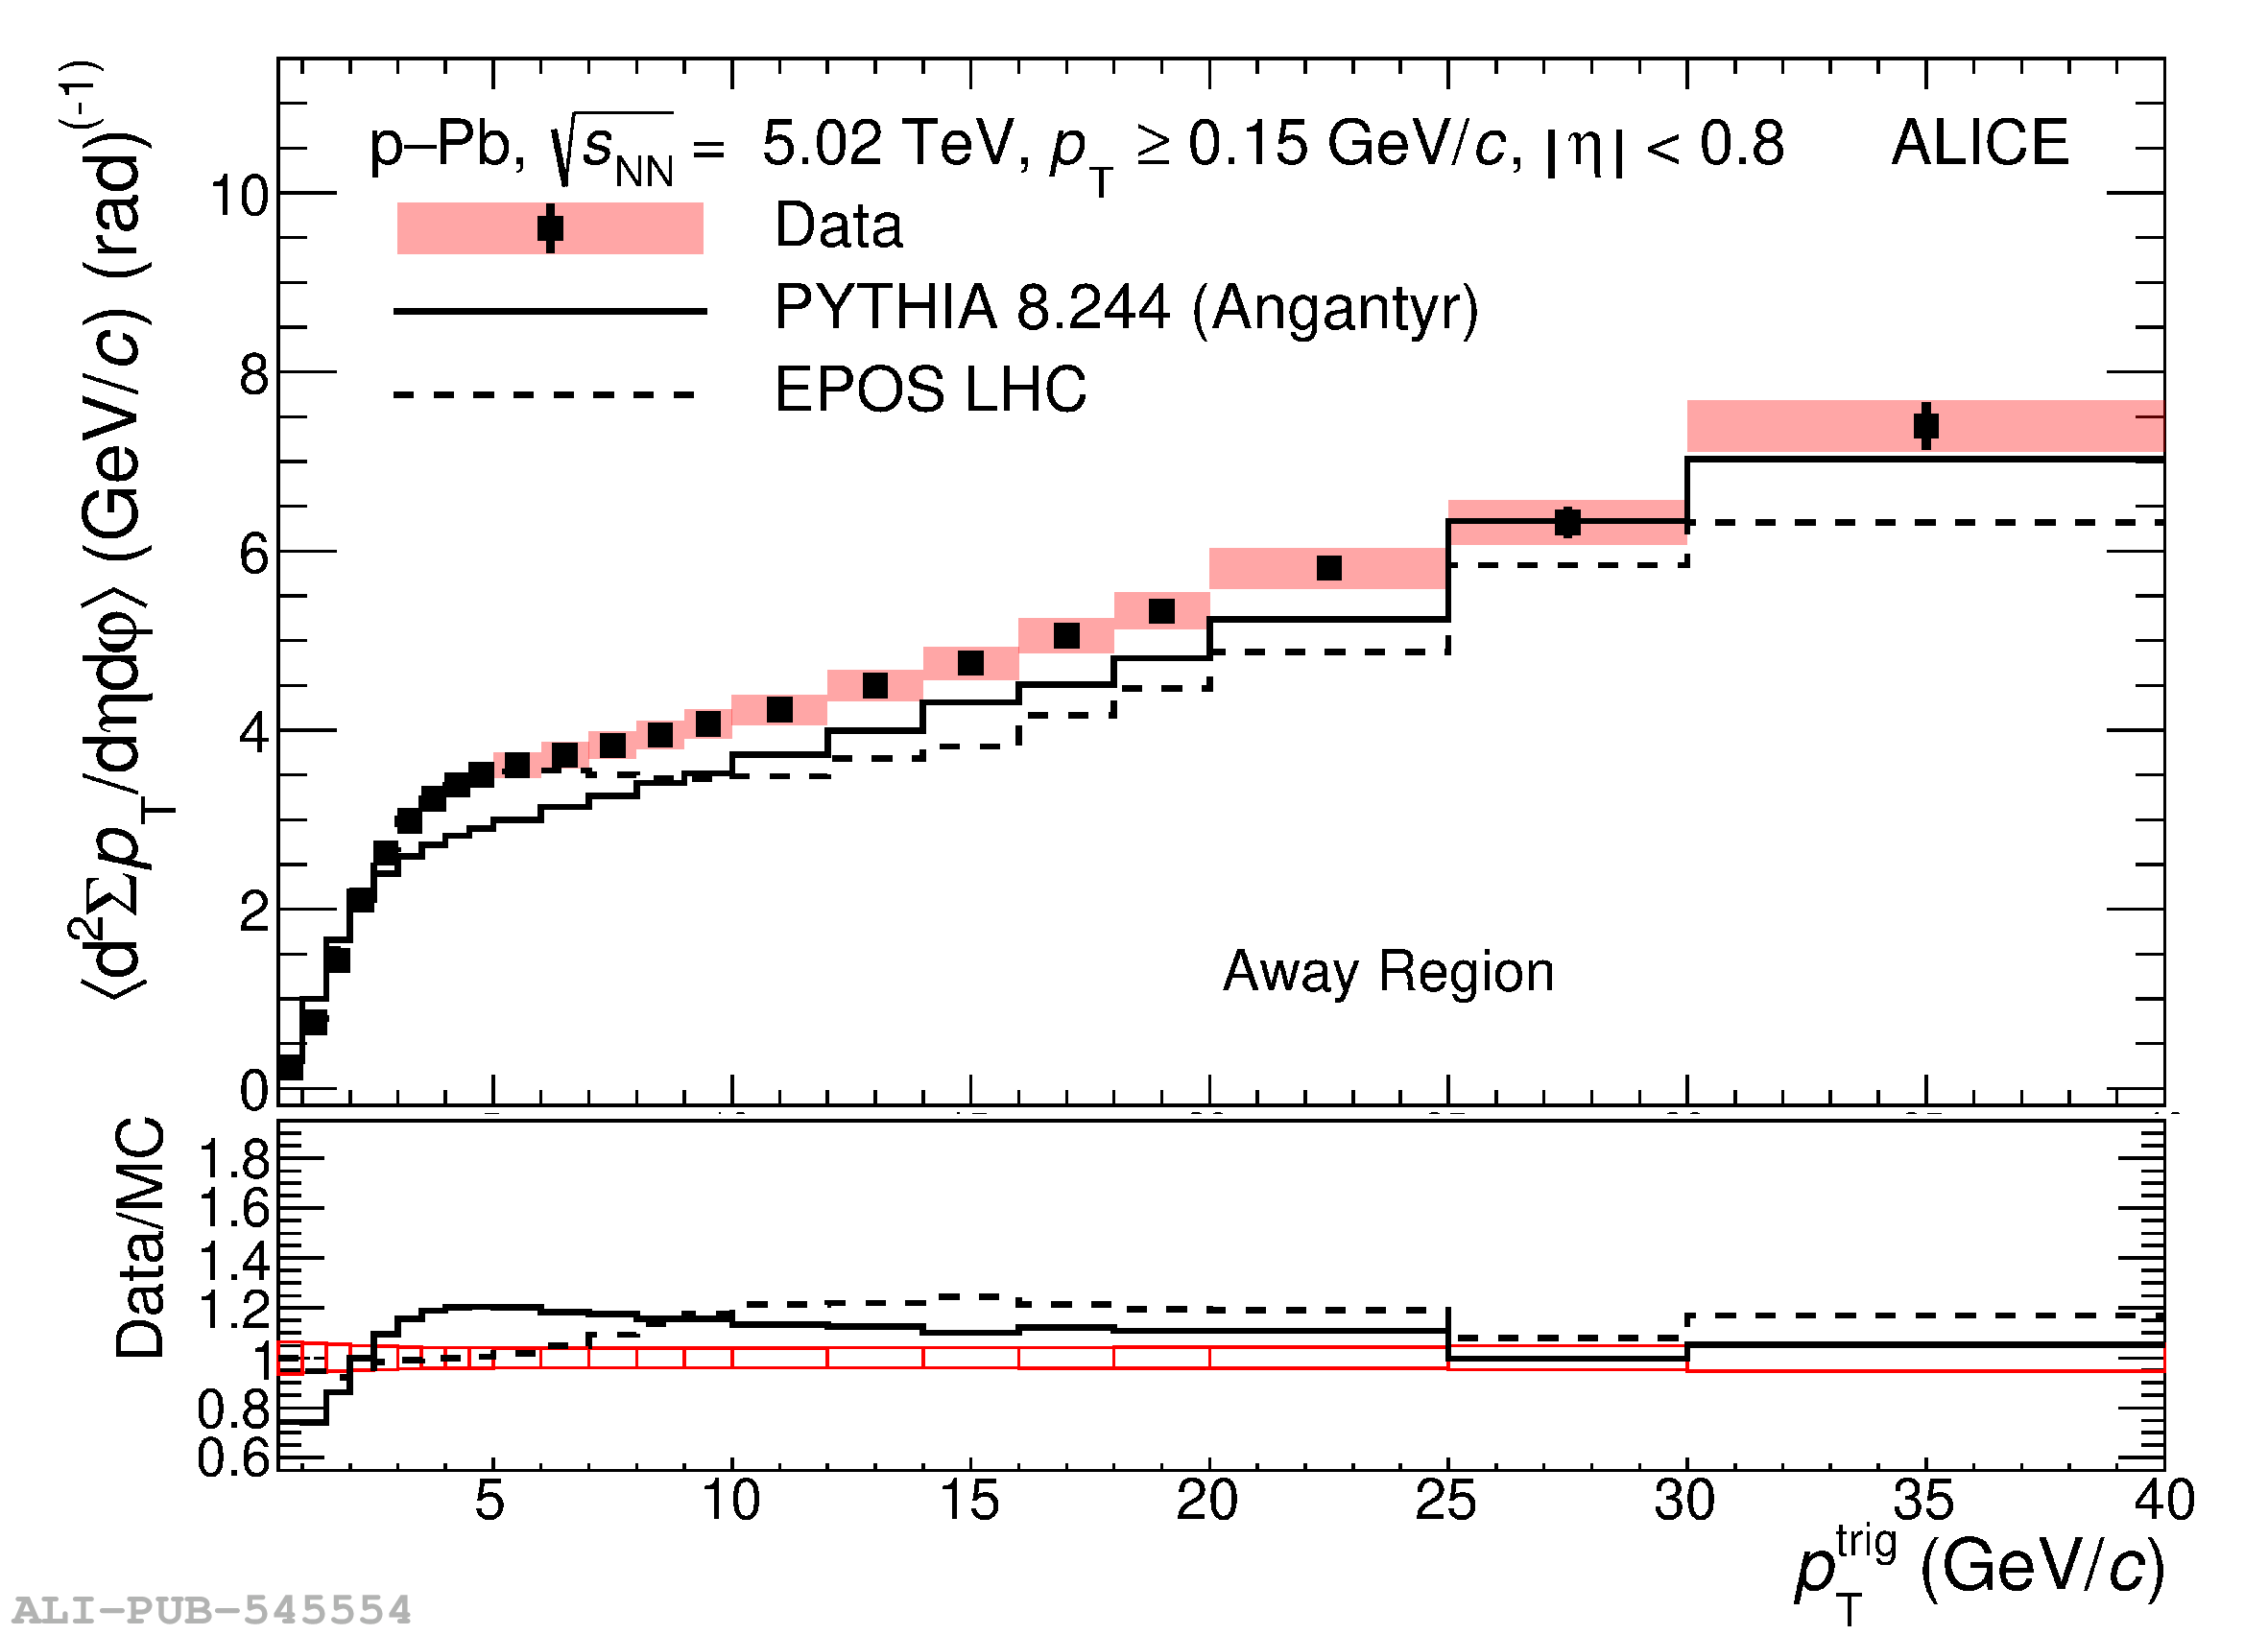 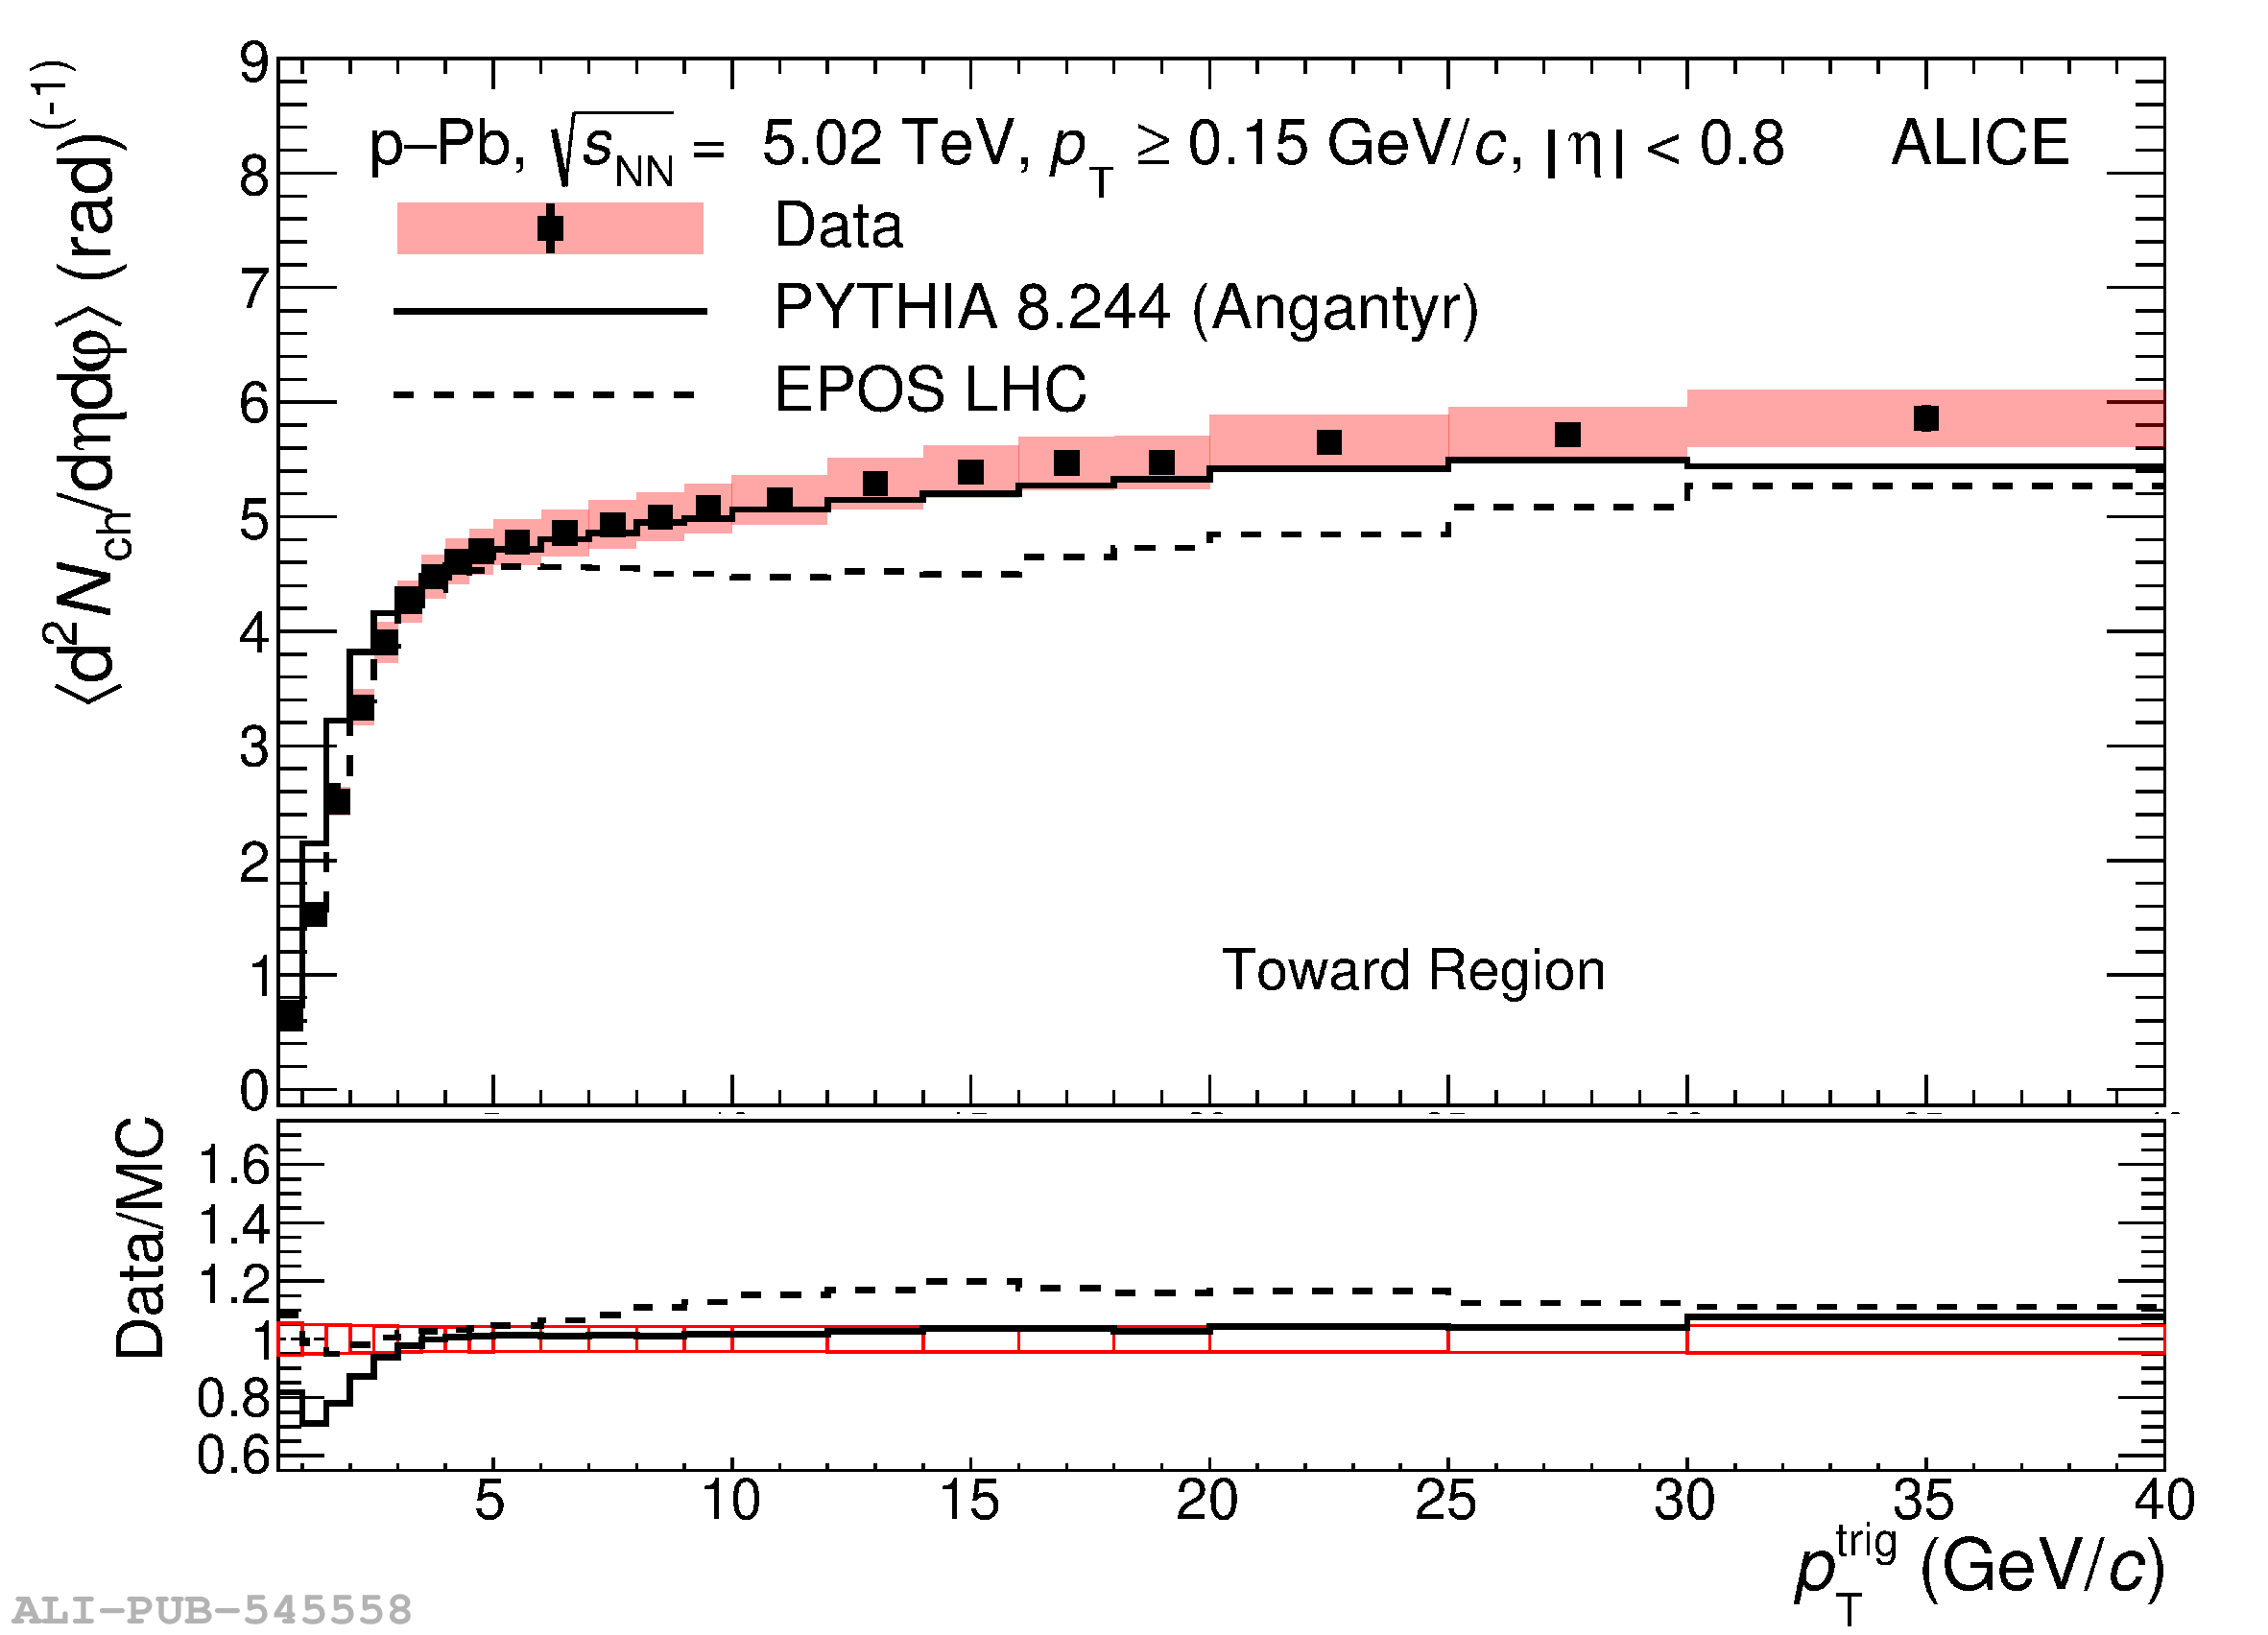 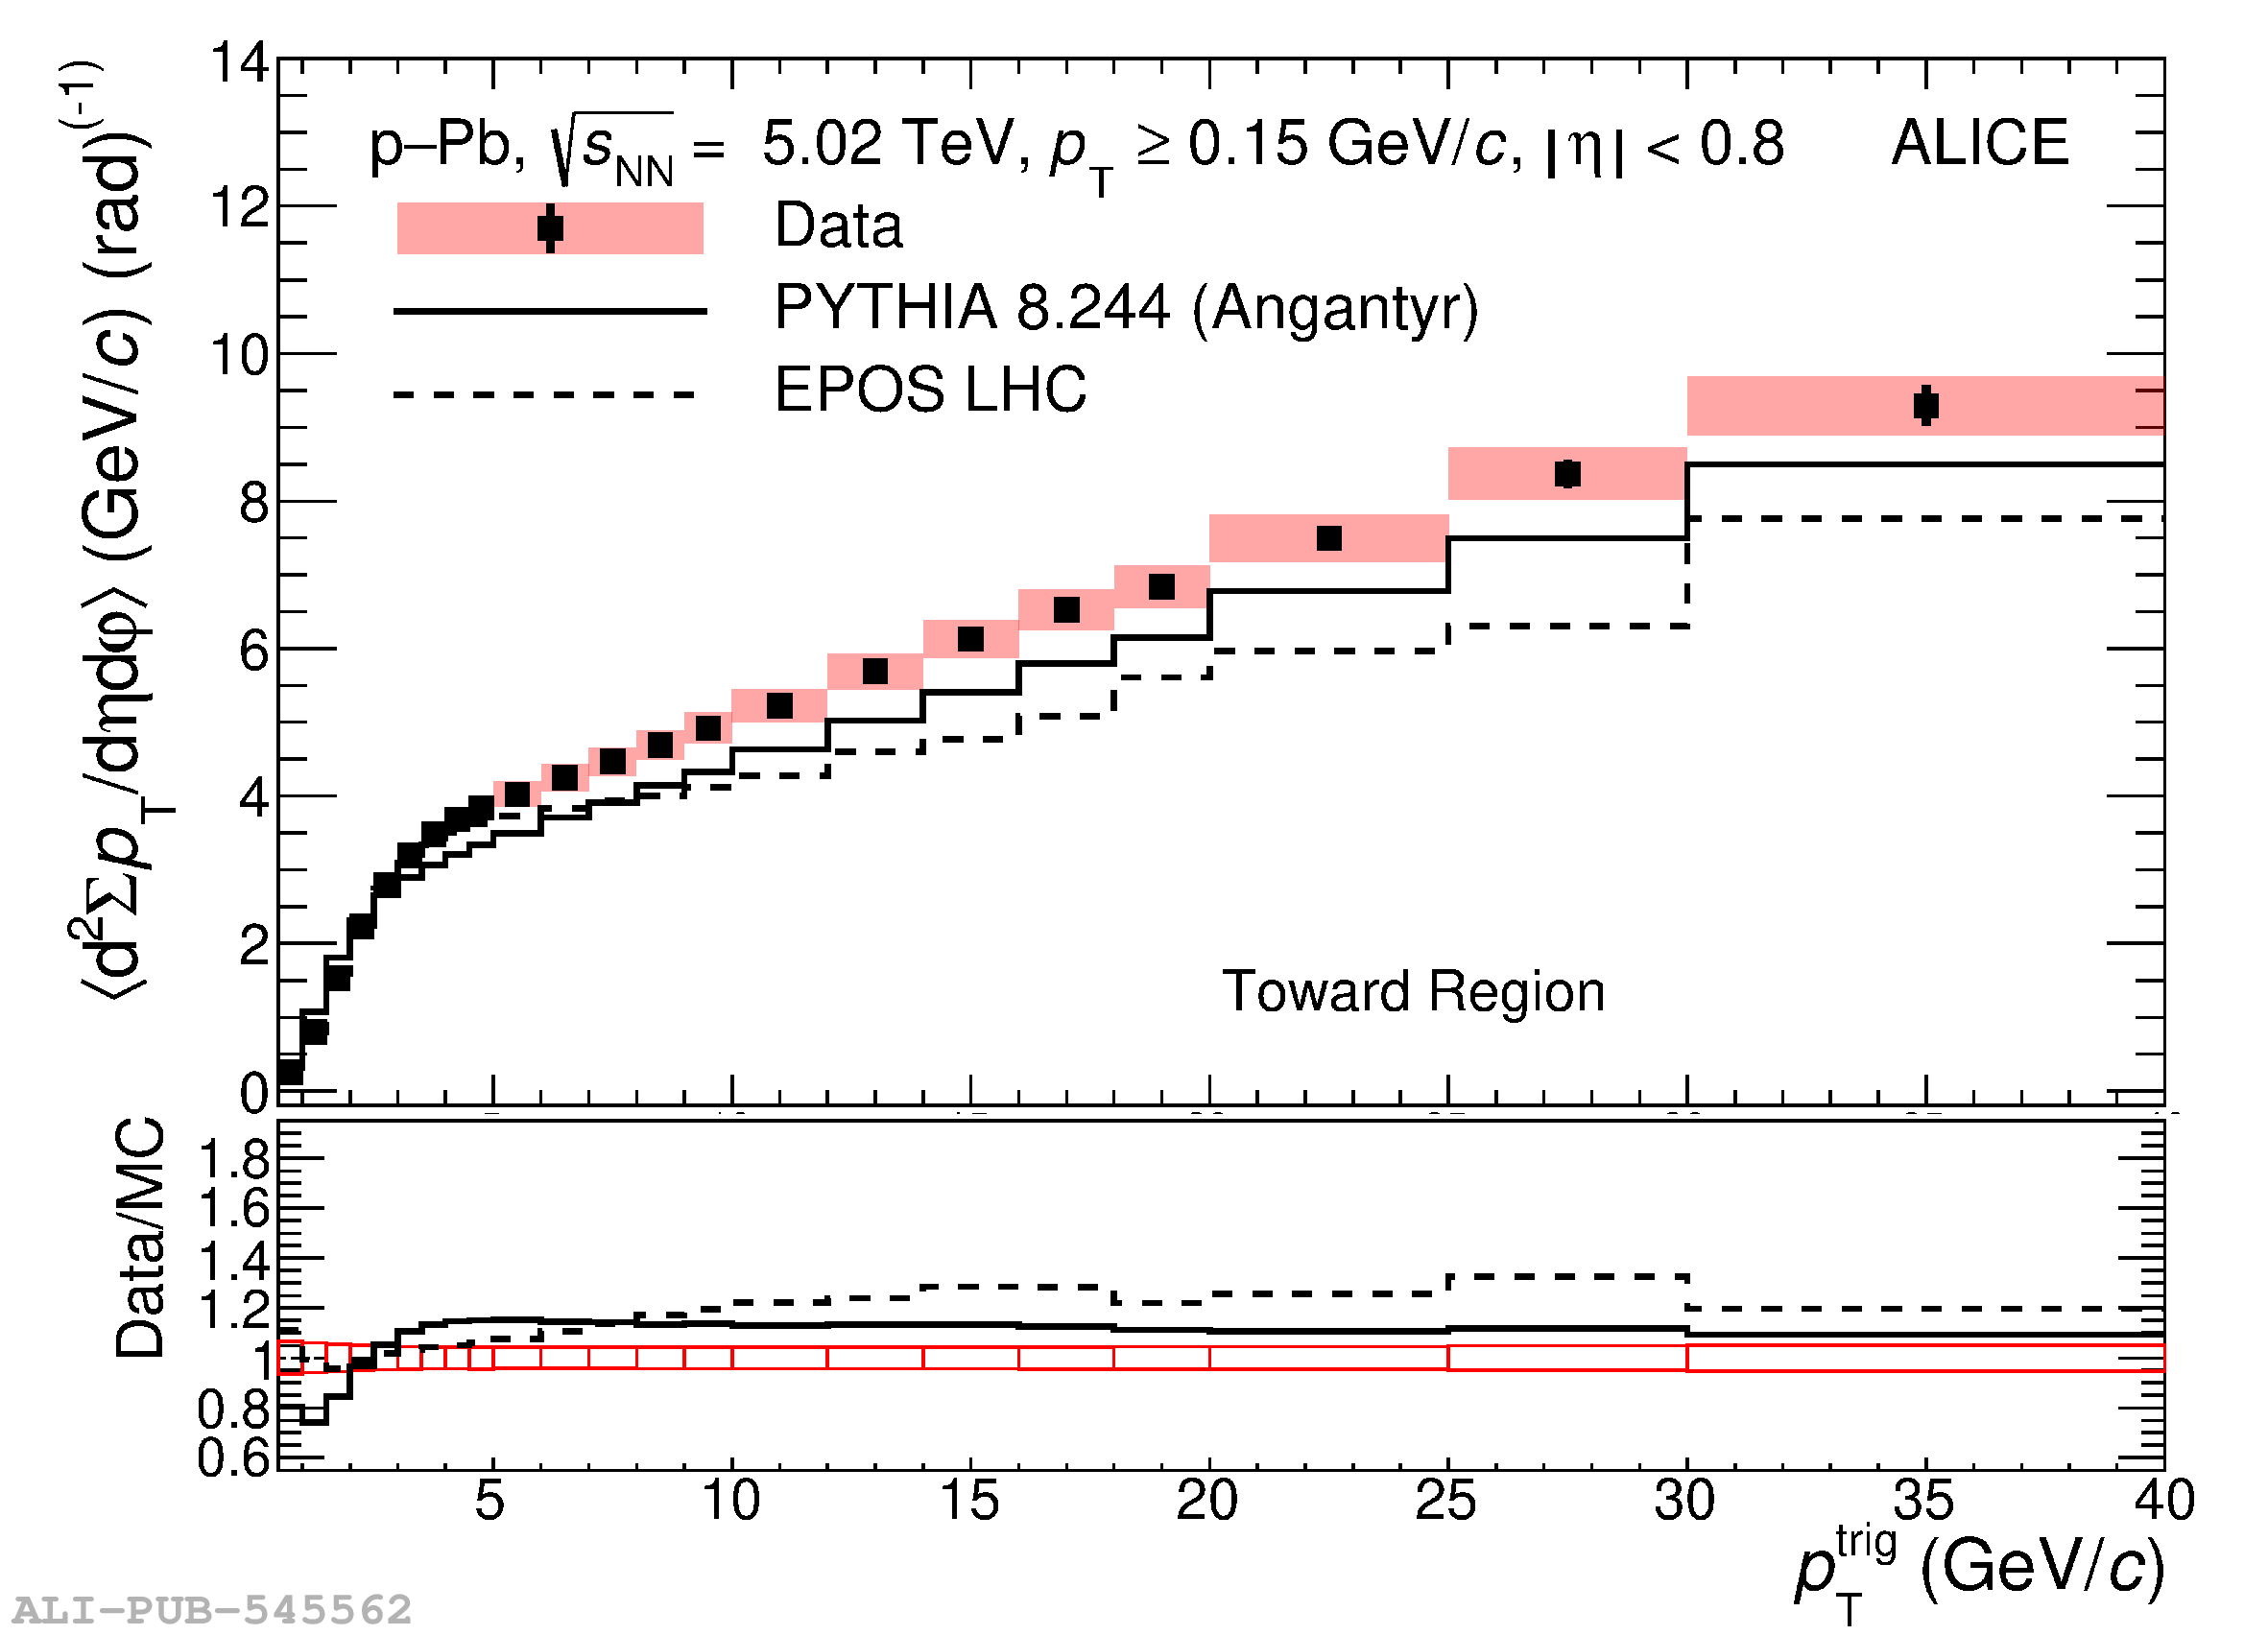 |
Figure A.4
The charged-particle number (left) and summed-$p_{\rm T}$ (right) densities as a function of $p_{\rm T}^{\rm trig}$ in p-Pb collision at $\sqrt{s_{\rm NN}}=5.02$ TeV are displayed. Results for the transverse (top), away (middle), and toward (bottom) regions were obtained for the transverse momentum threshold $\pt>1$ GeV/$c$. The shaded area and the error bars around the data points represent the systematic and statistical uncertainties, respectively. Data are compared with PYTHIA 8/Angantyr (solid line) and EPOS LHC (dashed line) predictions. The data-to-model ratios are displayed in the bottom panel of each plot. The boxes around unity represent the statistical and systematic uncertainties added in quadrature. | 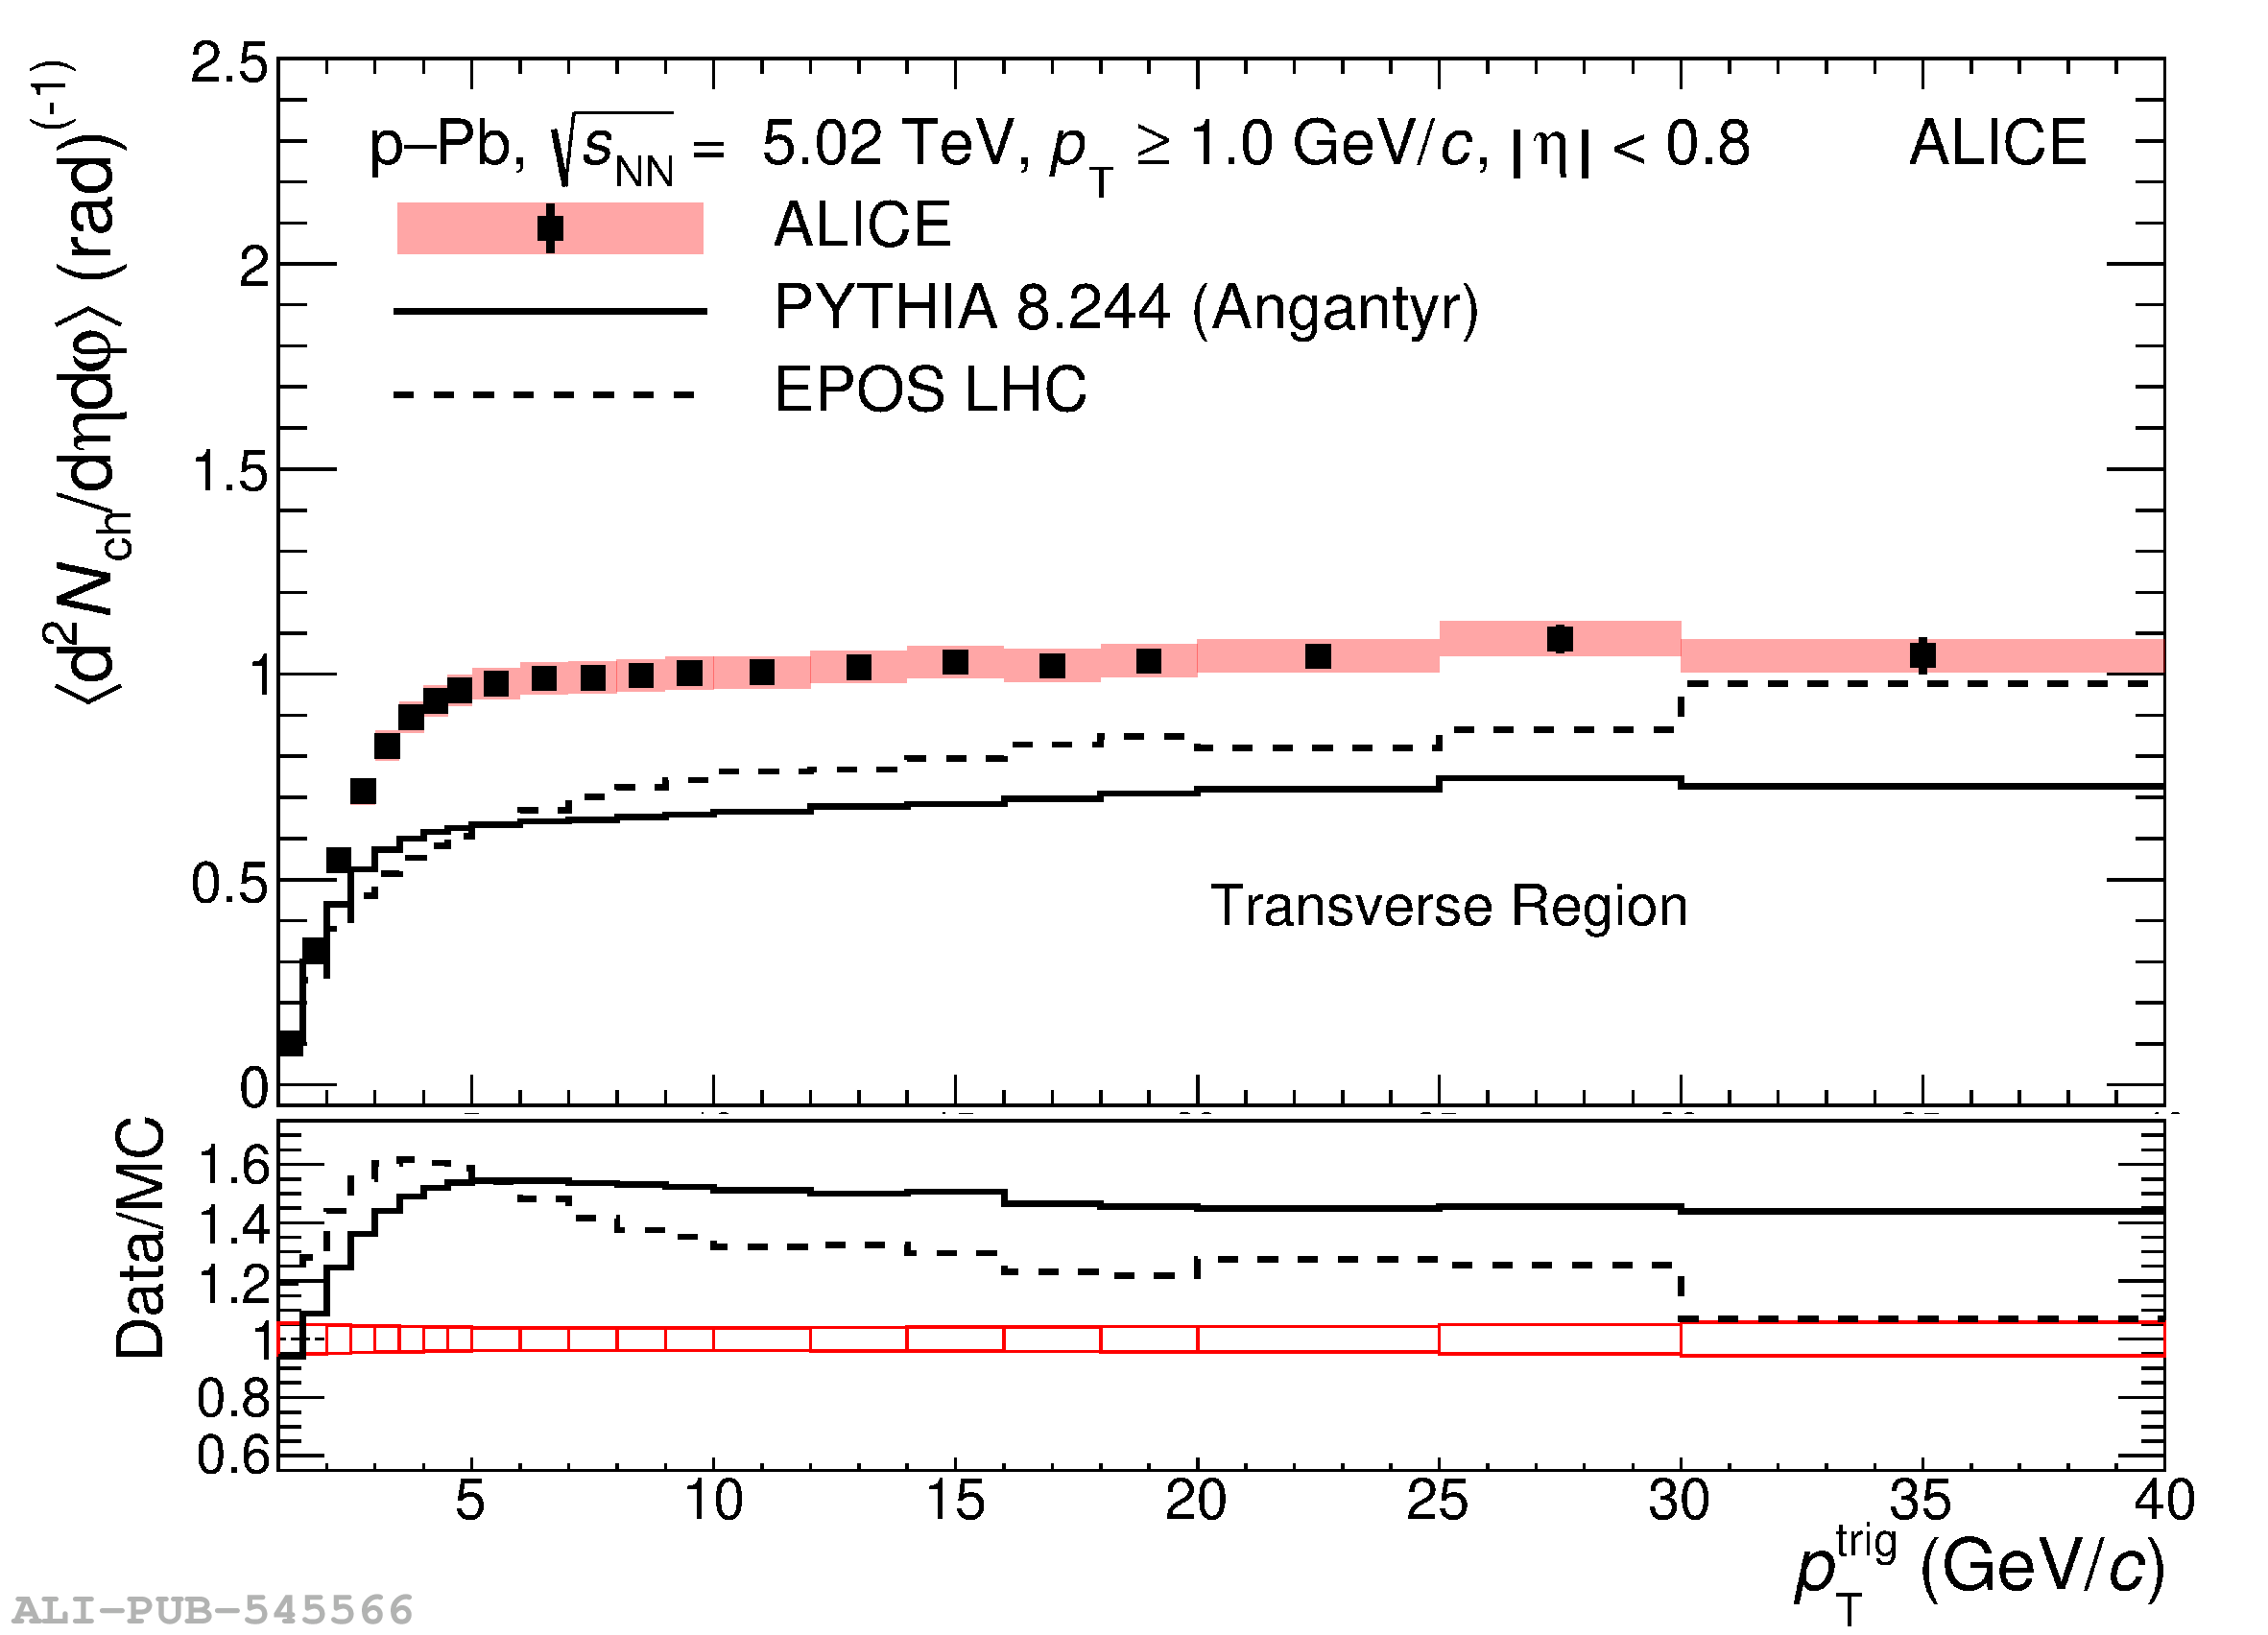 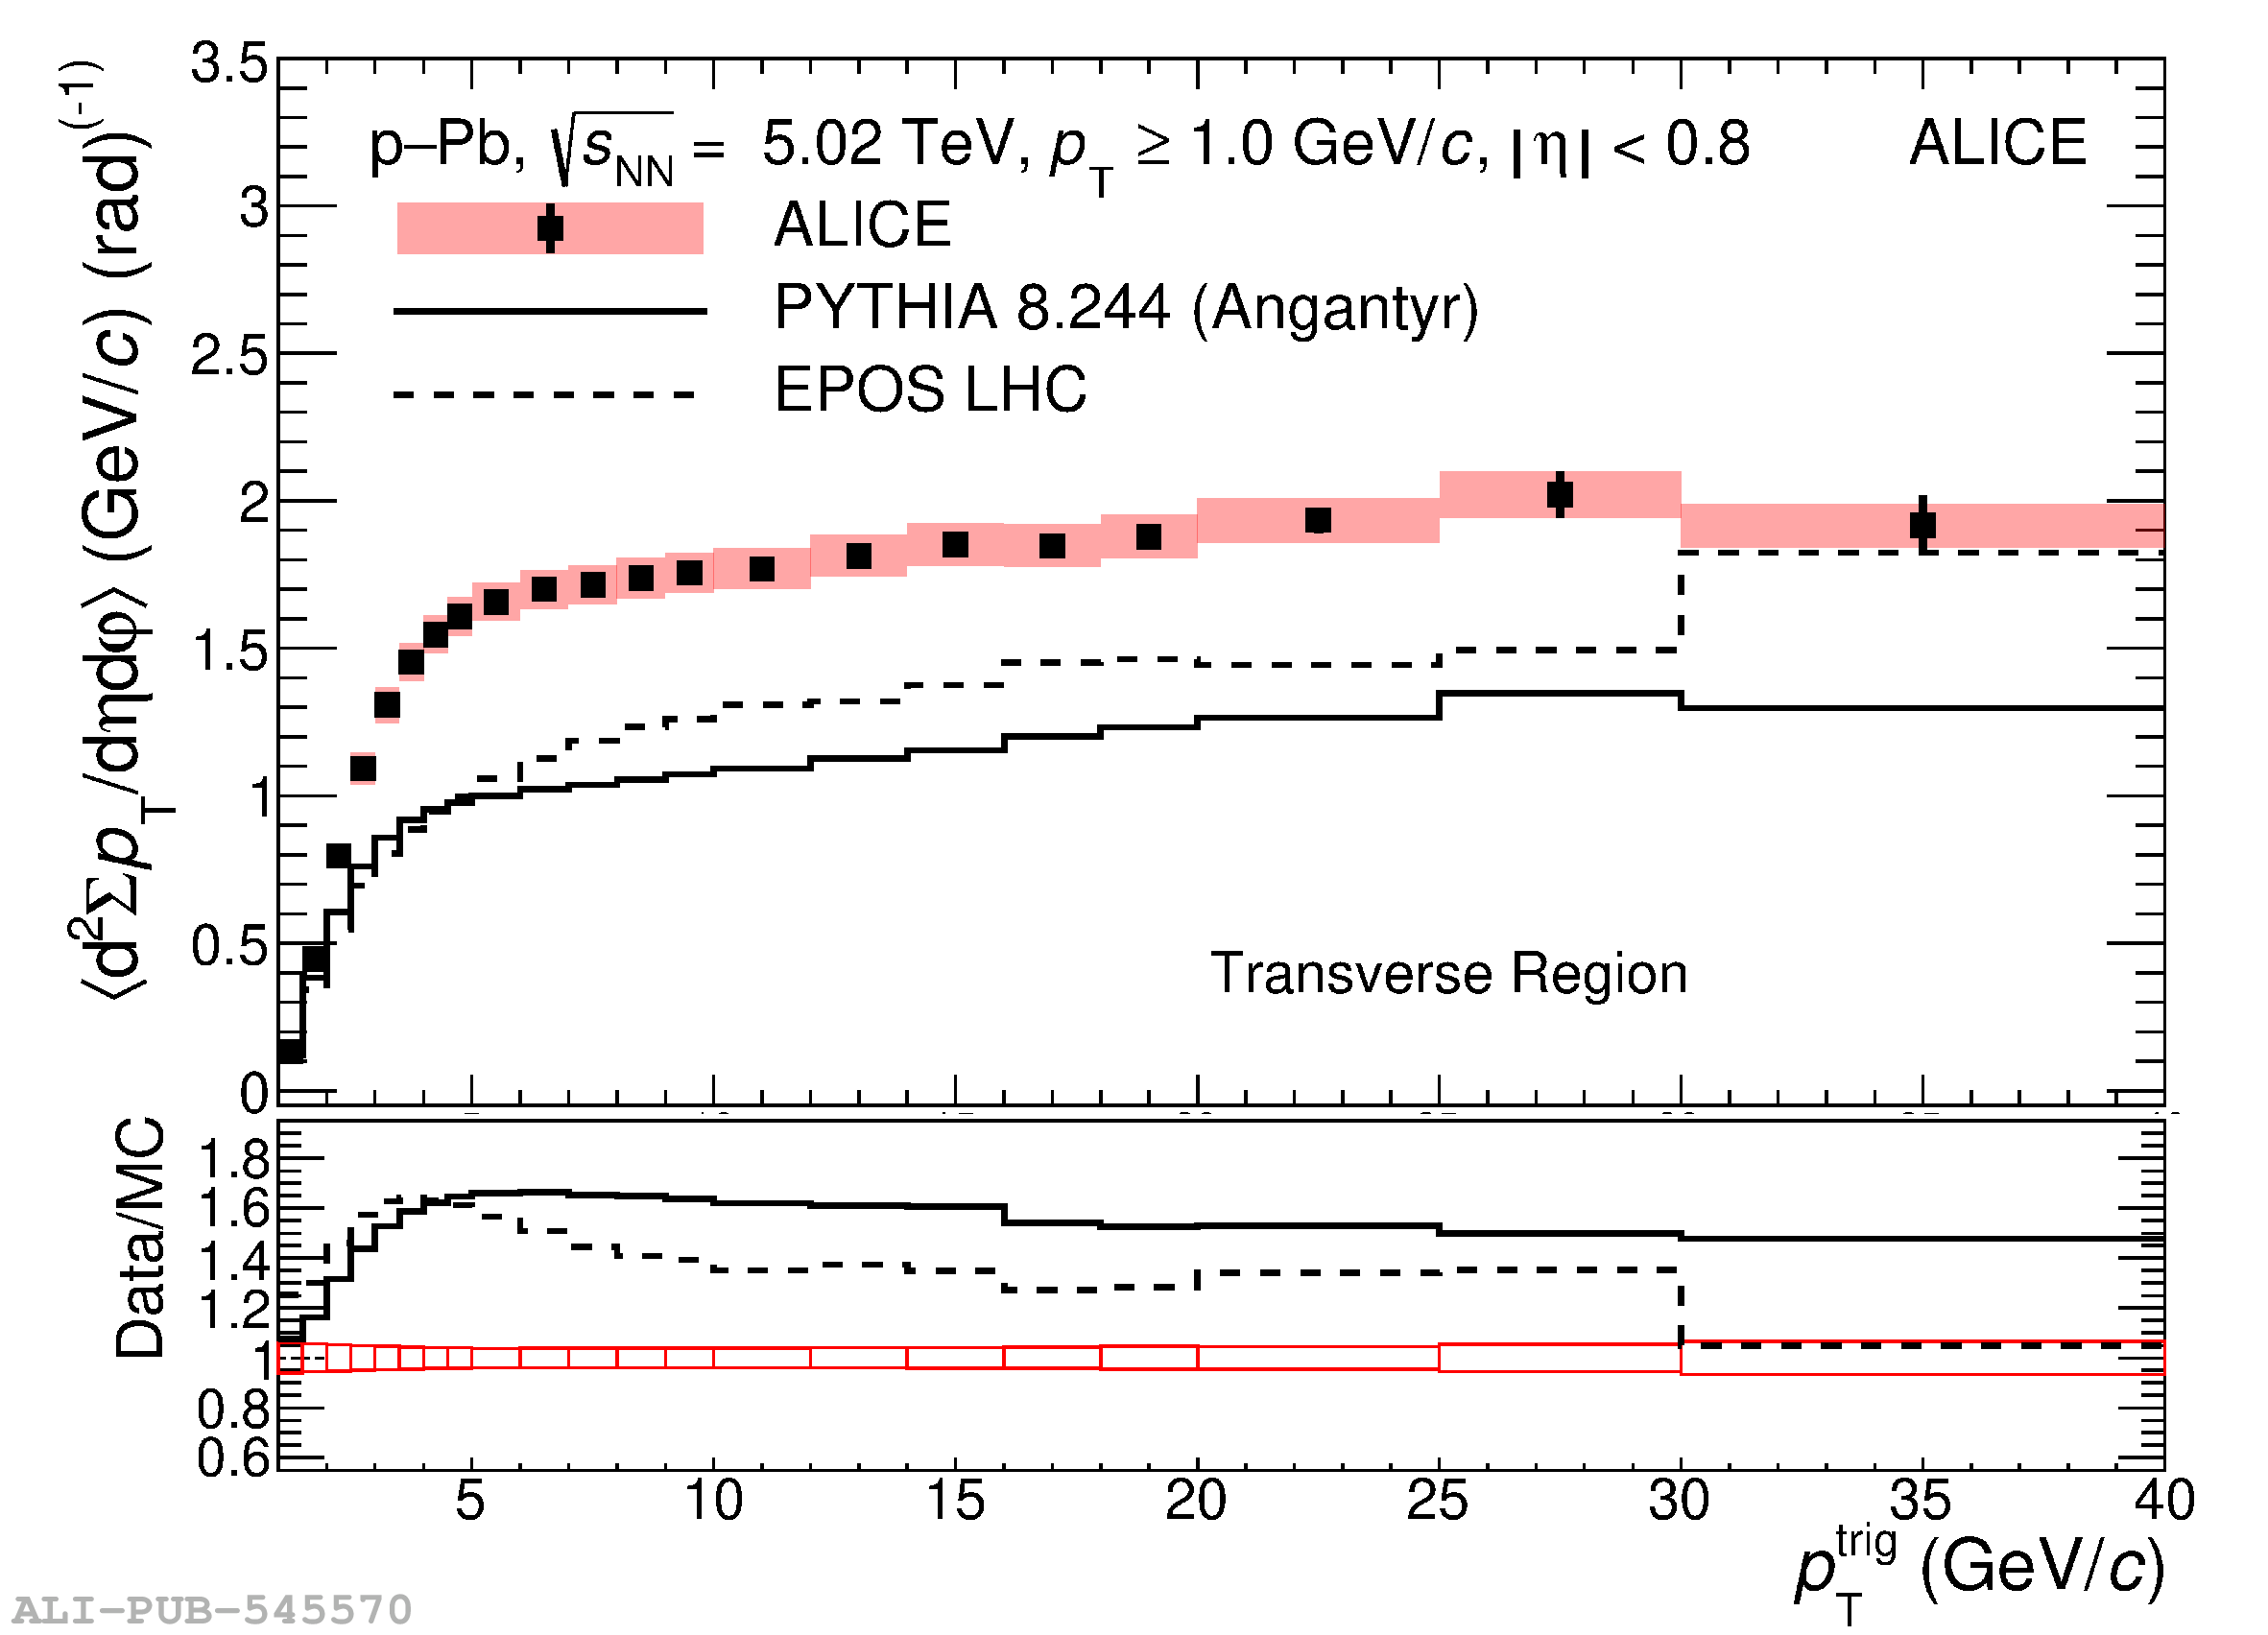 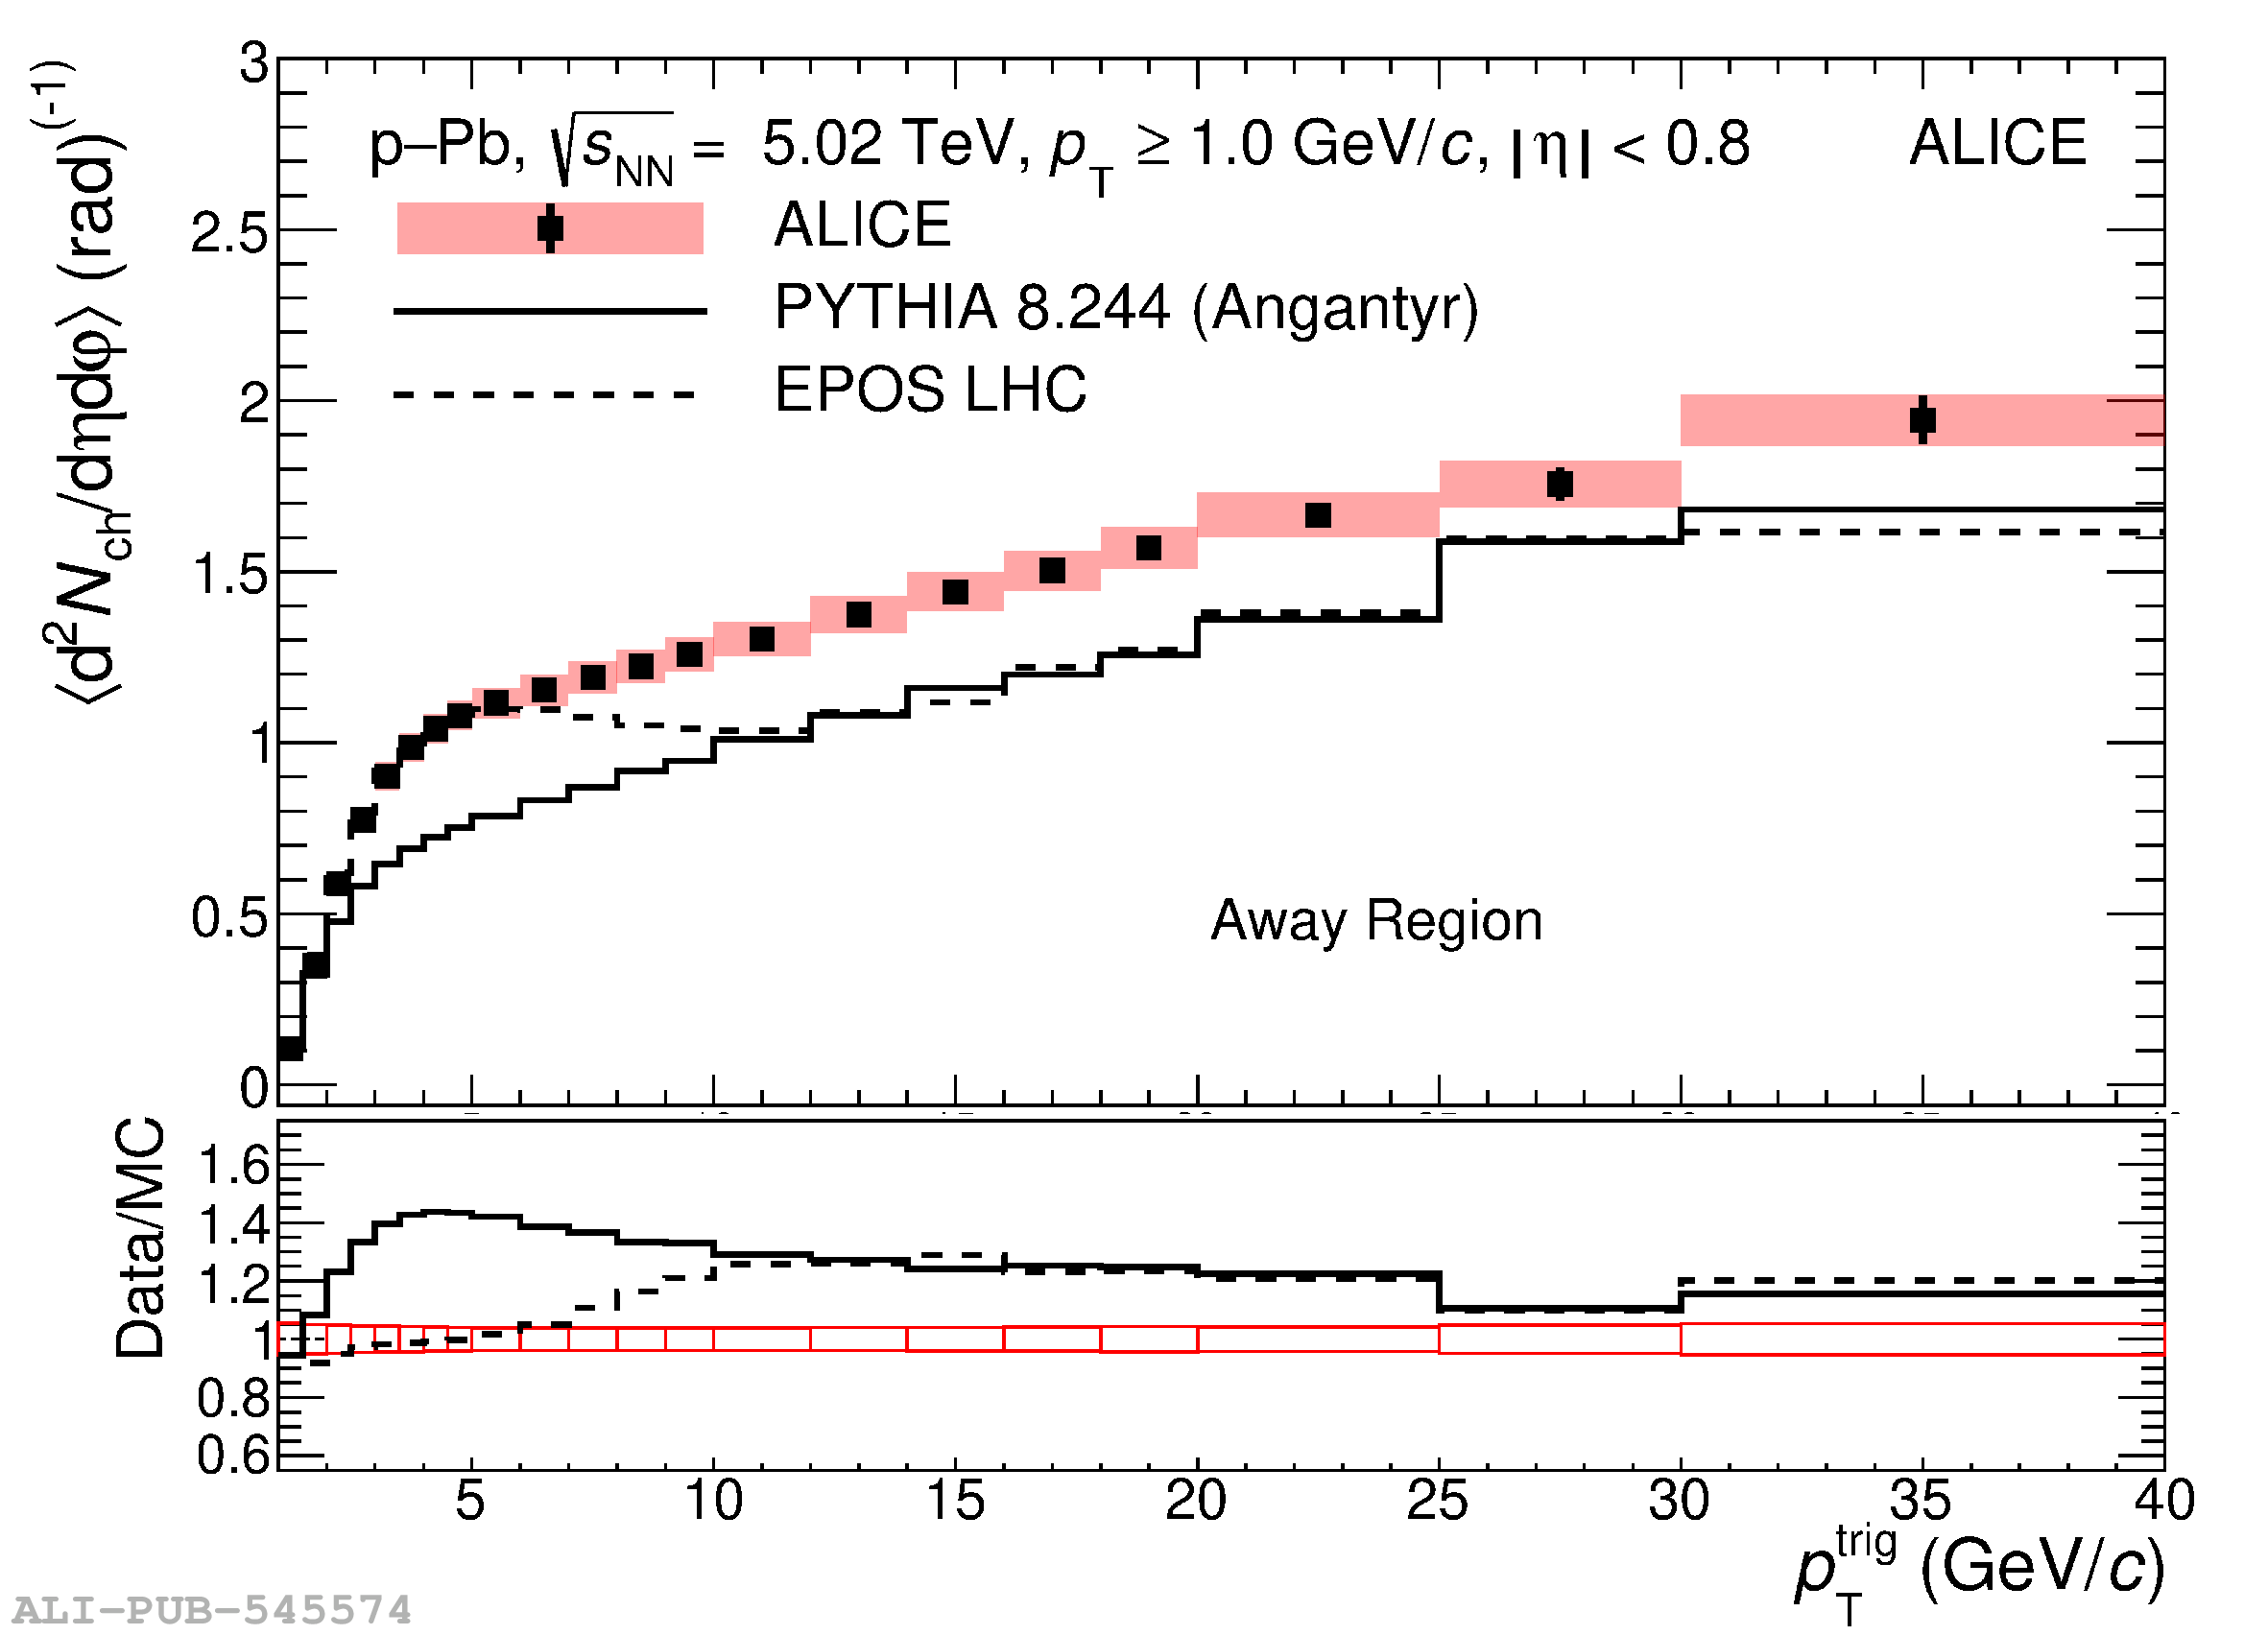 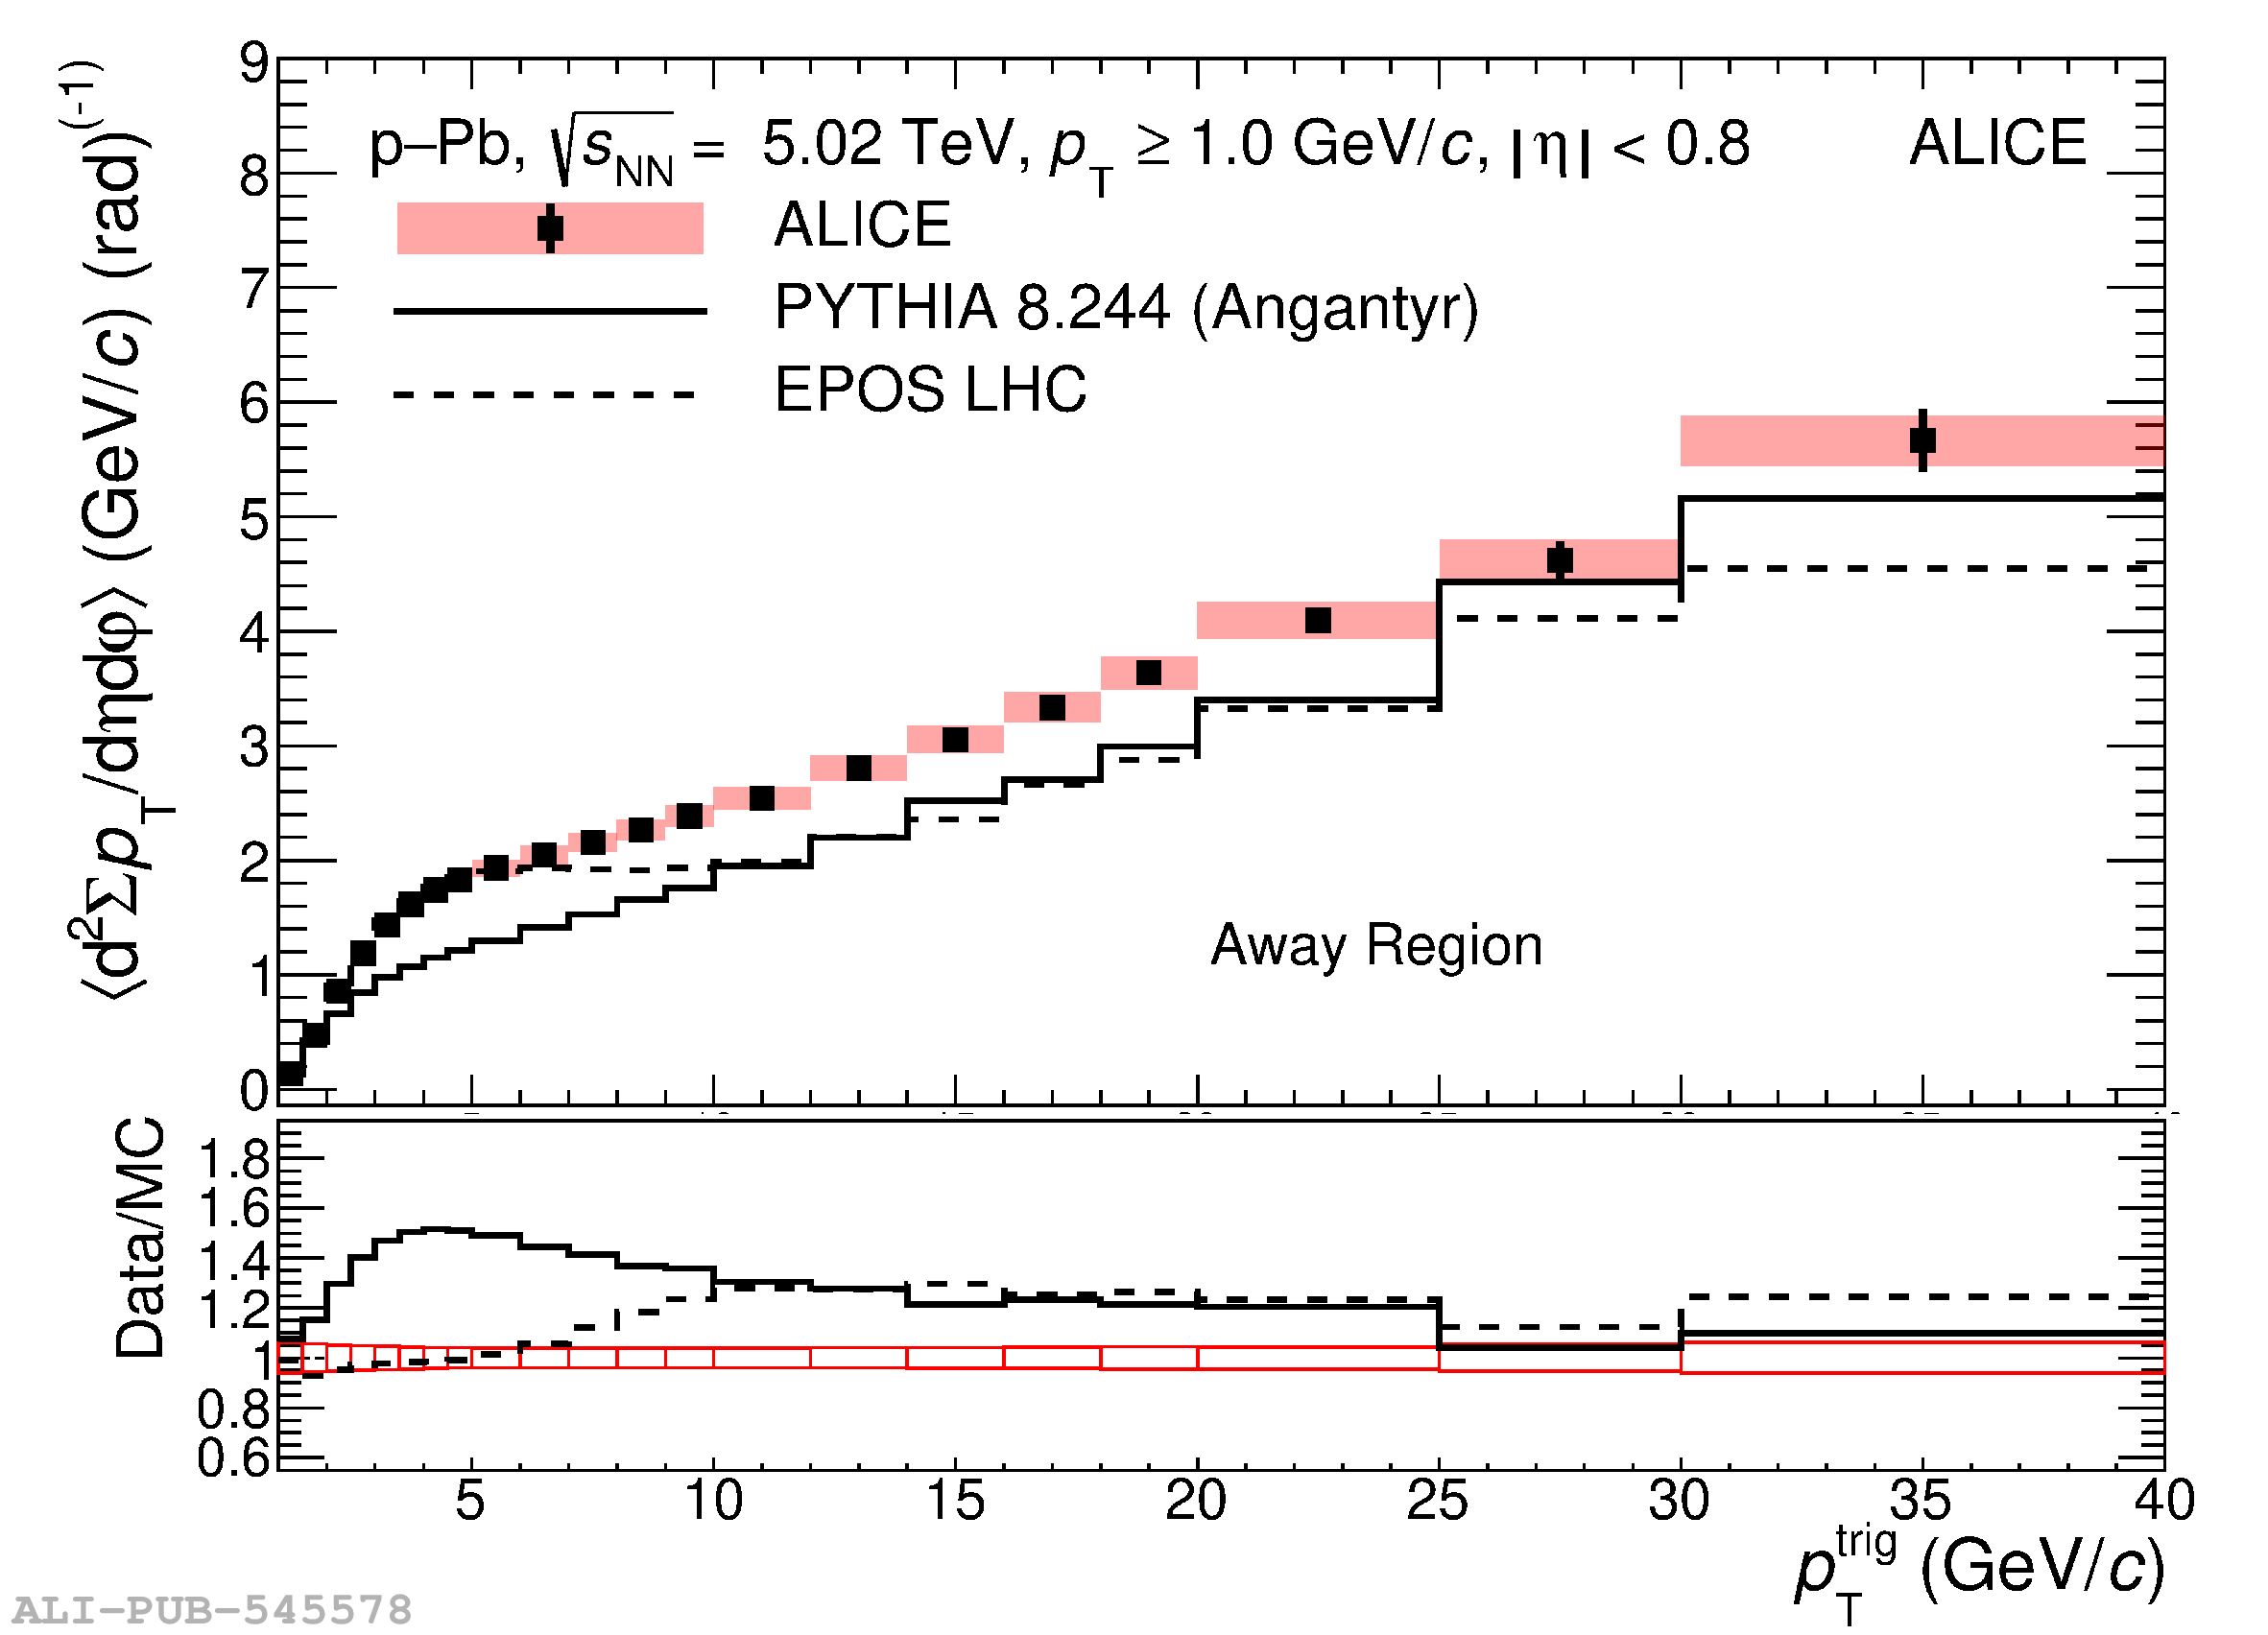 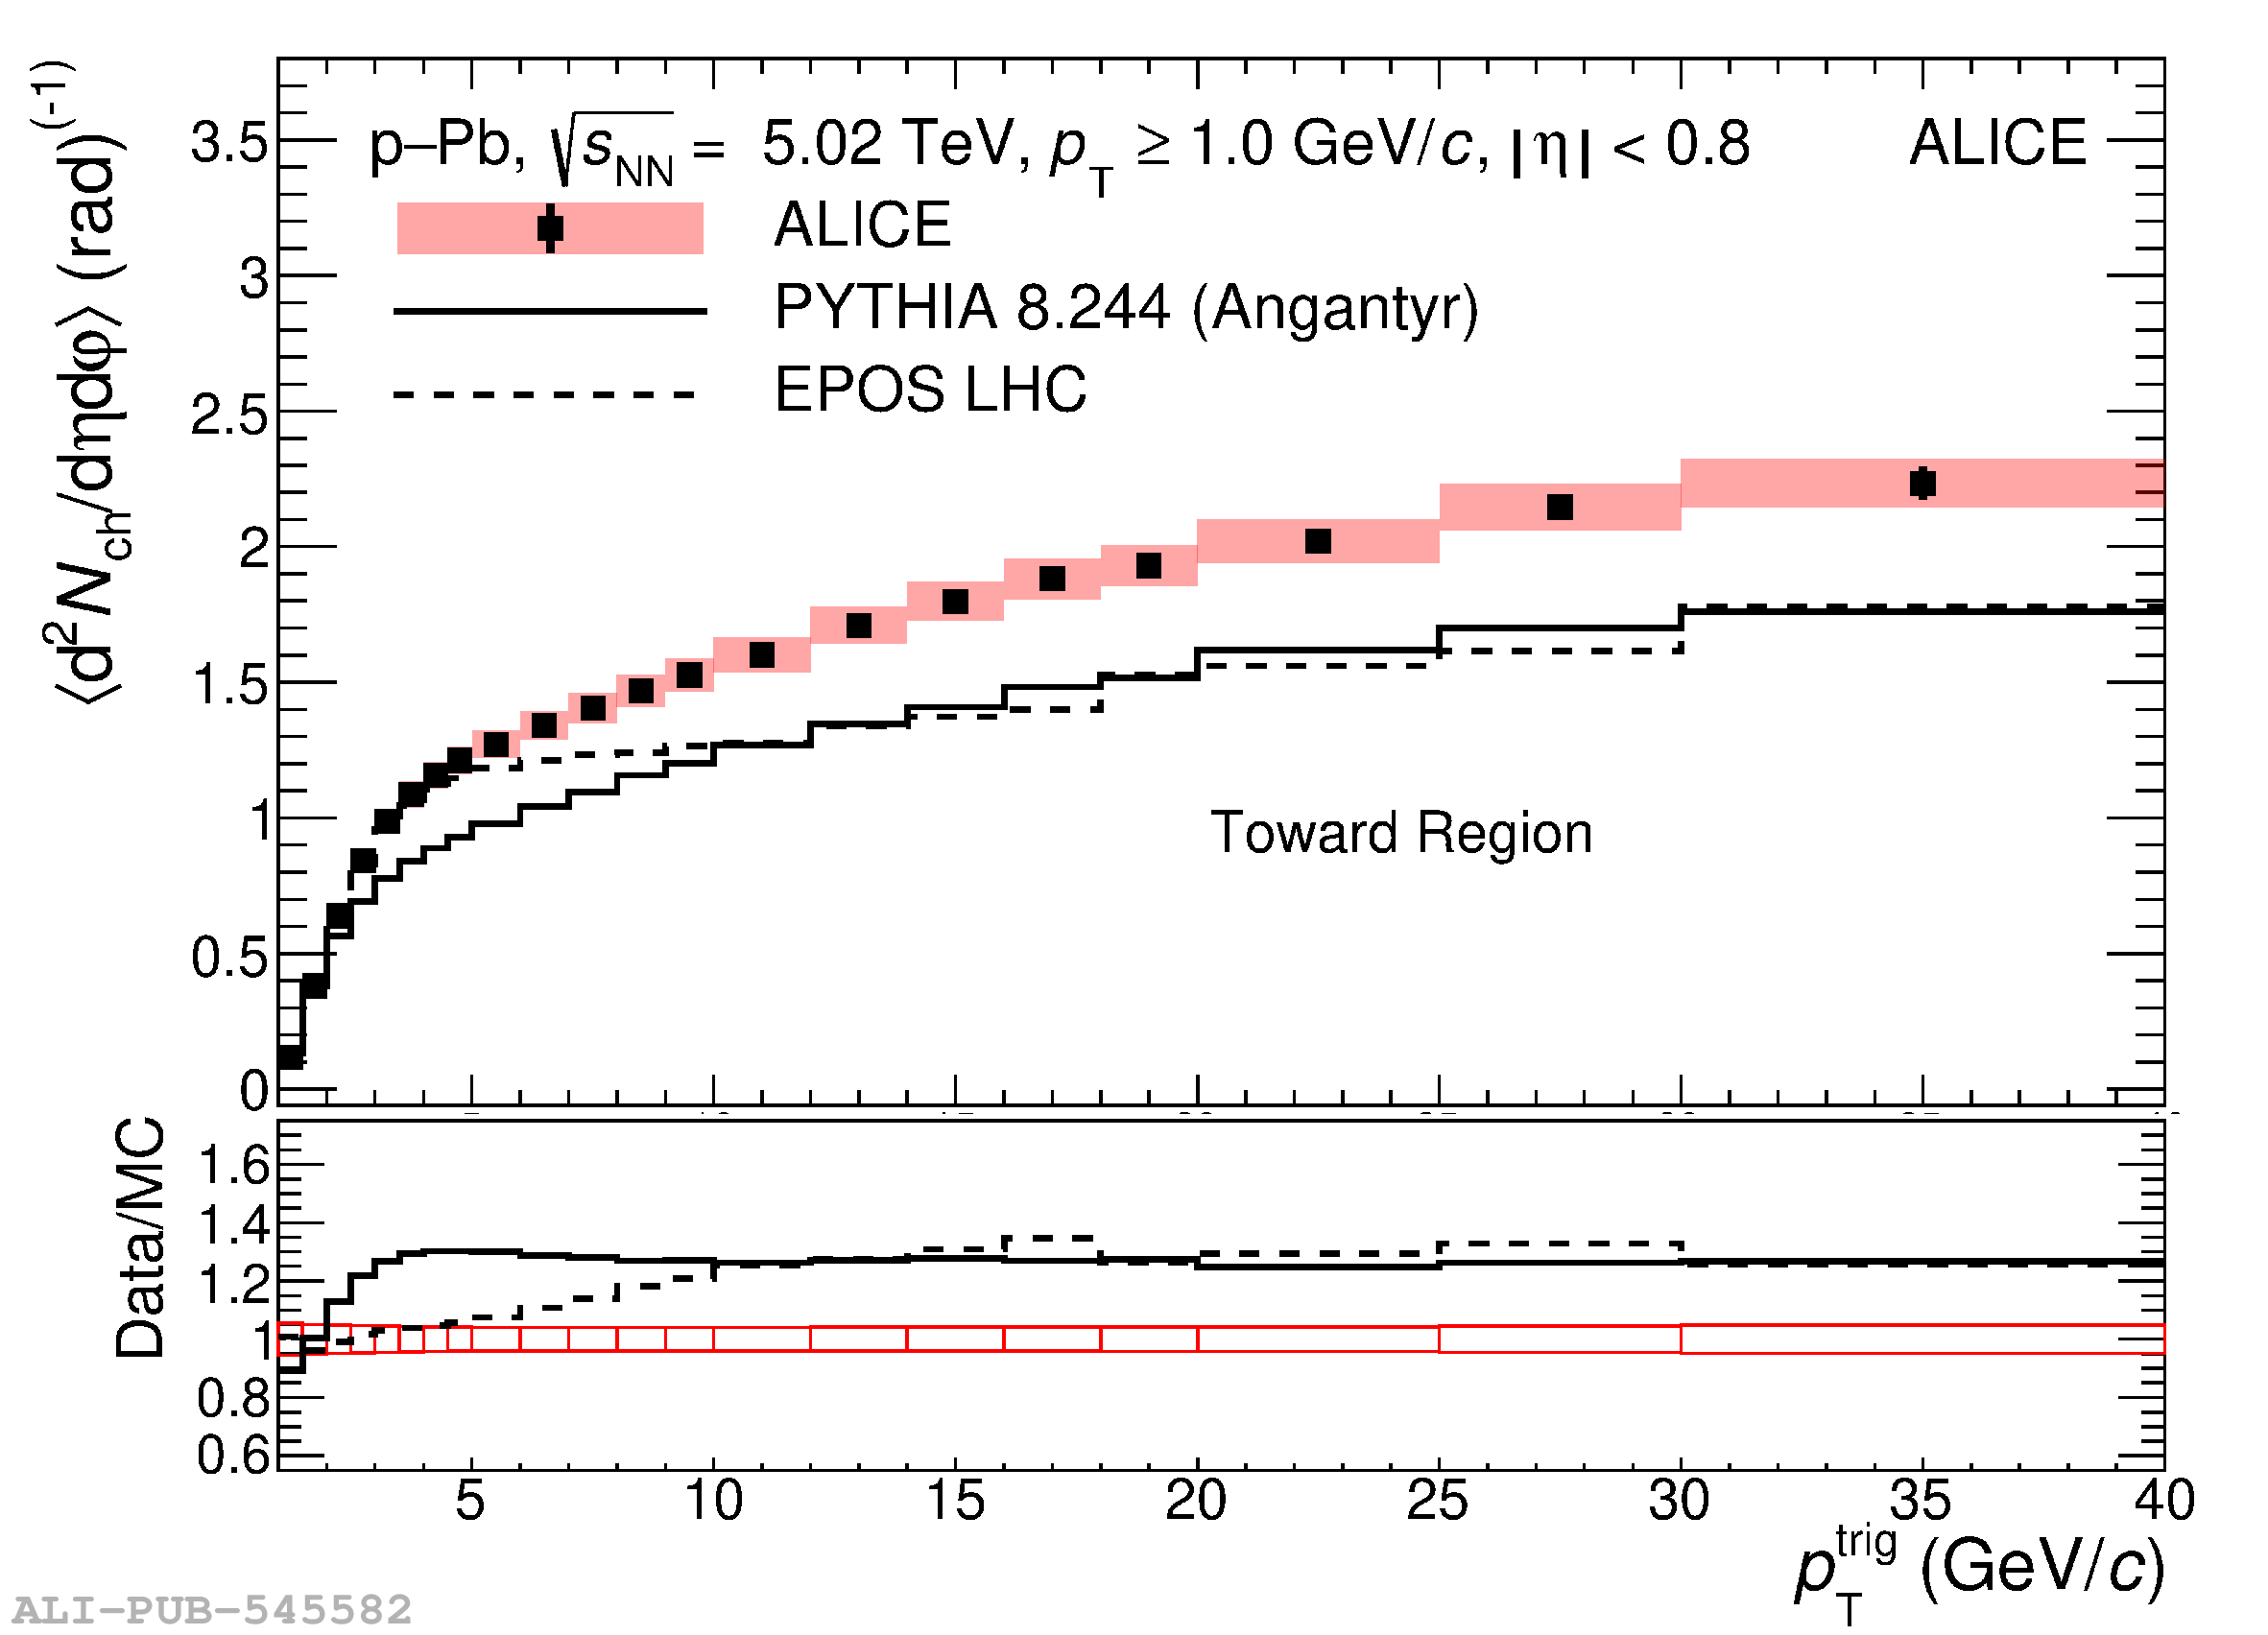 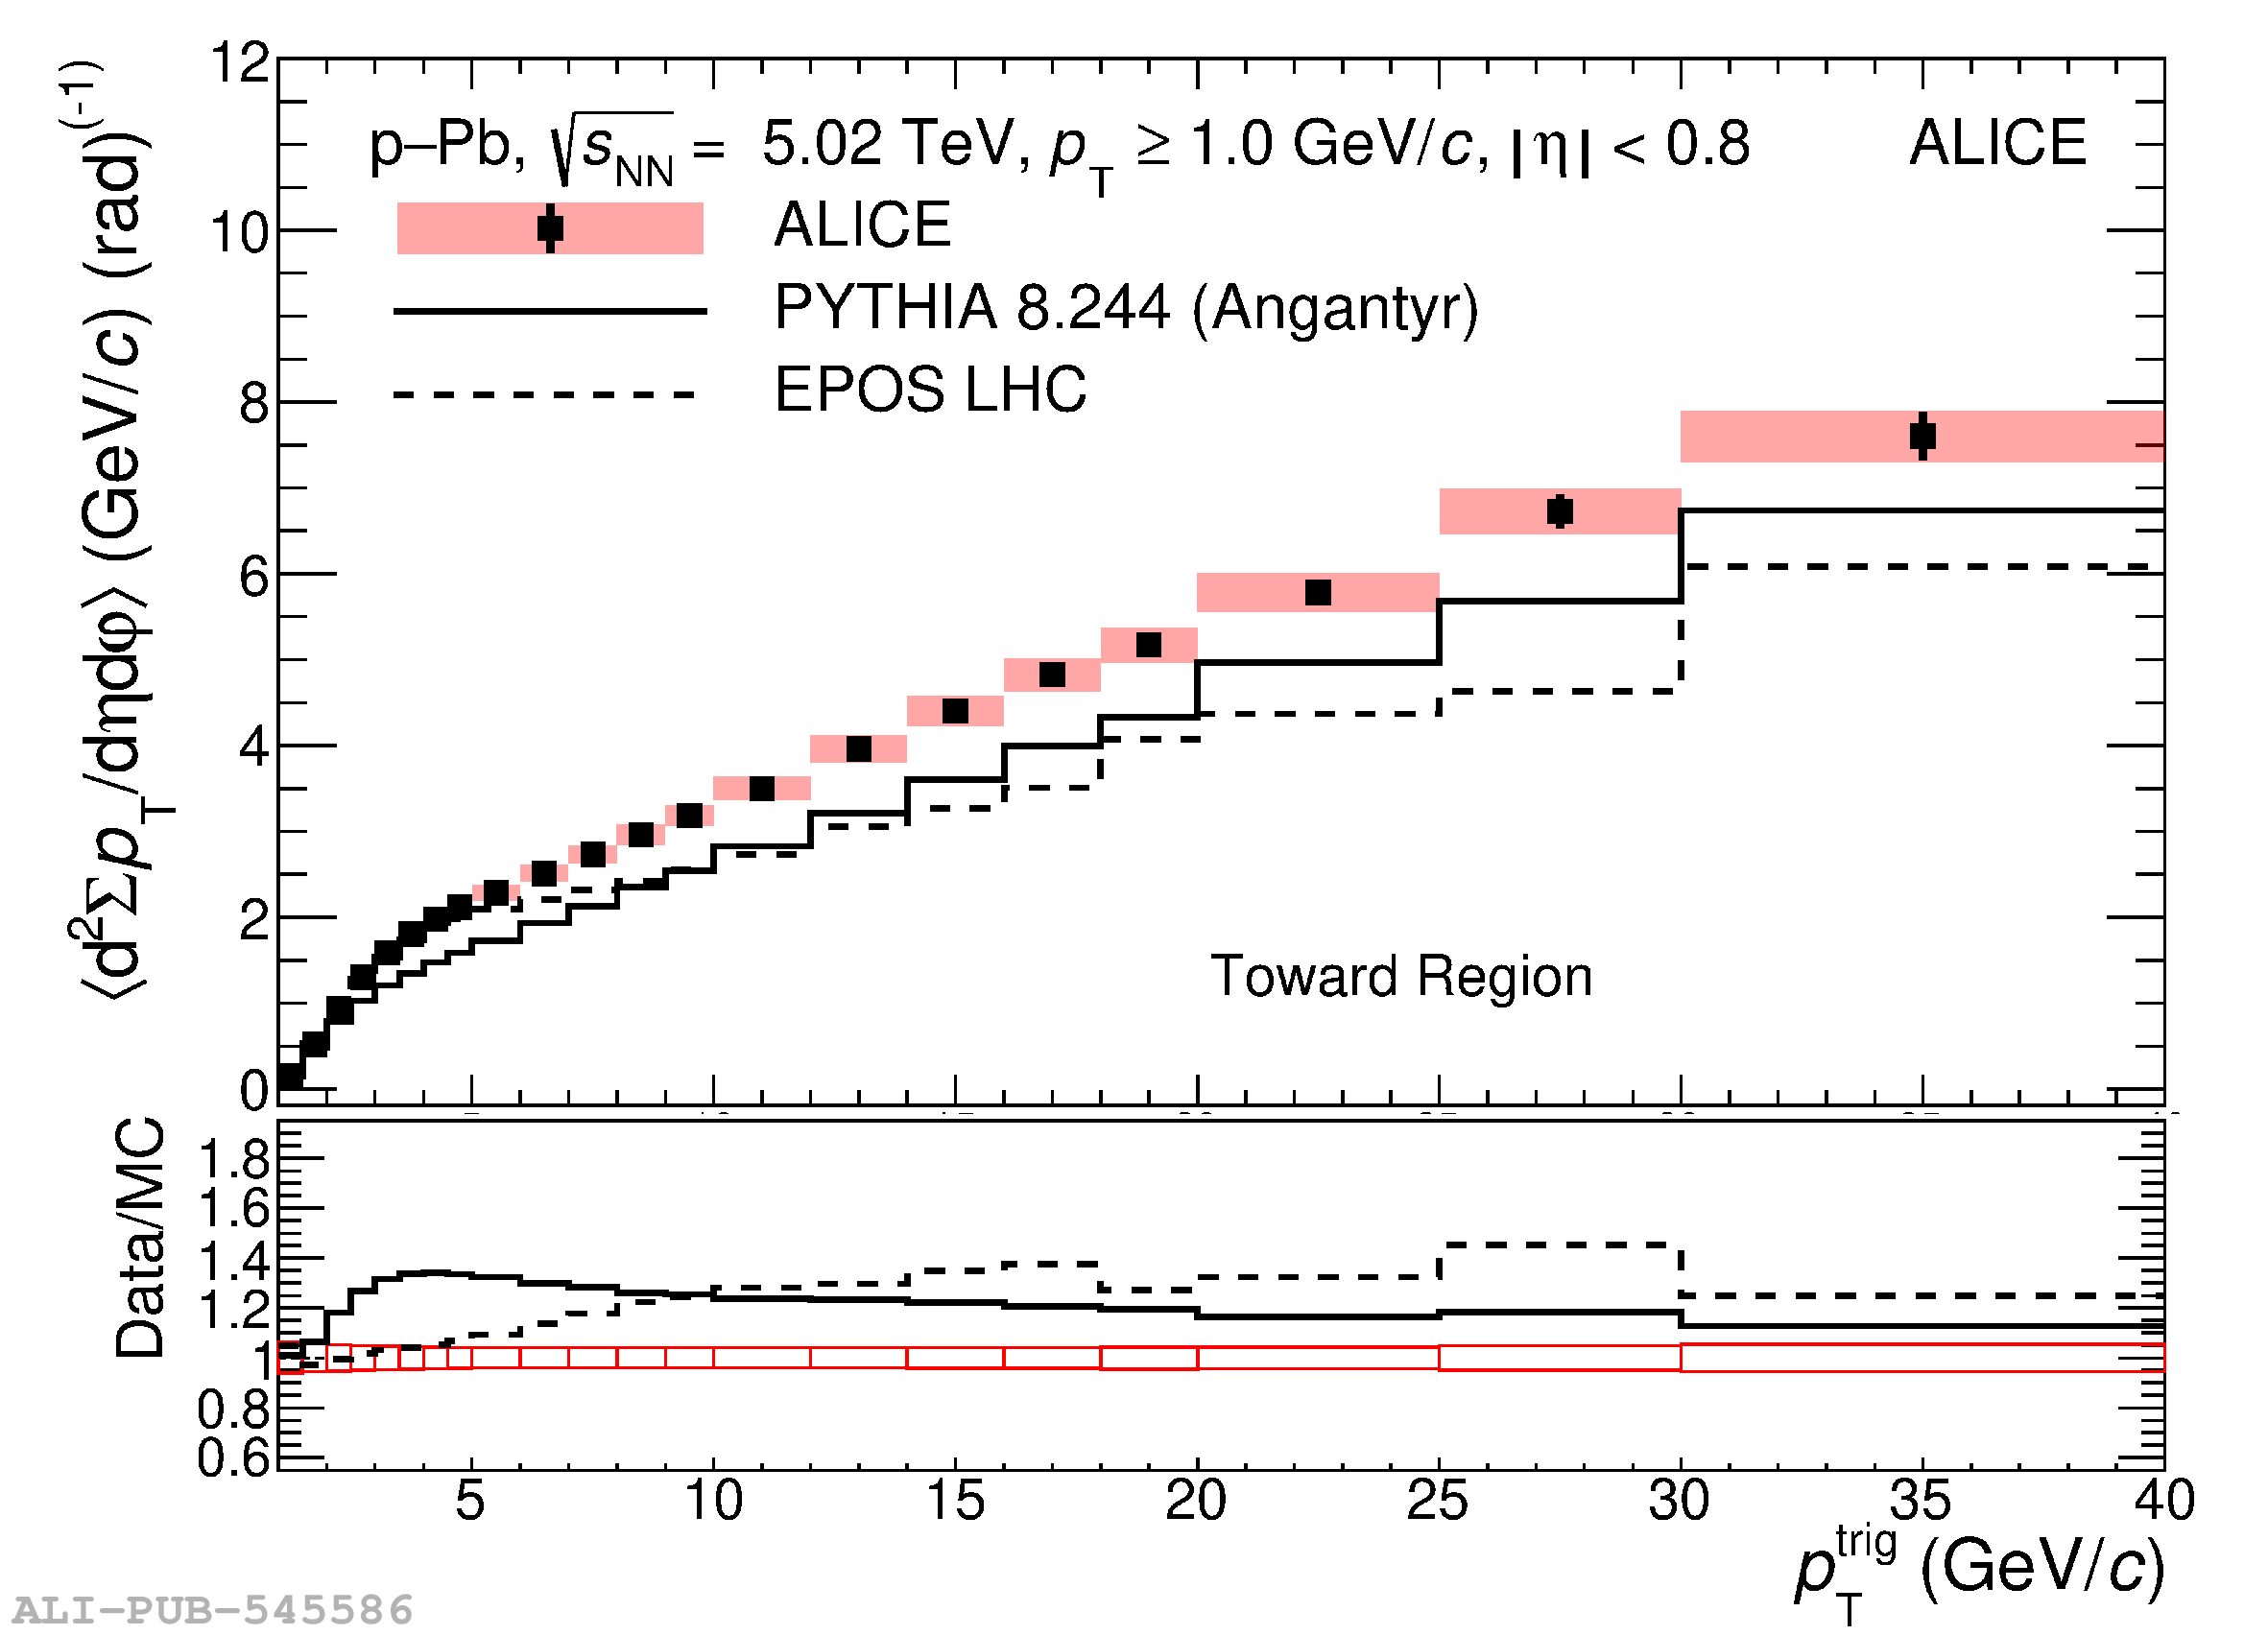 |