The measurement of the production of charm jets, identified by the presence of a ${\rm D^0}$ meson in the jet constituents, is presented in proton-proton collisions at centre-of-mass energies of $\sqrt{s}$ = 5.02 and 13 TeV with the ALICE detector at the CERN LHC. The ${\rm D^0}$ mesons were reconstructed from their hadronic decay ${\rm D^0} \rightarrow {\rm K^-}\pi^+$ and the respective charge conjugate. Jets were reconstructed from ${\rm D^0}$-meson candidates and charged particles using the anti-$k_{\rm T}$ algorithm, in the jet transverse momentum range $5<~p_{\rm T;chjet}<~50$ GeV/$c$, pseudorapidity $|\eta_{\rm jet}| <~0.9-R$, and with the jet resolution parameters $R$ = 0.2, 0.4, 0.6. The distribution of the jet momentum fraction carried by a ${\rm D^0}$ meson along the jet axis ($z^{\rm ch}_{||}$) was measured in the range $0.4 <~ z^{\rm ch}_{||} <~ 1.0$ in four ranges of the jet transverse momentum. Comparisons of results for different collision energies and jet resolution parameters are also presented. The measurements are compared to predictions from Monte Carlo event generators based on leading-order and next-to-leading-order perturbative quantum chromodynamics calculations. A generally good description of the main features of the data is obtained in spite of a few discrepancies at low $p_{\rm T;chjet}$. Measurements were also done for $R = 0.3$ at $\sqrt{s}$ = 5.02 TeV and are shown along with their comparisons to theoretical predictions in an appendix to this paper.
JHEP 06 (2023) 133
HEP Data
e-Print: arXiv:2204.10167 | PDF | inSPIRE
CERN-EP-2022-070
Figure group
Figure 1
Top: invariant mass distributions of $\mathrm{D^{0}}$-jet candidates for $2< p_{\mathrm{T,ch\,jet}} <50$ GeV/$c$ and $R=0.4$ in pp collisions at $\sqrt{s}$ = 5.02 TeV, in the $\mathrm{D^{0}}$-meson transverse momentum intervals: $3< p_{\mathrm{T,D^0}} <4$ GeV/$c$ (left), $7< p_{\mathrm{T,D^0}} <8$ GeV/$c$ (centre), and $10< p_{\mathrm{T,D^0}} <12$ GeV/$c$ (right). The total fit function is represented by the blue solid line, while the red dashed line represents the sum of the background and reflection fit functions. The red and green shaded areas correspond to the peak and sideband regions, respectively. Bottom: $\mathrm{D^{0}}$-jet raw yields as a function of $p_{\mathrm{T,ch\,jet}}$ in the signal and sideband regions, and their subtracted yields. | 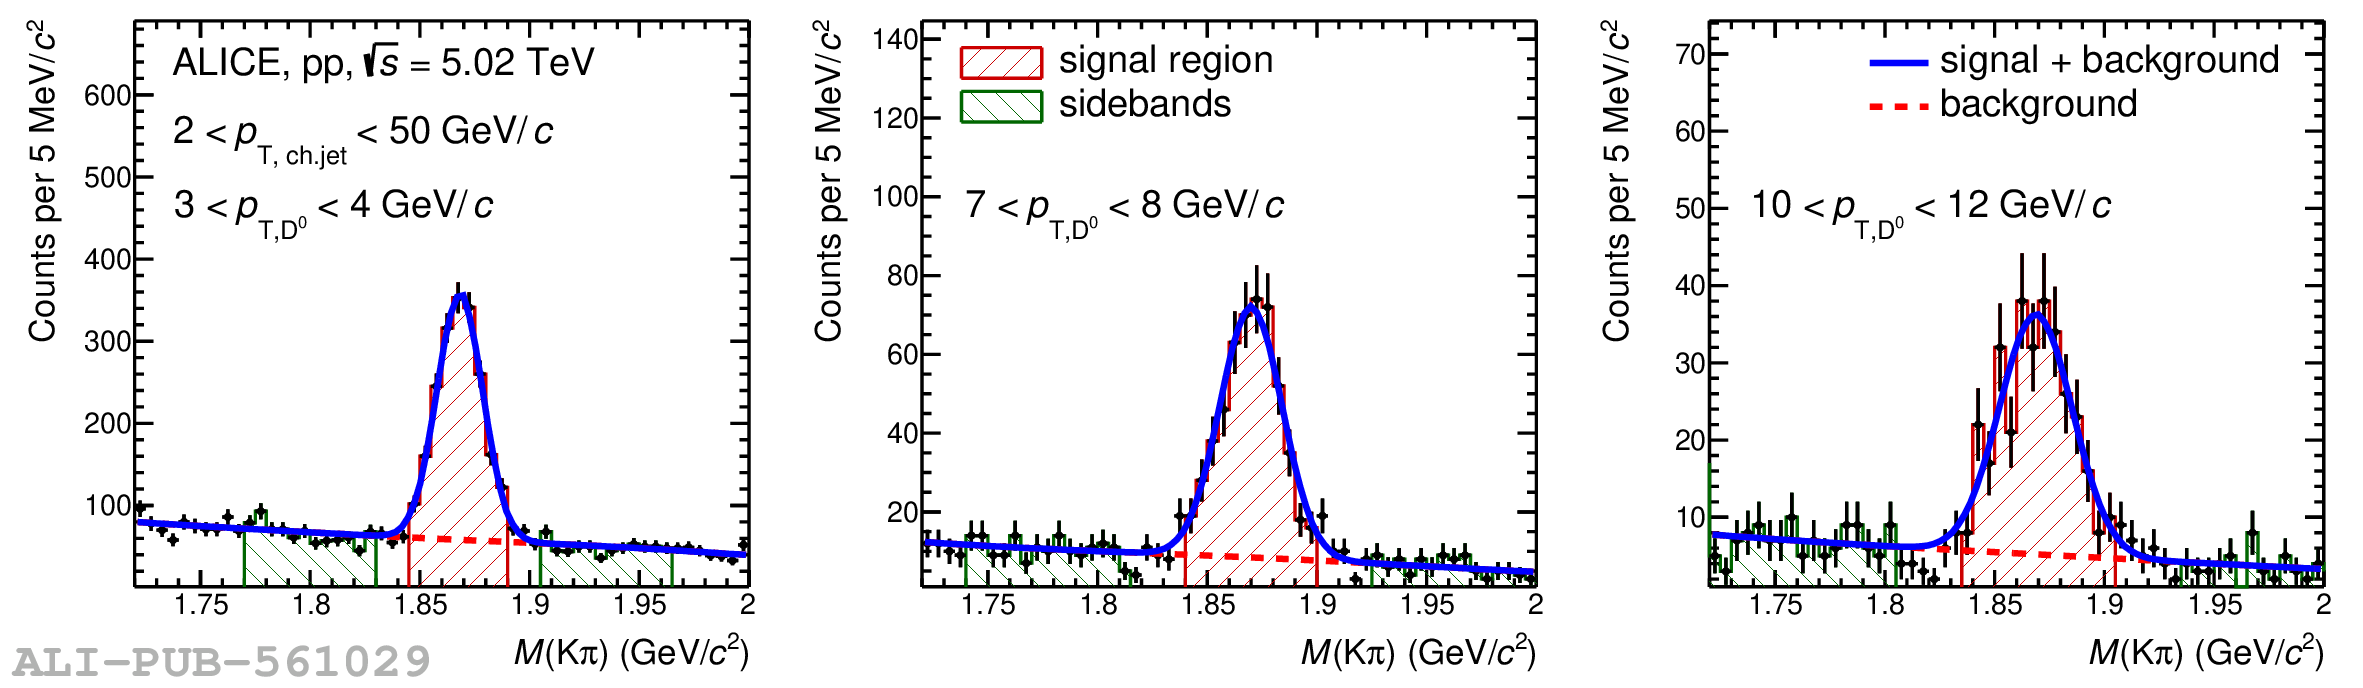 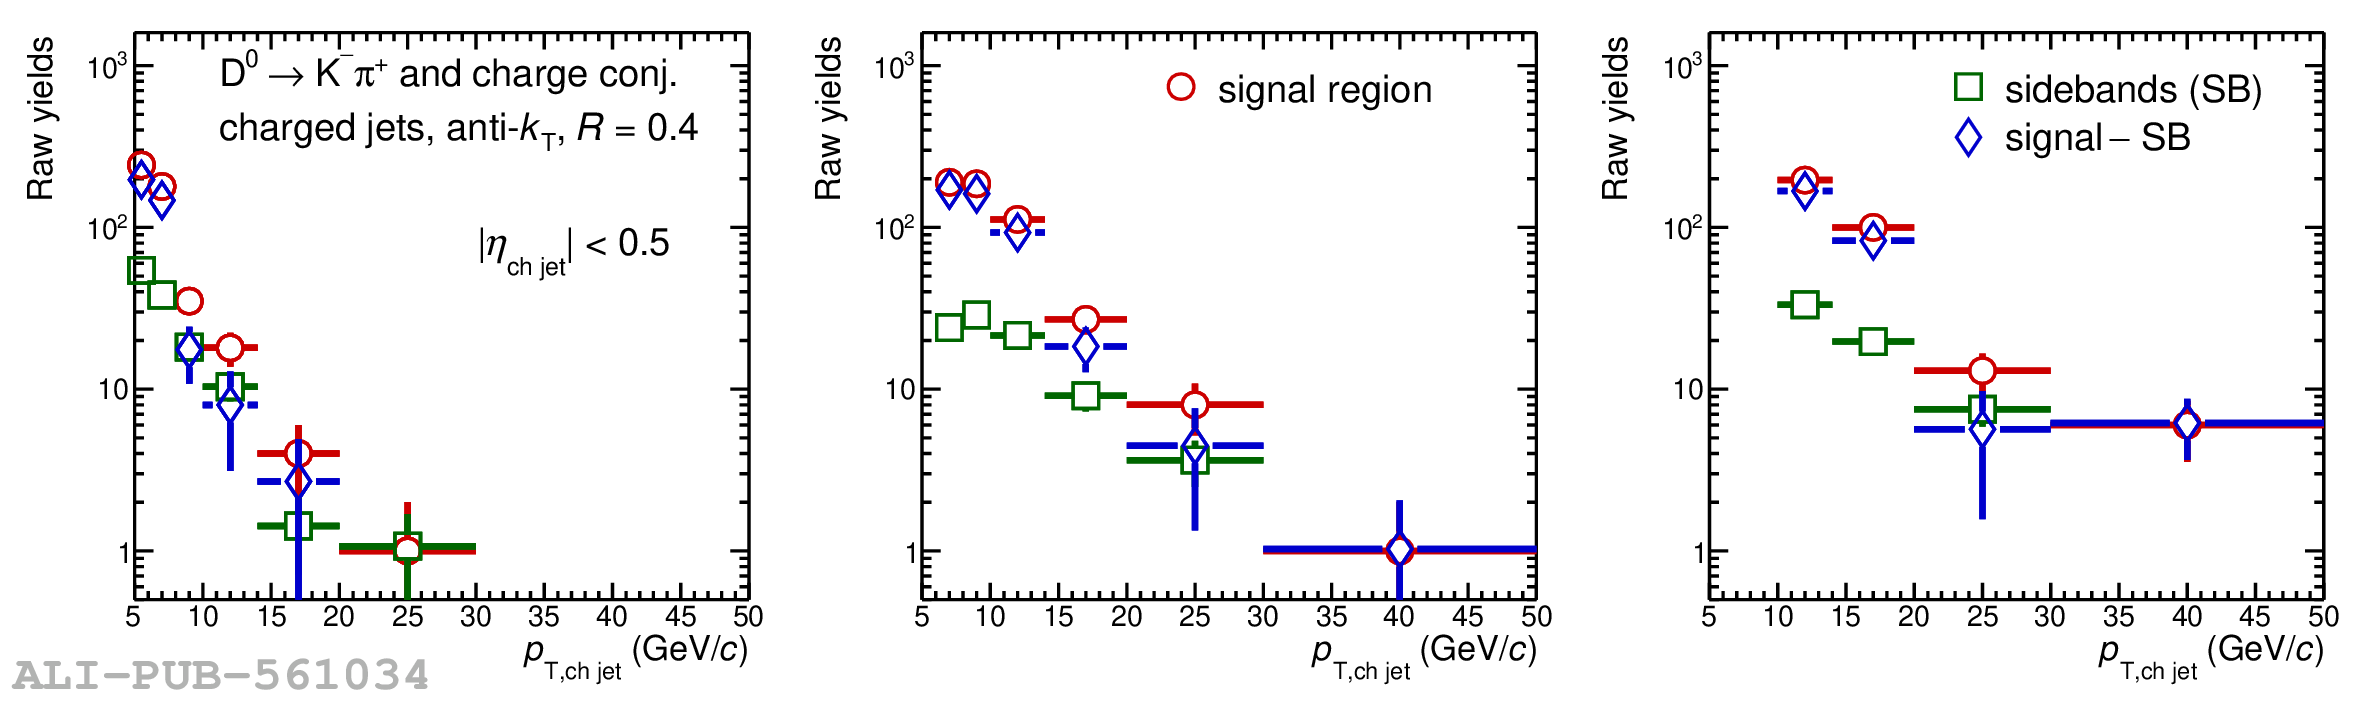 |
Figure 2
Top: invariant mass distribution of $\mathrm{D^{0}}$-jet candidates for one jet-$p_{\rm T}$ interval of ${5< p_{\mathrm{T,ch\,jet}} <7}$ GeV/$c$ and $R=0.4$ in pp collisions at $\sqrt{s}$ = 5.02 TeV, in $\mathrm{D^{0}}$-meson transverse momentum intervals: $3< p_{\mathrm{T,D^0}} <4$ GeV/$c$ (left), $4< p_{\mathrm{T,D^0}} <5$ GeV/$c$ (centre), and $5< p_{\mathrm{T,D^0}} <6$ GeV/$c$ (right). The total fit function is represented by the blue solid line, while the red dashed line represents the background fit function. The red and green shaded areas correspond to the peak and sideband regions, respectively. Bottom: $\mathrm{D^{0}}$-jet raw yields as a function of $z_{||}^{\textrm{ch}}$ in the signal and sideband regions, and their subtracted yields. | 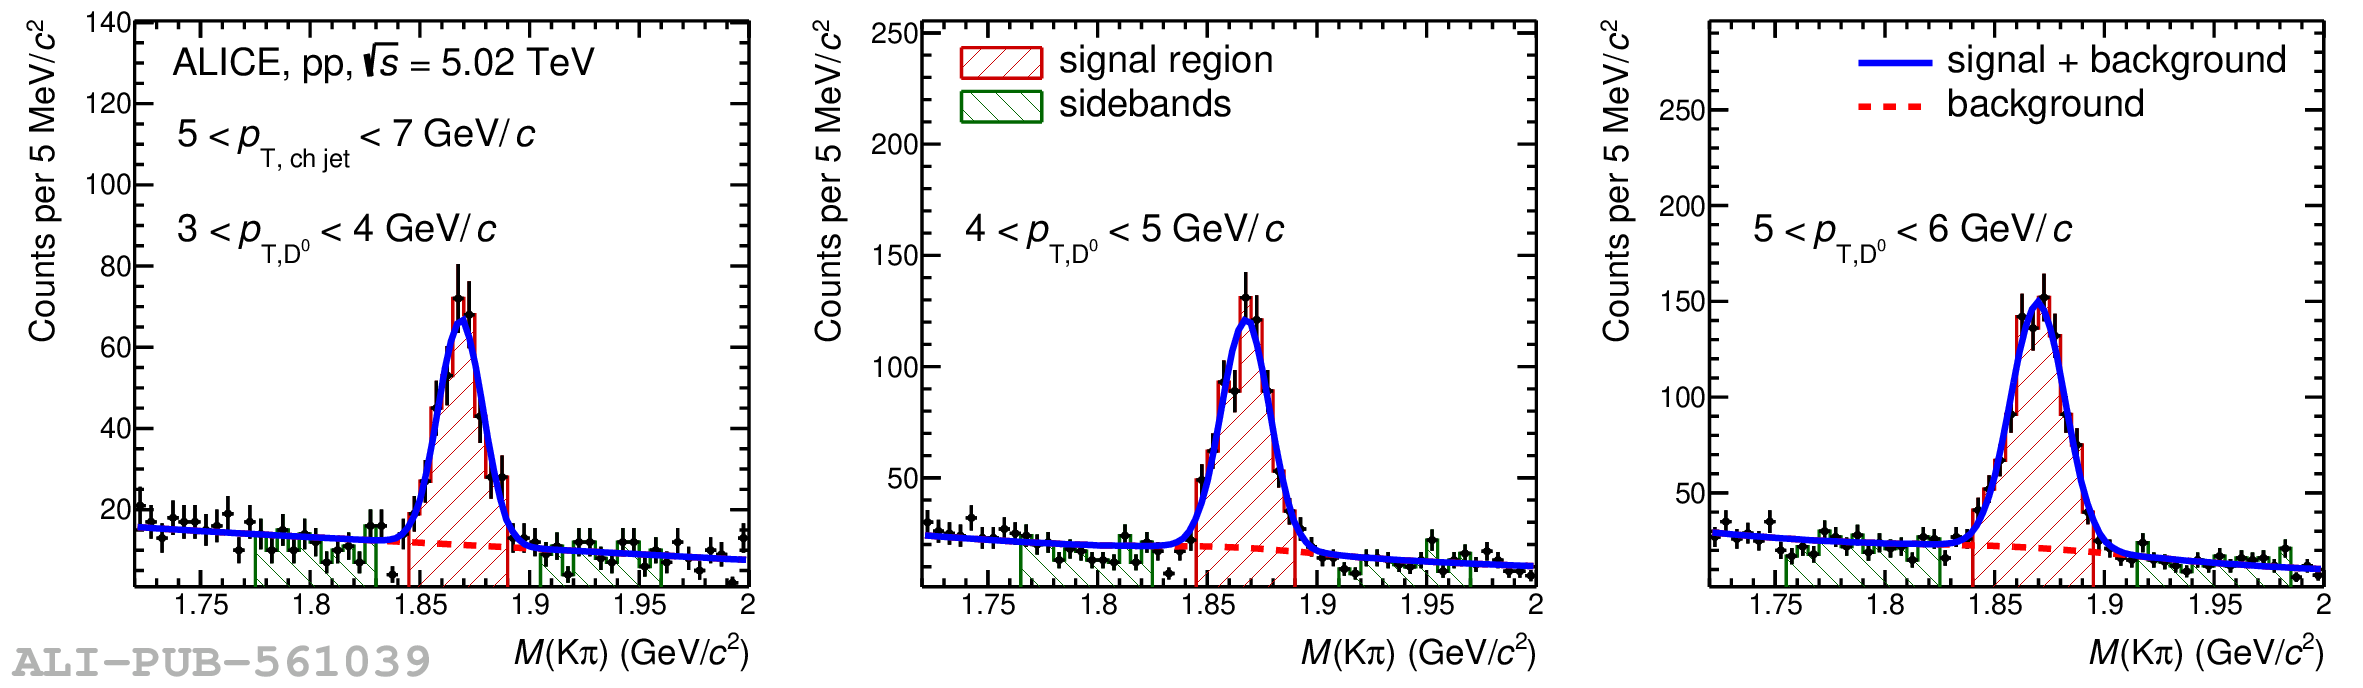 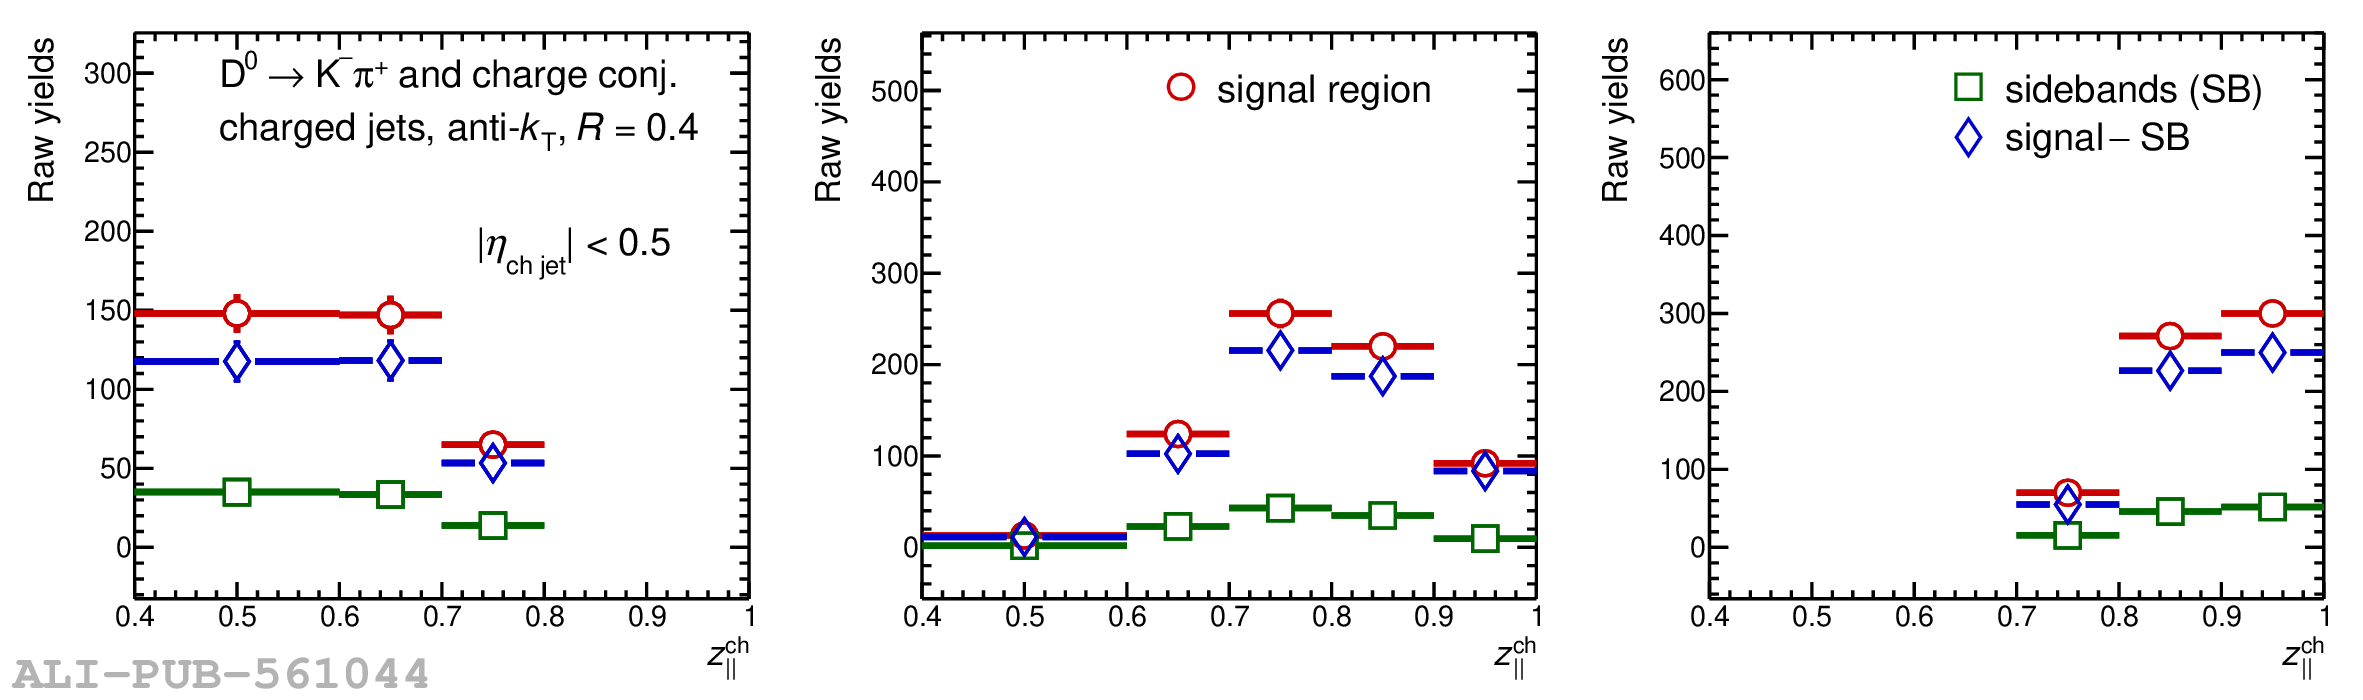 |
Figure 3
Product of acceptance and efficiency, $\textrm{Acc}\times\epsilon$, for $\mathrm{D^{0}}$-jet reconstruction as a function of $p_{\mathrm{T,D^0}}$ with $R=0.4$ in pp collisions at $\sqrt{s}$ = 5.02 TeV. Left: $\textrm{Acc}\times\epsilon$ for prompt and non-prompt $\mathrm{D^{0}}$ jets in the range $5< p_{\mathrm{T,ch\,jet}} <50$ GeV/$c$. Right: $\textrm{Acc}\times\epsilon$ for prompt $\mathrm{D^{0}}$ jets in different jet-$p_{\rm T}$ intervals. |   |
Figure 4
Feed-down fraction of $\mathrm{D^{0}}$ jets from b-hadrons in pp collisions at $\sqrt{s}$ = 5.02 TeV for $R=0.4$ as a function of $p_{\mathrm{T,ch\,jet}}$ in $5< p_{\mathrm{T,ch\,jet}} <50$ GeV/$c$ (left) and as a function of $z_{||}^{\textrm{ch}}$ in two $p_{\mathrm{T,ch\,jet}}$ intervals $5< p_{\mathrm{T,ch\,jet}} <7$ GeV/$c$ and $15< p_{\mathrm{T,ch\,jet}} <50$ GeV/$c$ (right). | 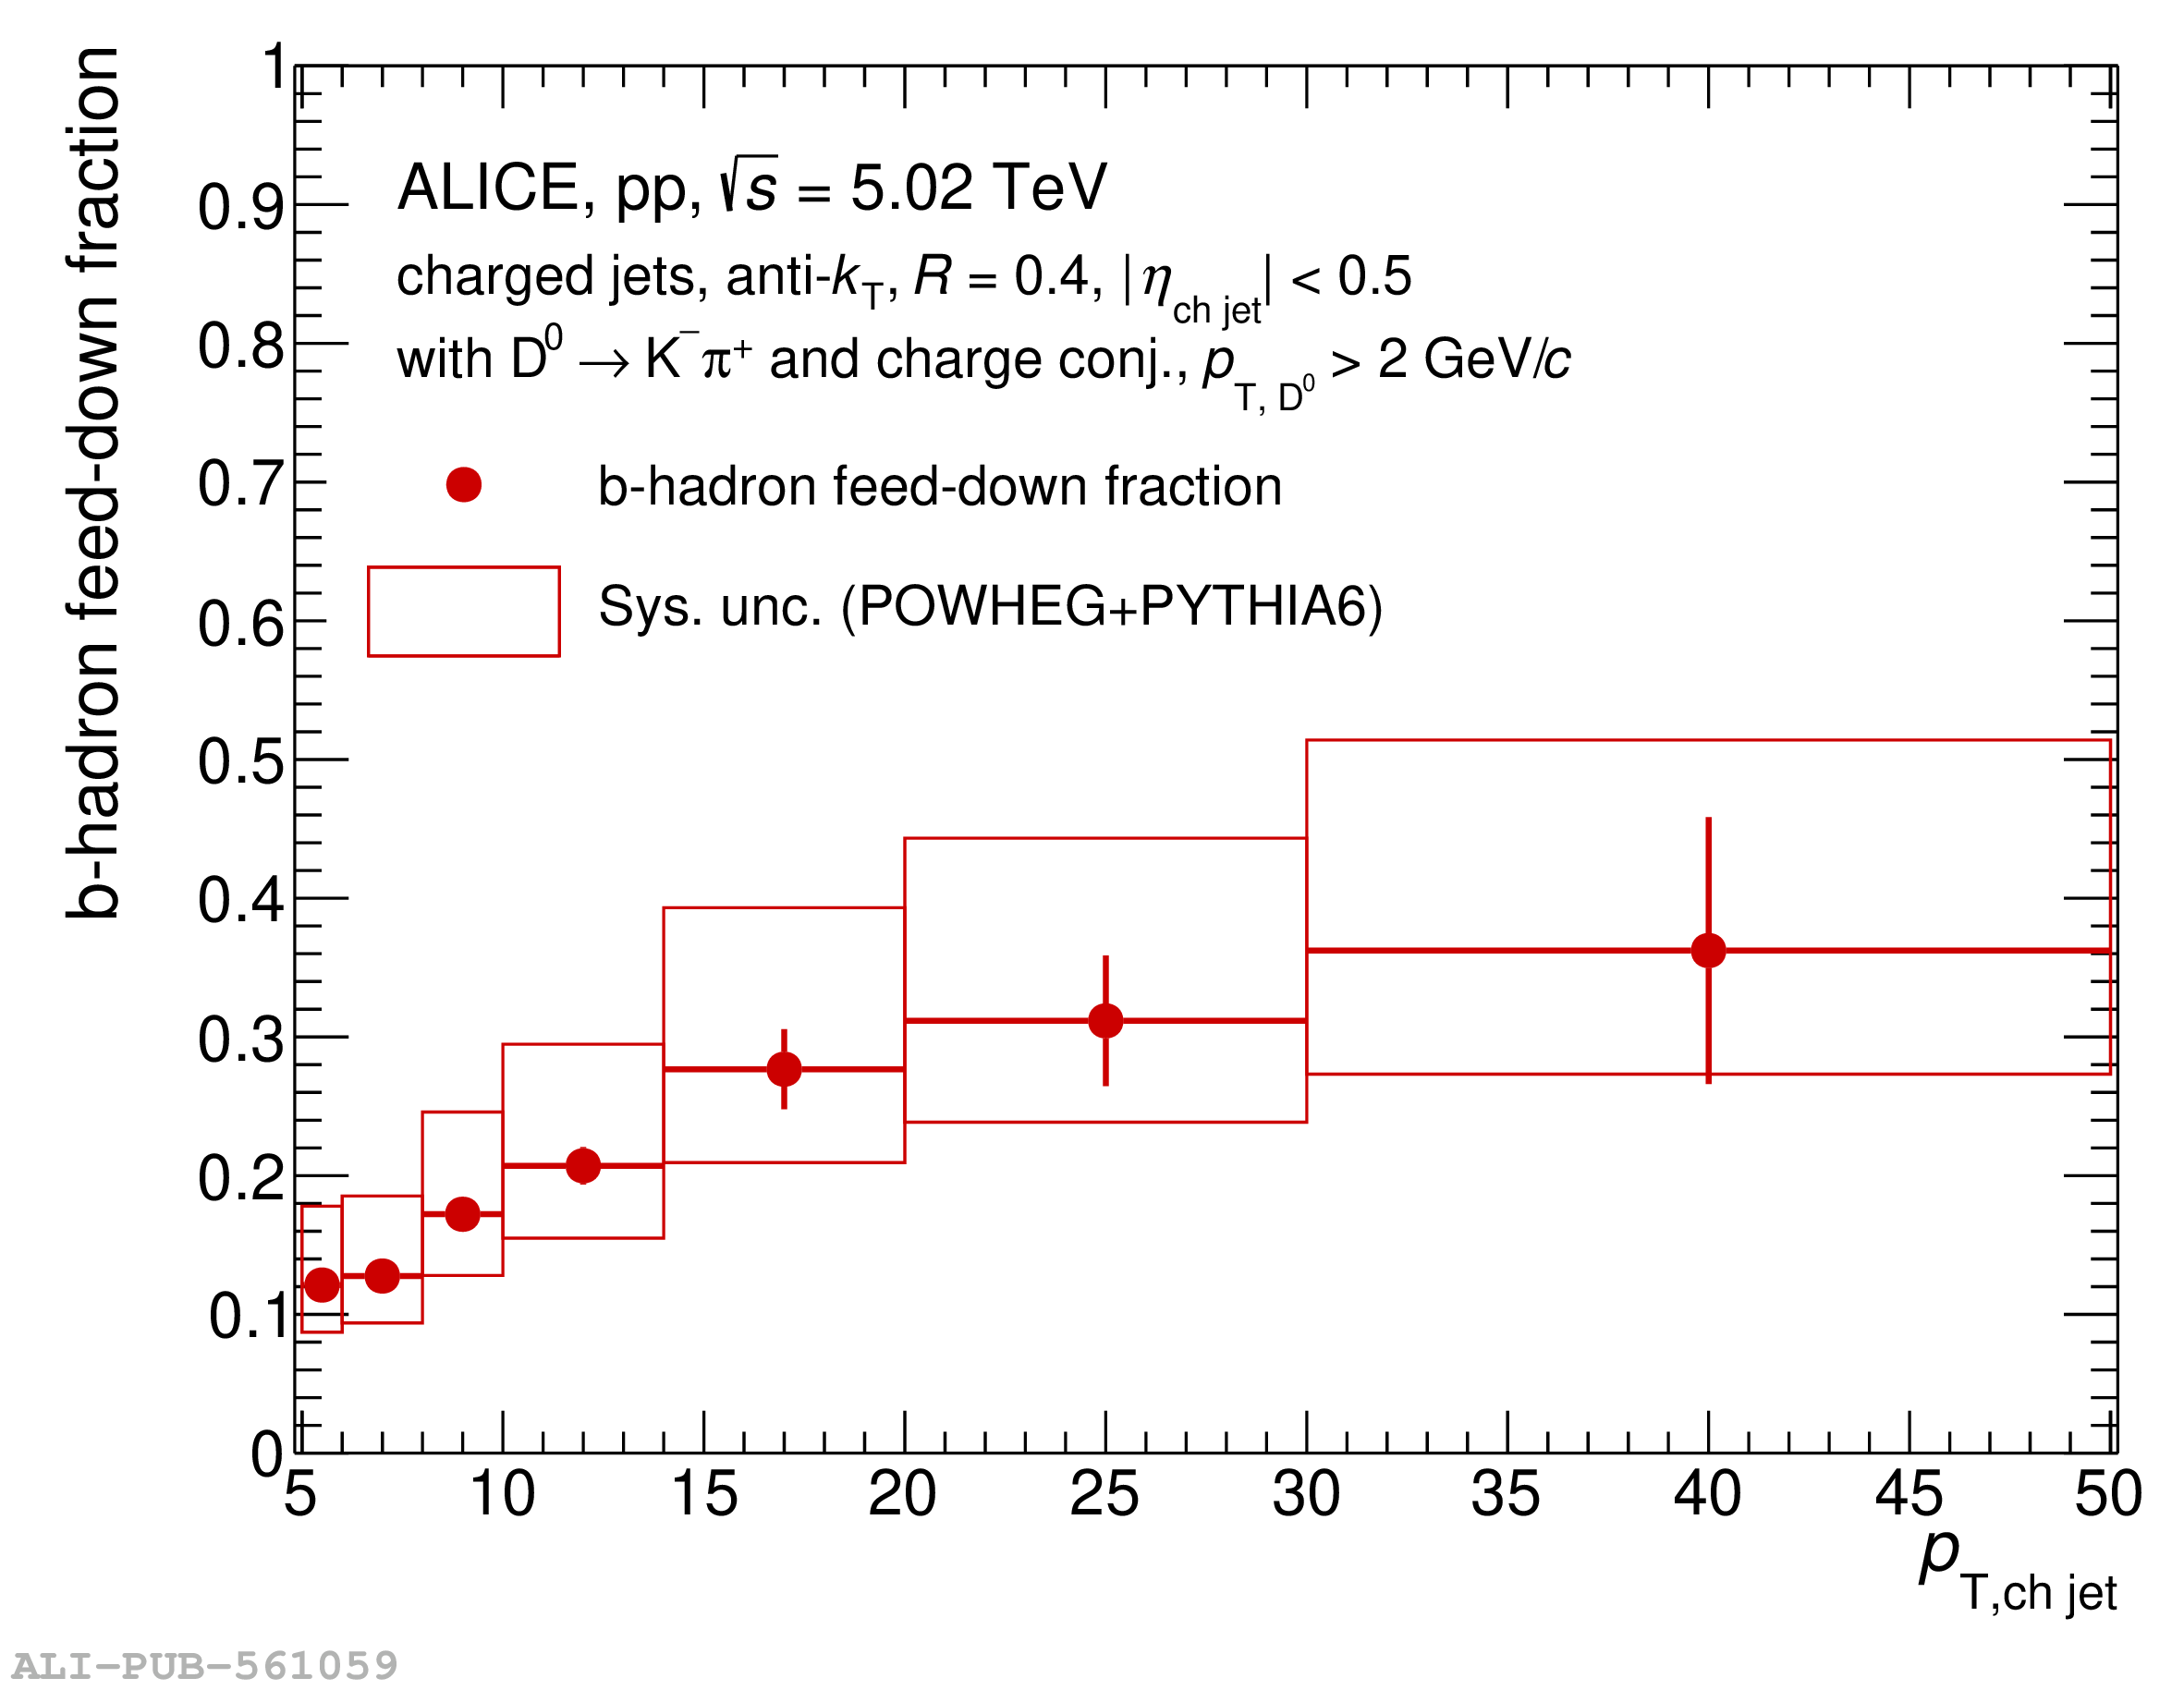 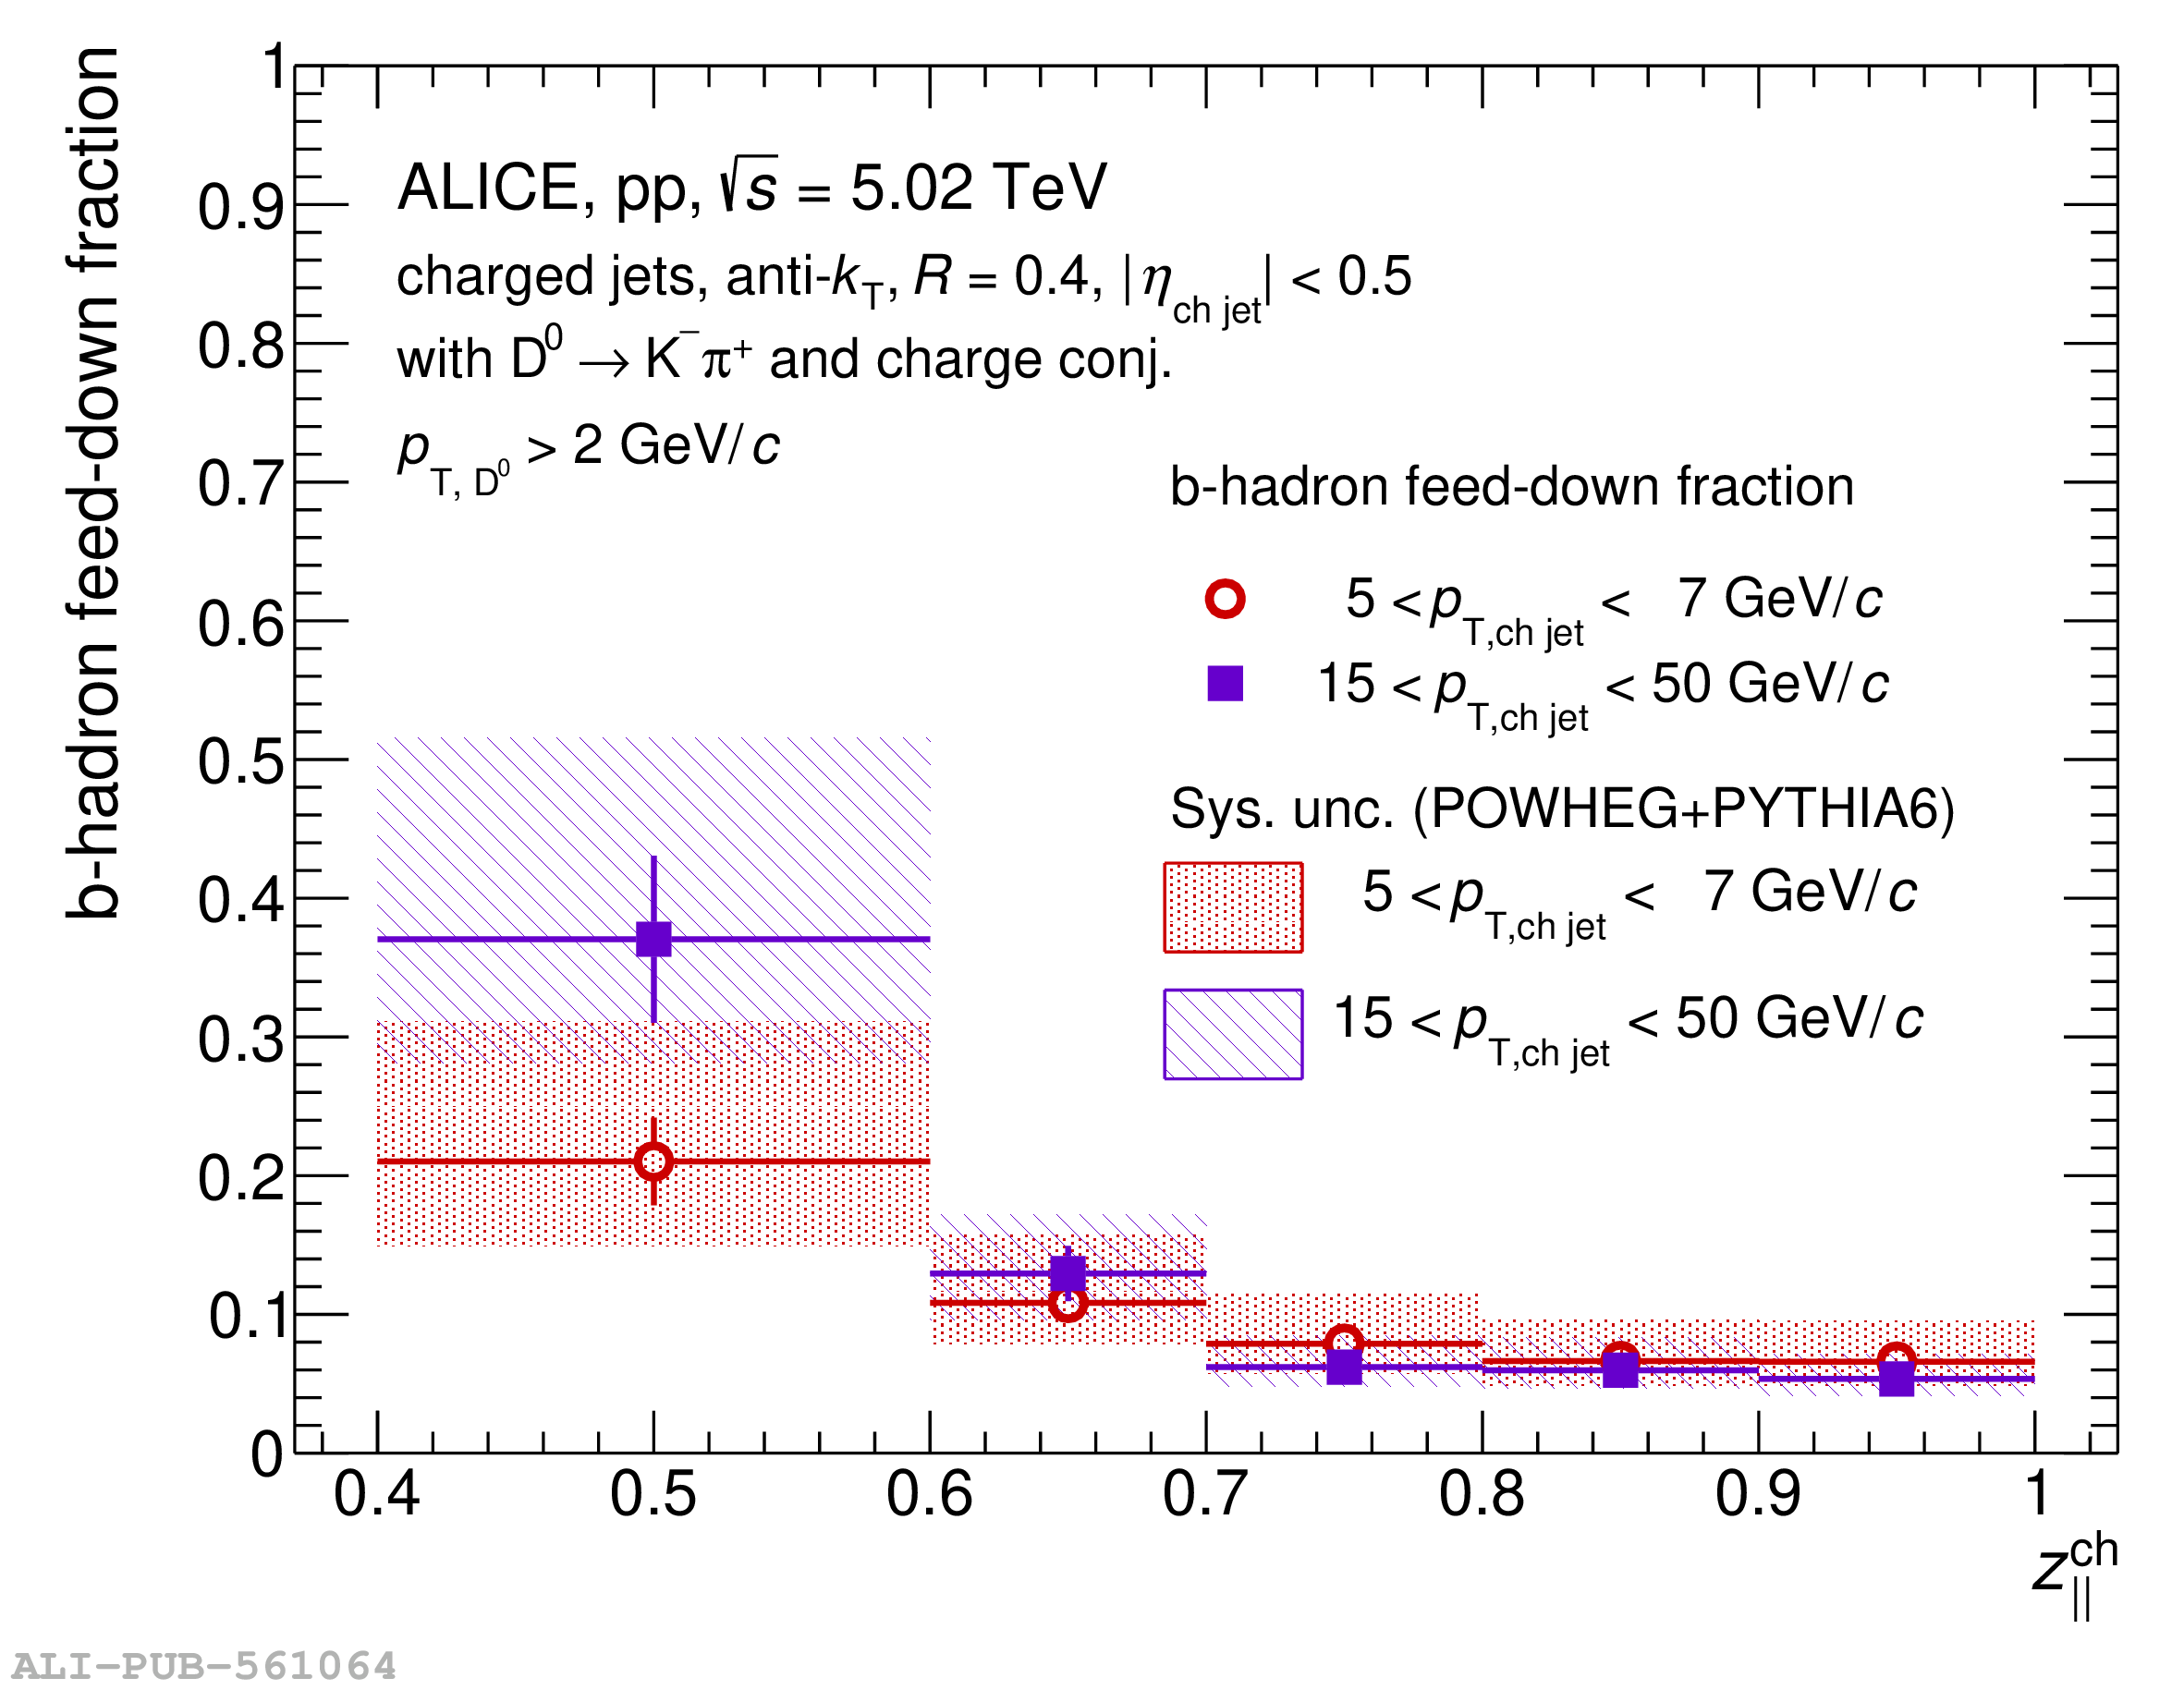 |
Figure 5
Left: detector response matrix of matched jets used for unfolding the $p_{\mathrm{T,ch\,jet}}$ distribution with $R=0.4$ in pp collisions at $\sqrt{s}$ = 5.02 TeV in the range $2< p_{\mathrm{T,ch\,jet}} <50$ GeV/$c$. Right: $p_{\mathrm{T,ch\,jet}}$ resolution, $\Delta_{p}$, for $5< p_{\mathrm{T,ch\,jet}}^{\mathrm{part}} <6$ GeV/$c$, $10< p_{\mathrm{T,ch\,jet}}^{\mathrm{part}} <12$ GeV/$c$, and $20< p_{\mathrm{T,ch\,jet}}^{\mathrm{part}} <30$ GeV/$c$. | 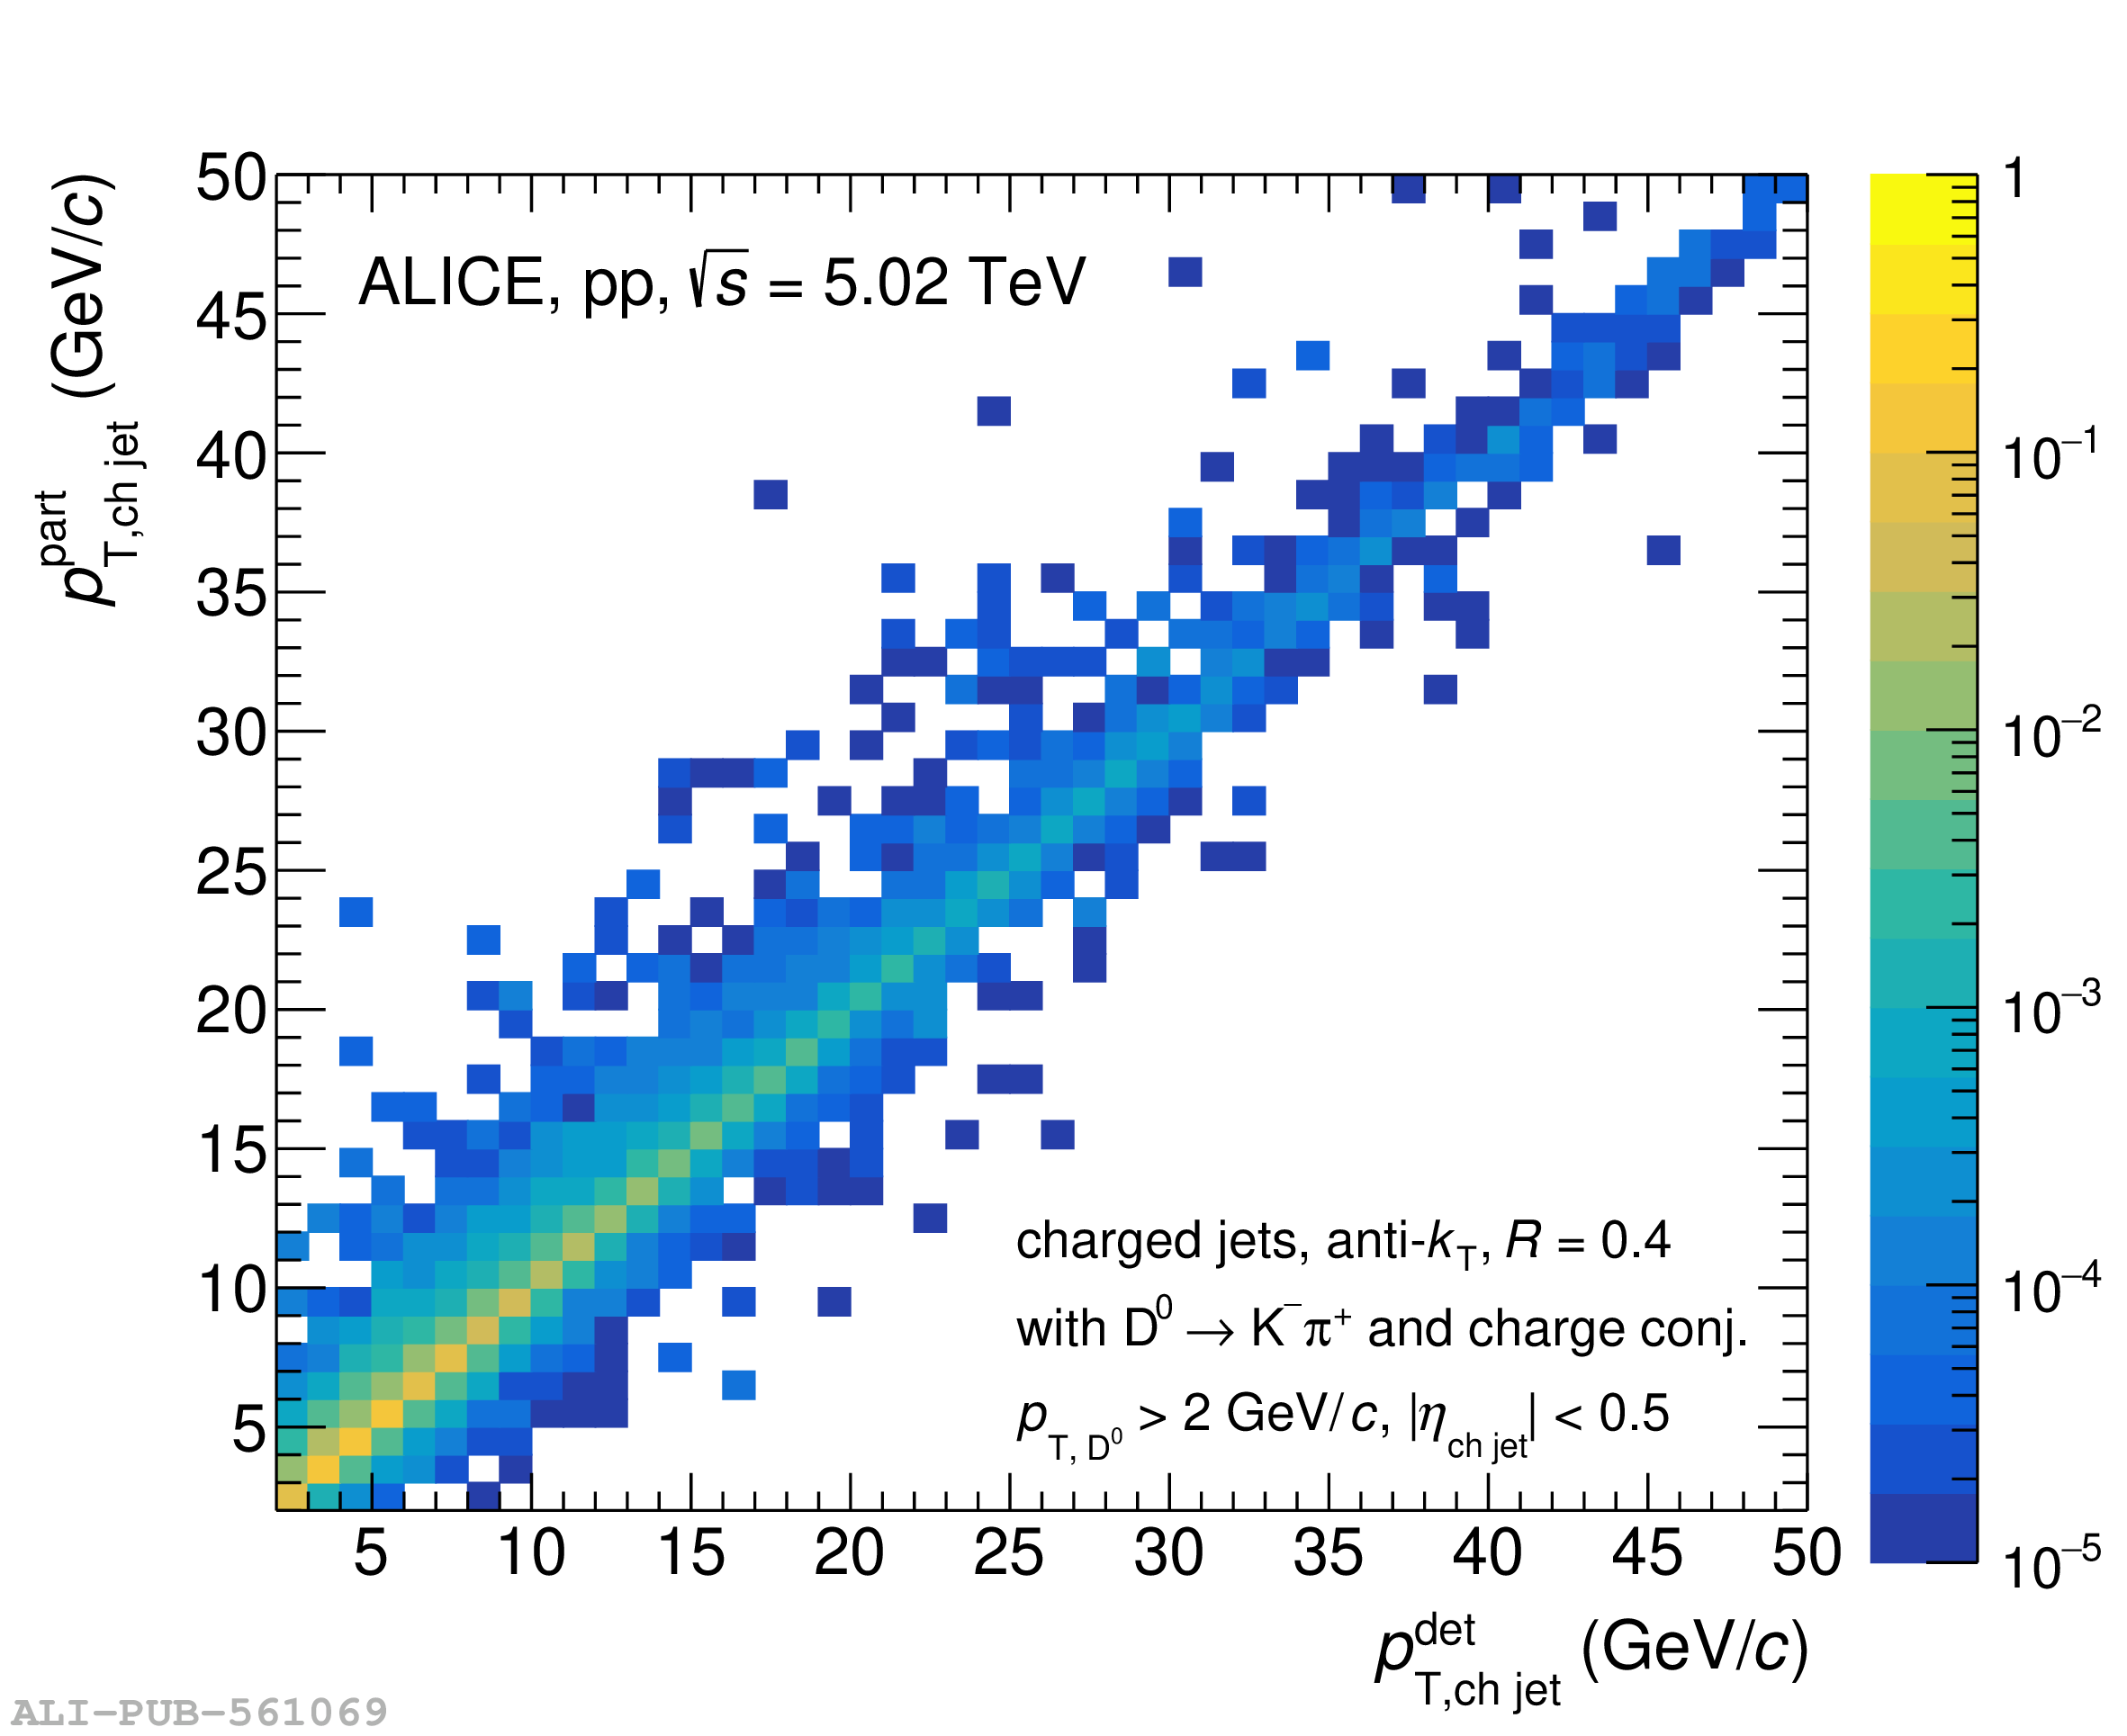  |
Figure 6
Left: detector response matrix of matched jets used for unfolding $z_{||}^{\textrm{ch}}$ distribution with $R=0.4$ in pp collisions at $\sqrt{s}$ = 5.02 TeV in the range $2< p_{\mathrm{T,ch\,jet}} <50$ GeV/$c$ and $0.4< z_{||}^{\textrm{ch}} <1$. Right: $z_{||}^{\textrm{ch}}$ resolution, $\Delta_{z}$, in the $z_{||}^{\textrm{ch,part}}$ intervals 0.4$-$0.6, 0.6$-$0.8, and 0.8$-$1 for the $p_{\mathrm{T,ch\,jet}}$ interval $5< p_{\mathrm{T,ch\,jet}}^{\mathrm{part}} <7$ GeV/$c$. | 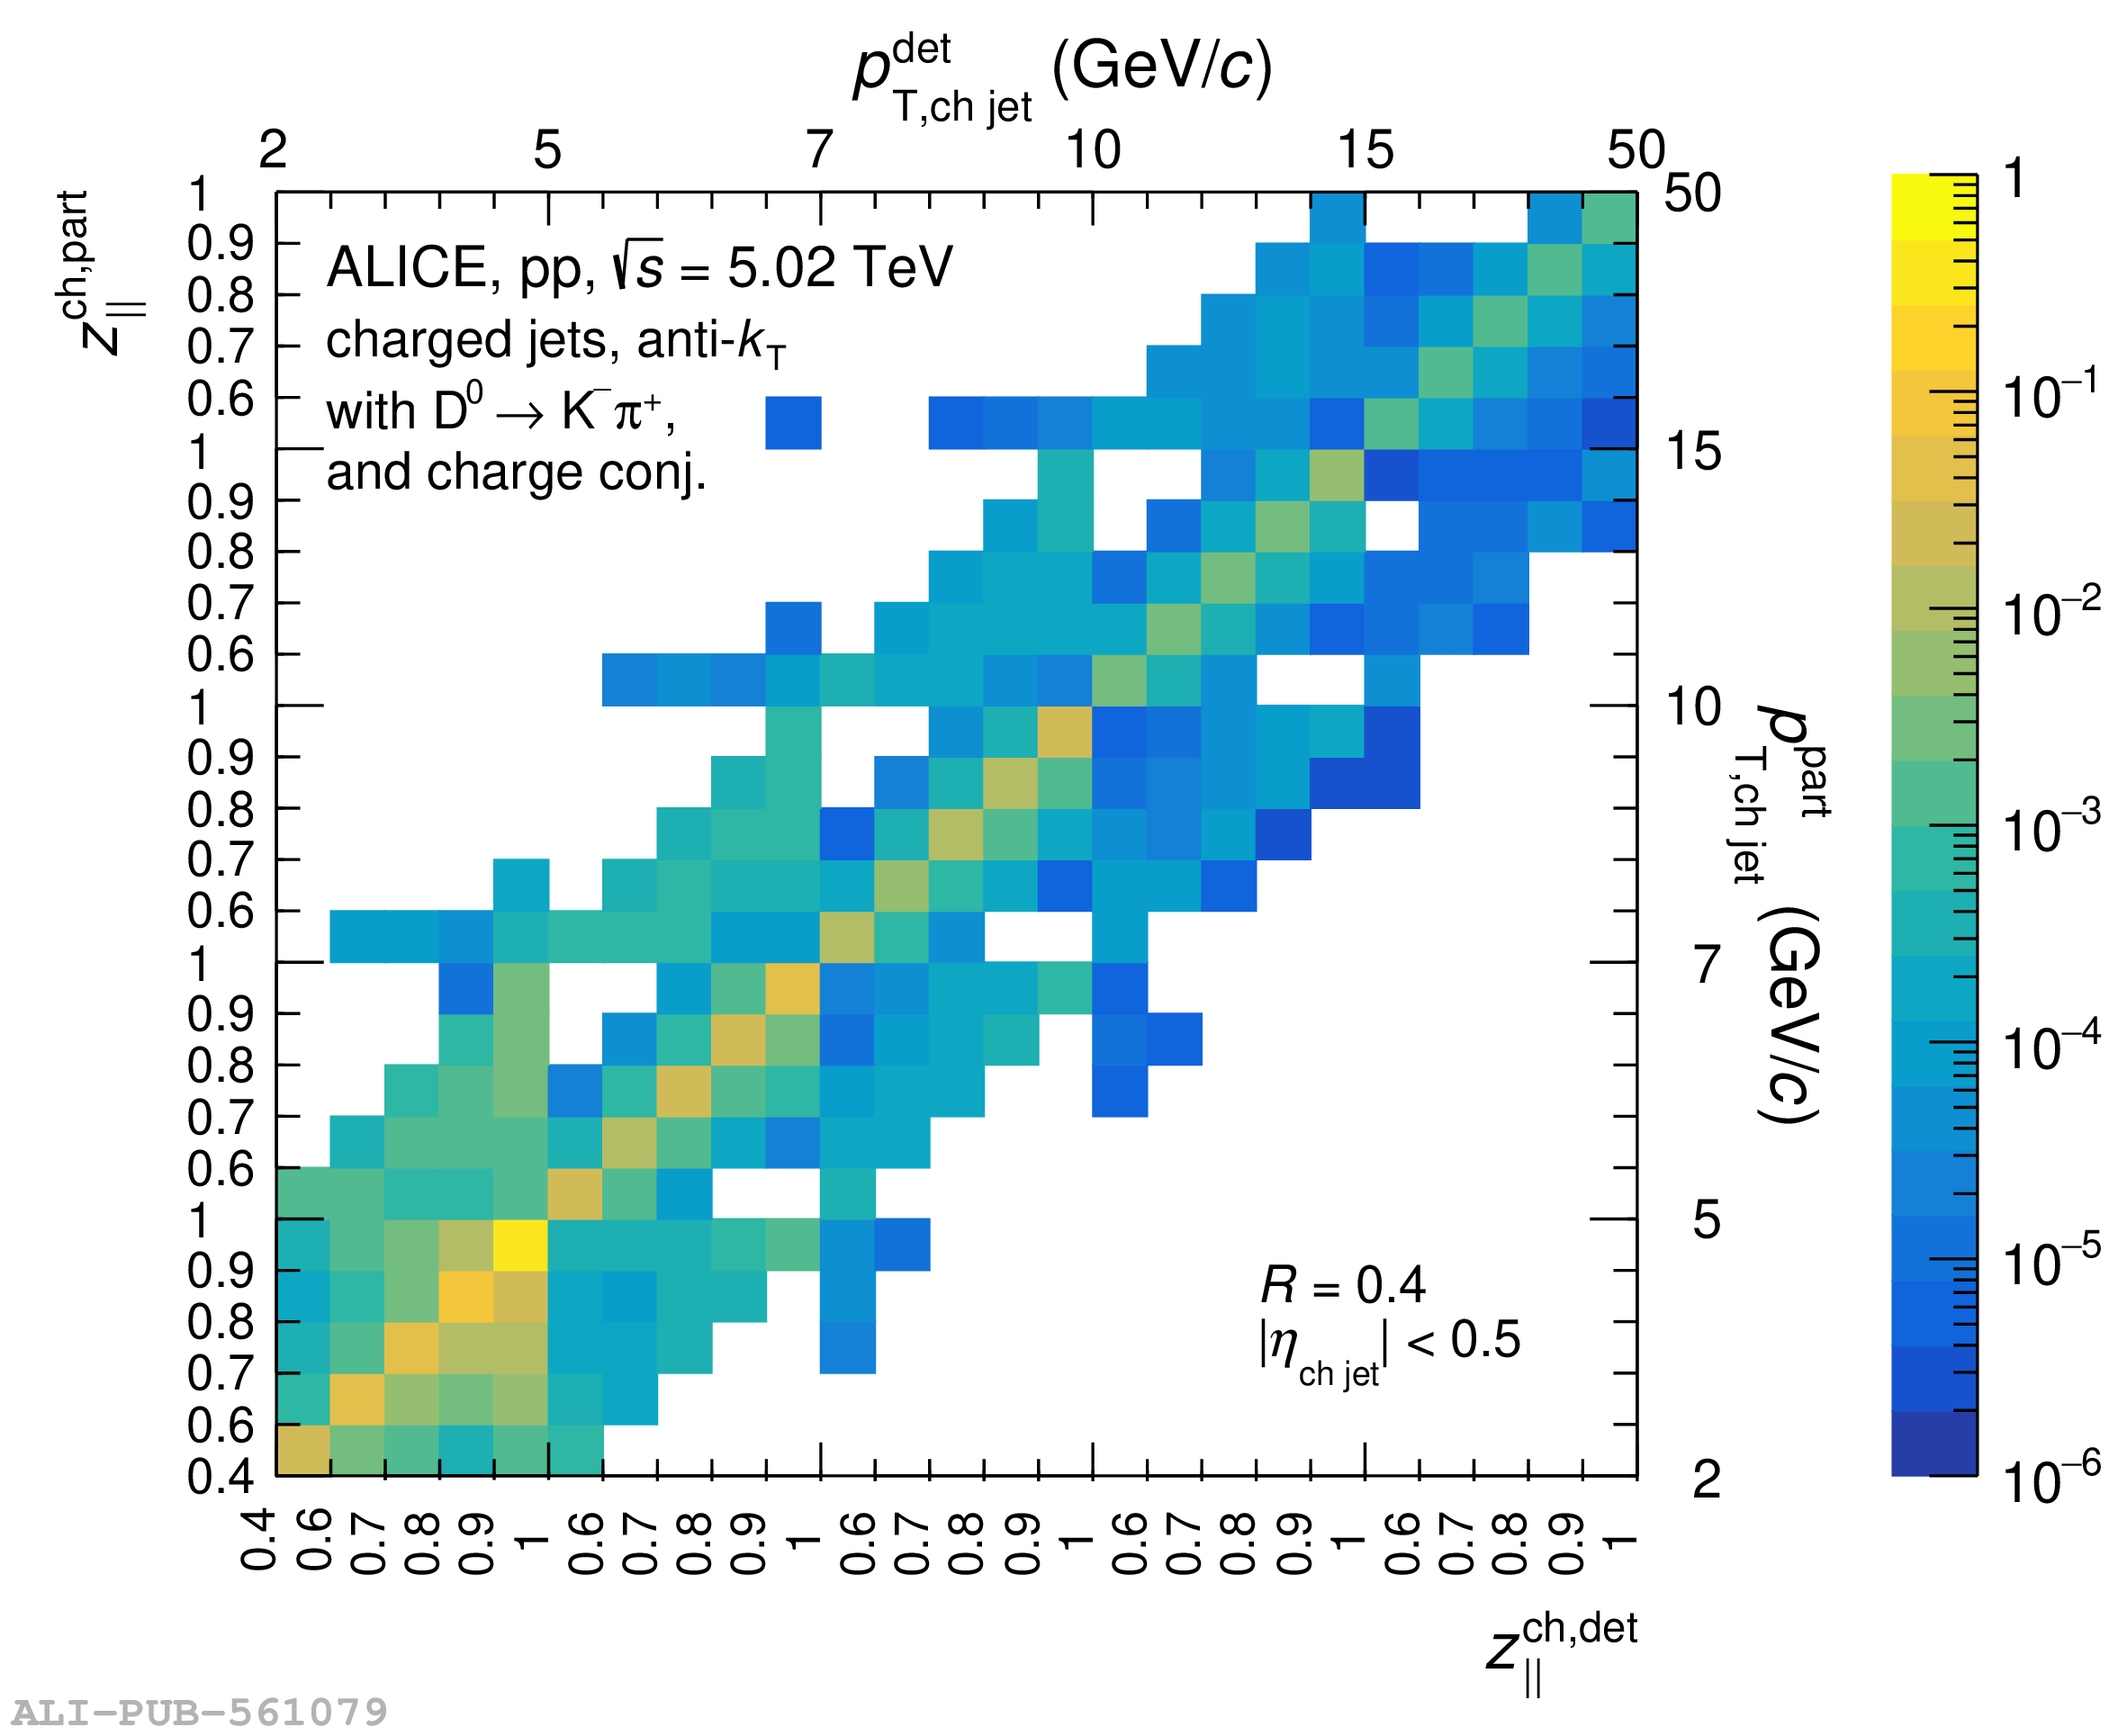 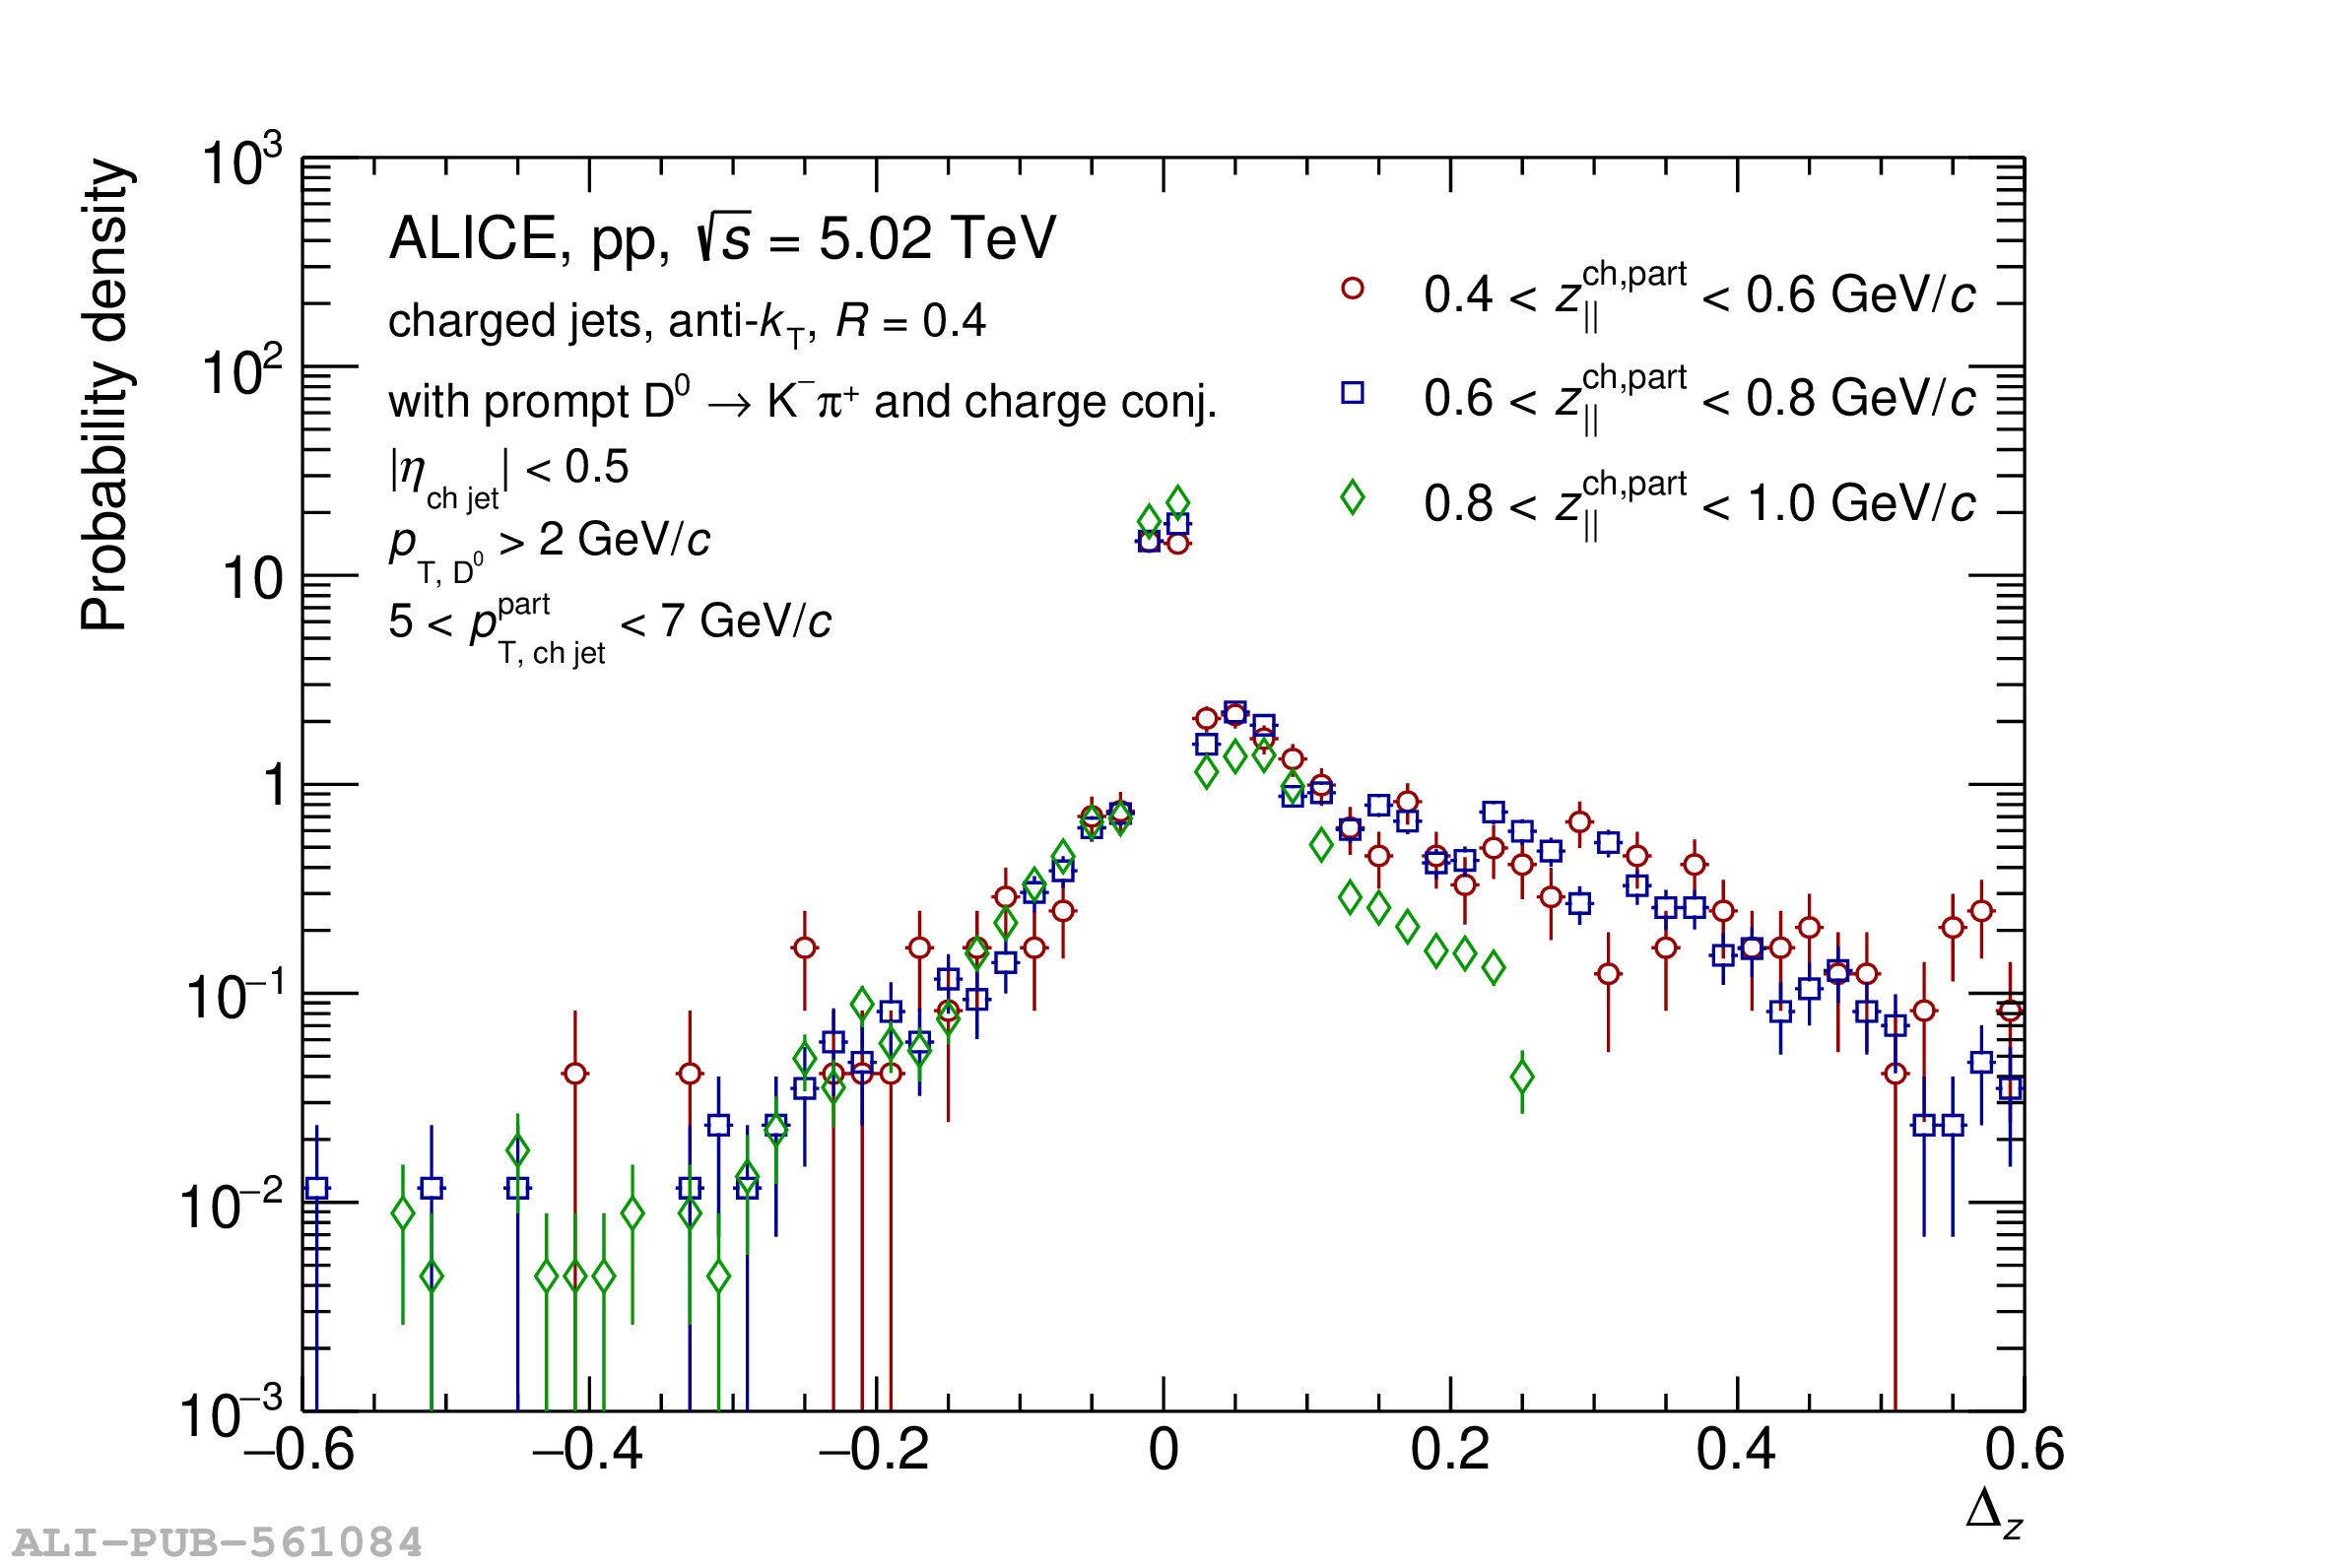 |
Figure 7
Top panels: $p_{\mathrm{T,ch\,jet}}$-differential cross section of charm jets tagged with $\mathrm{D^{0}}$ mesons for $R=0.2$ (circles, scaled by 0.1), $0.4$ (squares) and $0.6$ (crosses, scaled by 10) in pp collisions at $\sqrt{s}$ = 13 TeV (left) and $\sqrt{s}$ = 5.02 TeV (right) compared to PYTHIA 8 HardQCD Monash 2013 (dash-dotted lines), PYTHIA 8 SoftQCD Mode 2 (dashed lines), and POWHEG hvq + PYTHIA 8 (open circles) predictions. The shaded bands indicate the systematic uncertainty on the data cross section while open boxes represent the theoretical uncertainties on the POWHEG predictions. Bottom panels: ratios of MC predictions to the data for $R=0.2$, $0.4$ and $0.6$. | 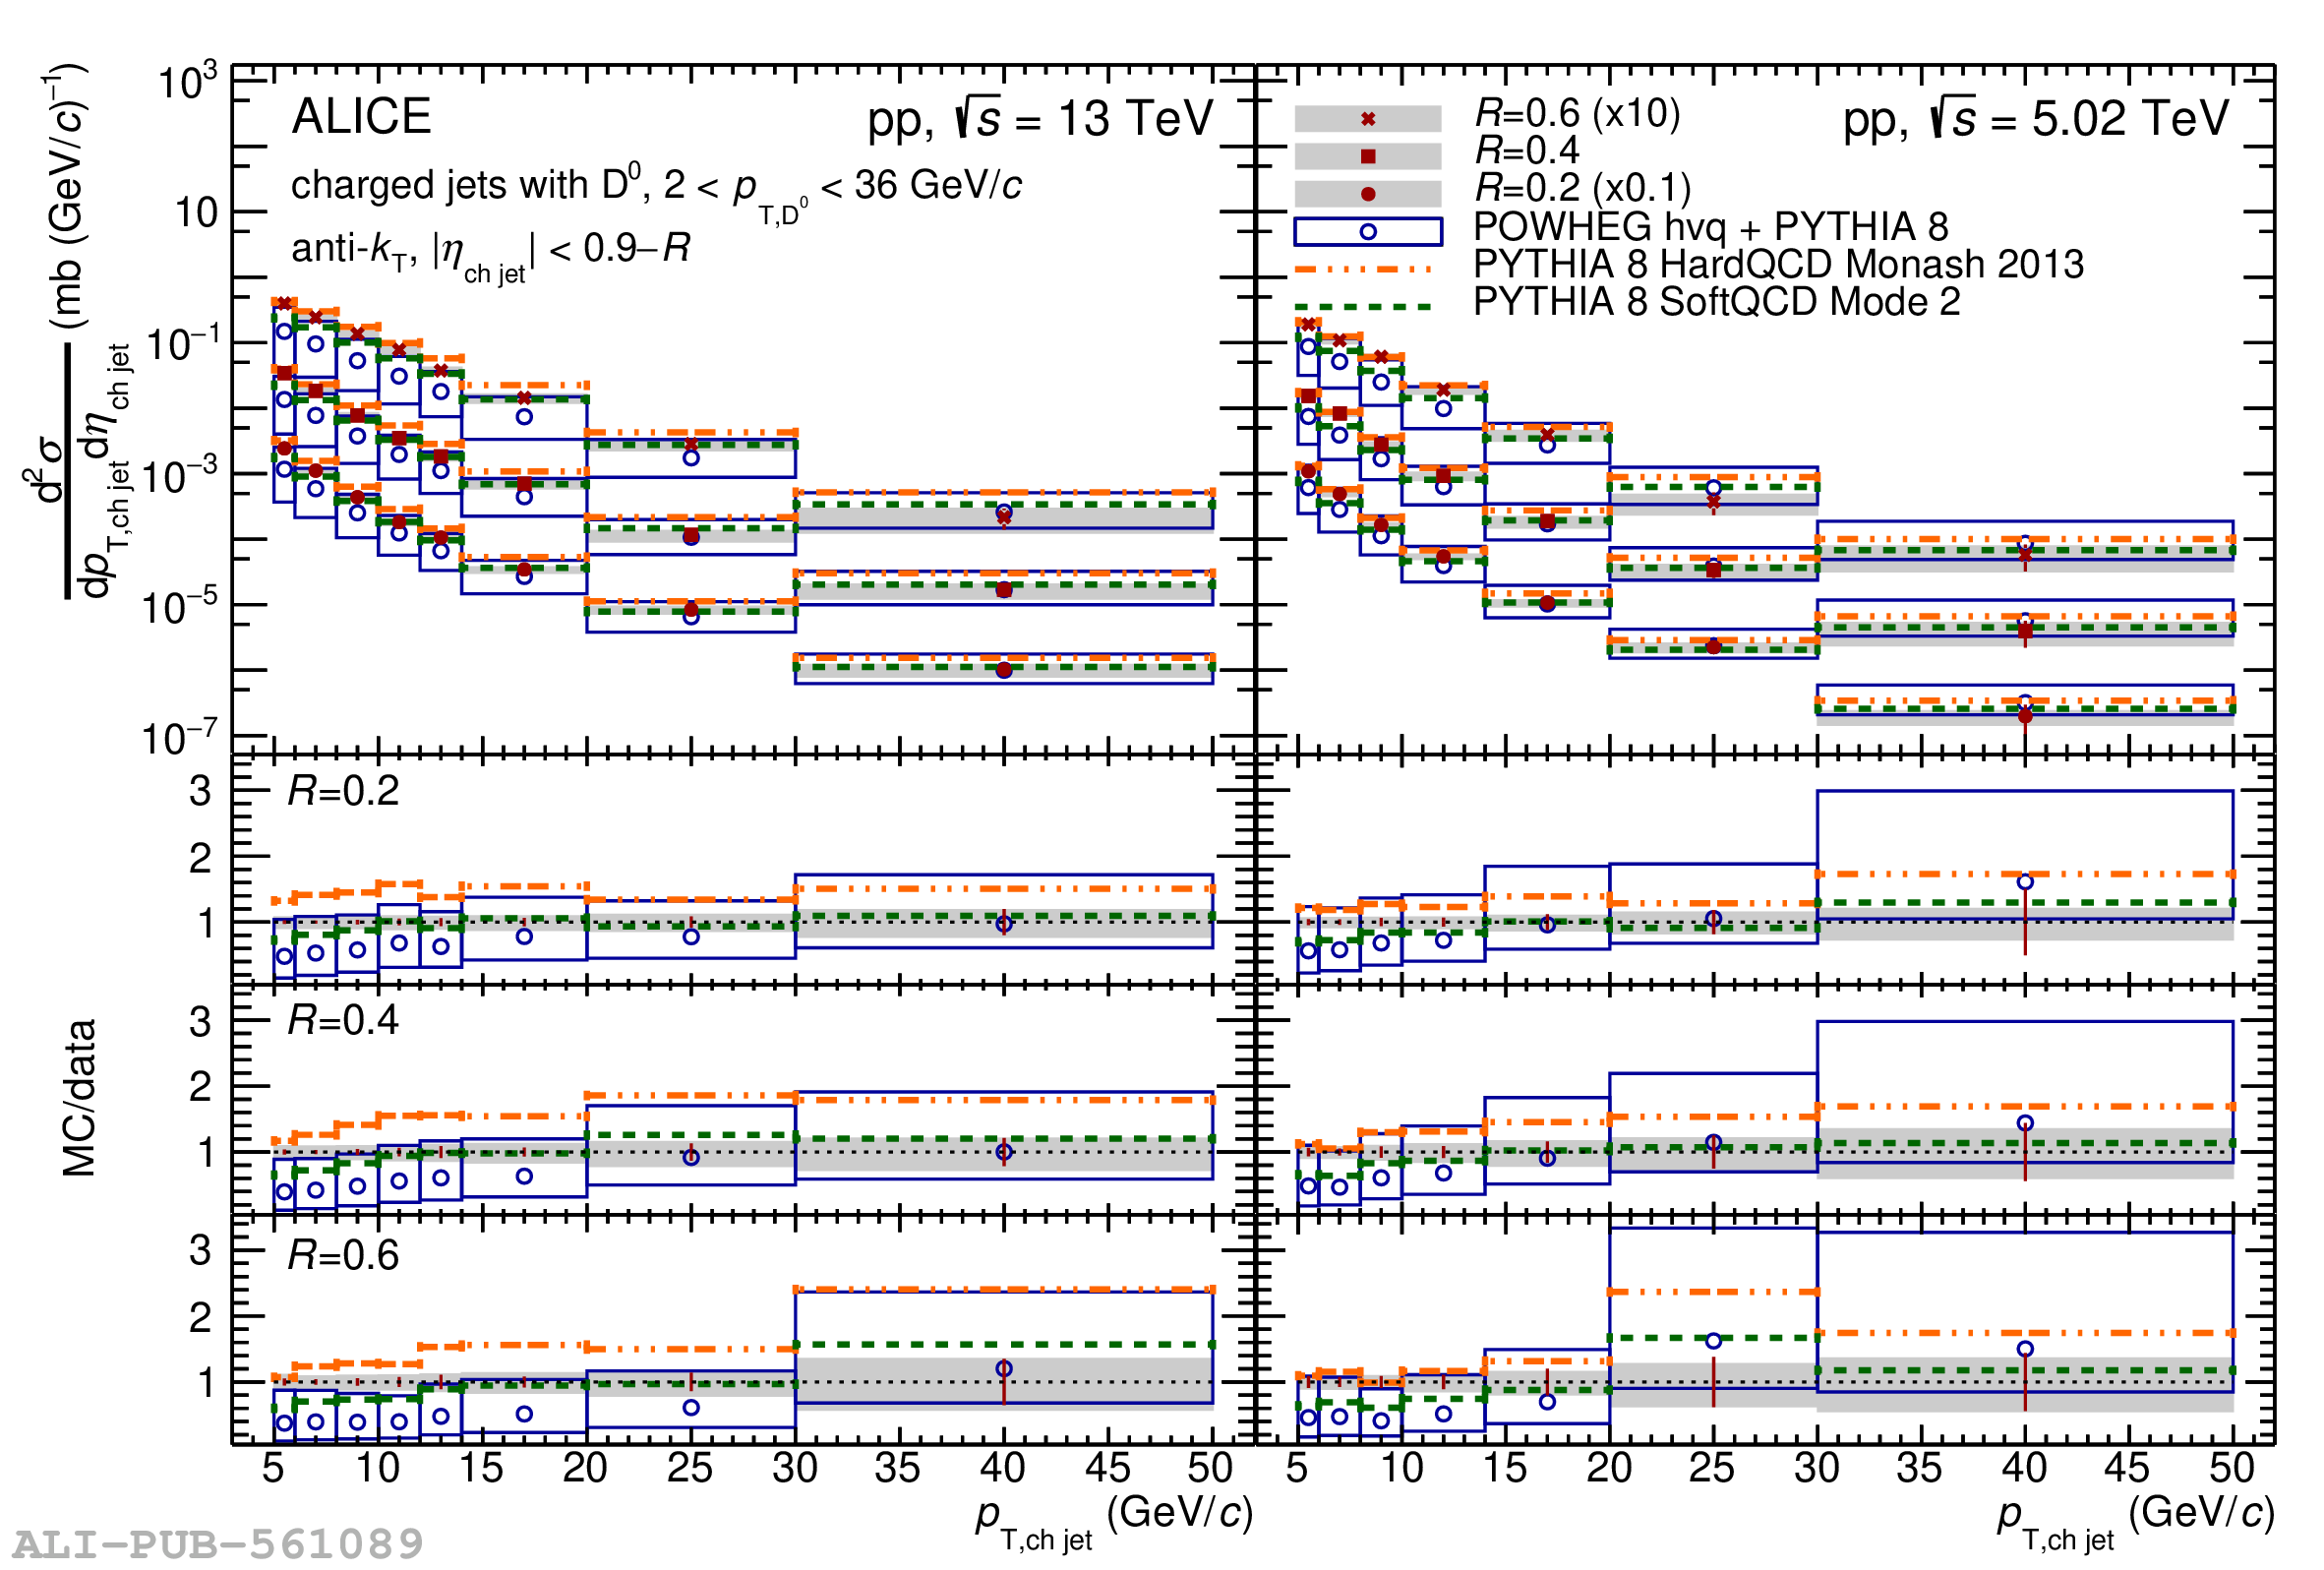 |
Figure 8
Top: ratios of $p_{\mathrm{T,ch\,jet}}$-differential cross section of charm jets tagged with $\mathrm{D^{0}}$ mesons in pp collisions at $\sqrt{s}$ = 13 TeV to $\sqrt{s}$ = 5.02 TeV for $R=0.2$ (left), $R=0.4$ (centre), and $R=0.6$ (right) compared to PYTHIA 8 HardQCD Monash 2013 (dash-dotted lines), PYTHIA 8 SoftQCD Mode 2 (dashed lines), and POWHEG hvq + PYTHIA 8 (open circles) predictions. The shaded bands indicate the systematic uncertainty on the cross section ratios while open boxes represent the theoretical uncertainties on the POWHEG predictions. Bottom: ratios of MC predictions to the data. |  |
Figure 9
Top: ratios of $p_{\mathrm{T,ch\,jet}}$-differential cross section of charm jets tagged with $\mathrm{D^{0}}$ mesons for different $R$: $\sigma(R=0.2)/\sigma(R=0.4)$ (circles, shifted up by 0.5) and $\sigma(R=0.2)/\sigma(R=0.6)$ (squares) in pp collisions at $\sqrt{s}$ = 13 TeV (left) and $\sqrt{s}$ = 5.02 TeV (right) compared to PYTHIA 8 HardQCD Monash 2013 (dash-dotted lines), PYTHIA 8 SoftQCD Mode 2 (dashed lines), and POWHEG hvq + PYTHIA 8 (open circles) predictions. The shaded bands indicate the systematic uncertainty on the cross section ratios while open boxes represent the theoretical uncertainties on the POWHEG predictions. Bottom: ratios of MC predictions to the data for $\sigma(R=0.2)/\sigma(R=0.4)$ and $\sigma(R=0.2)/\sigma(R=0.6)$, respectively. | 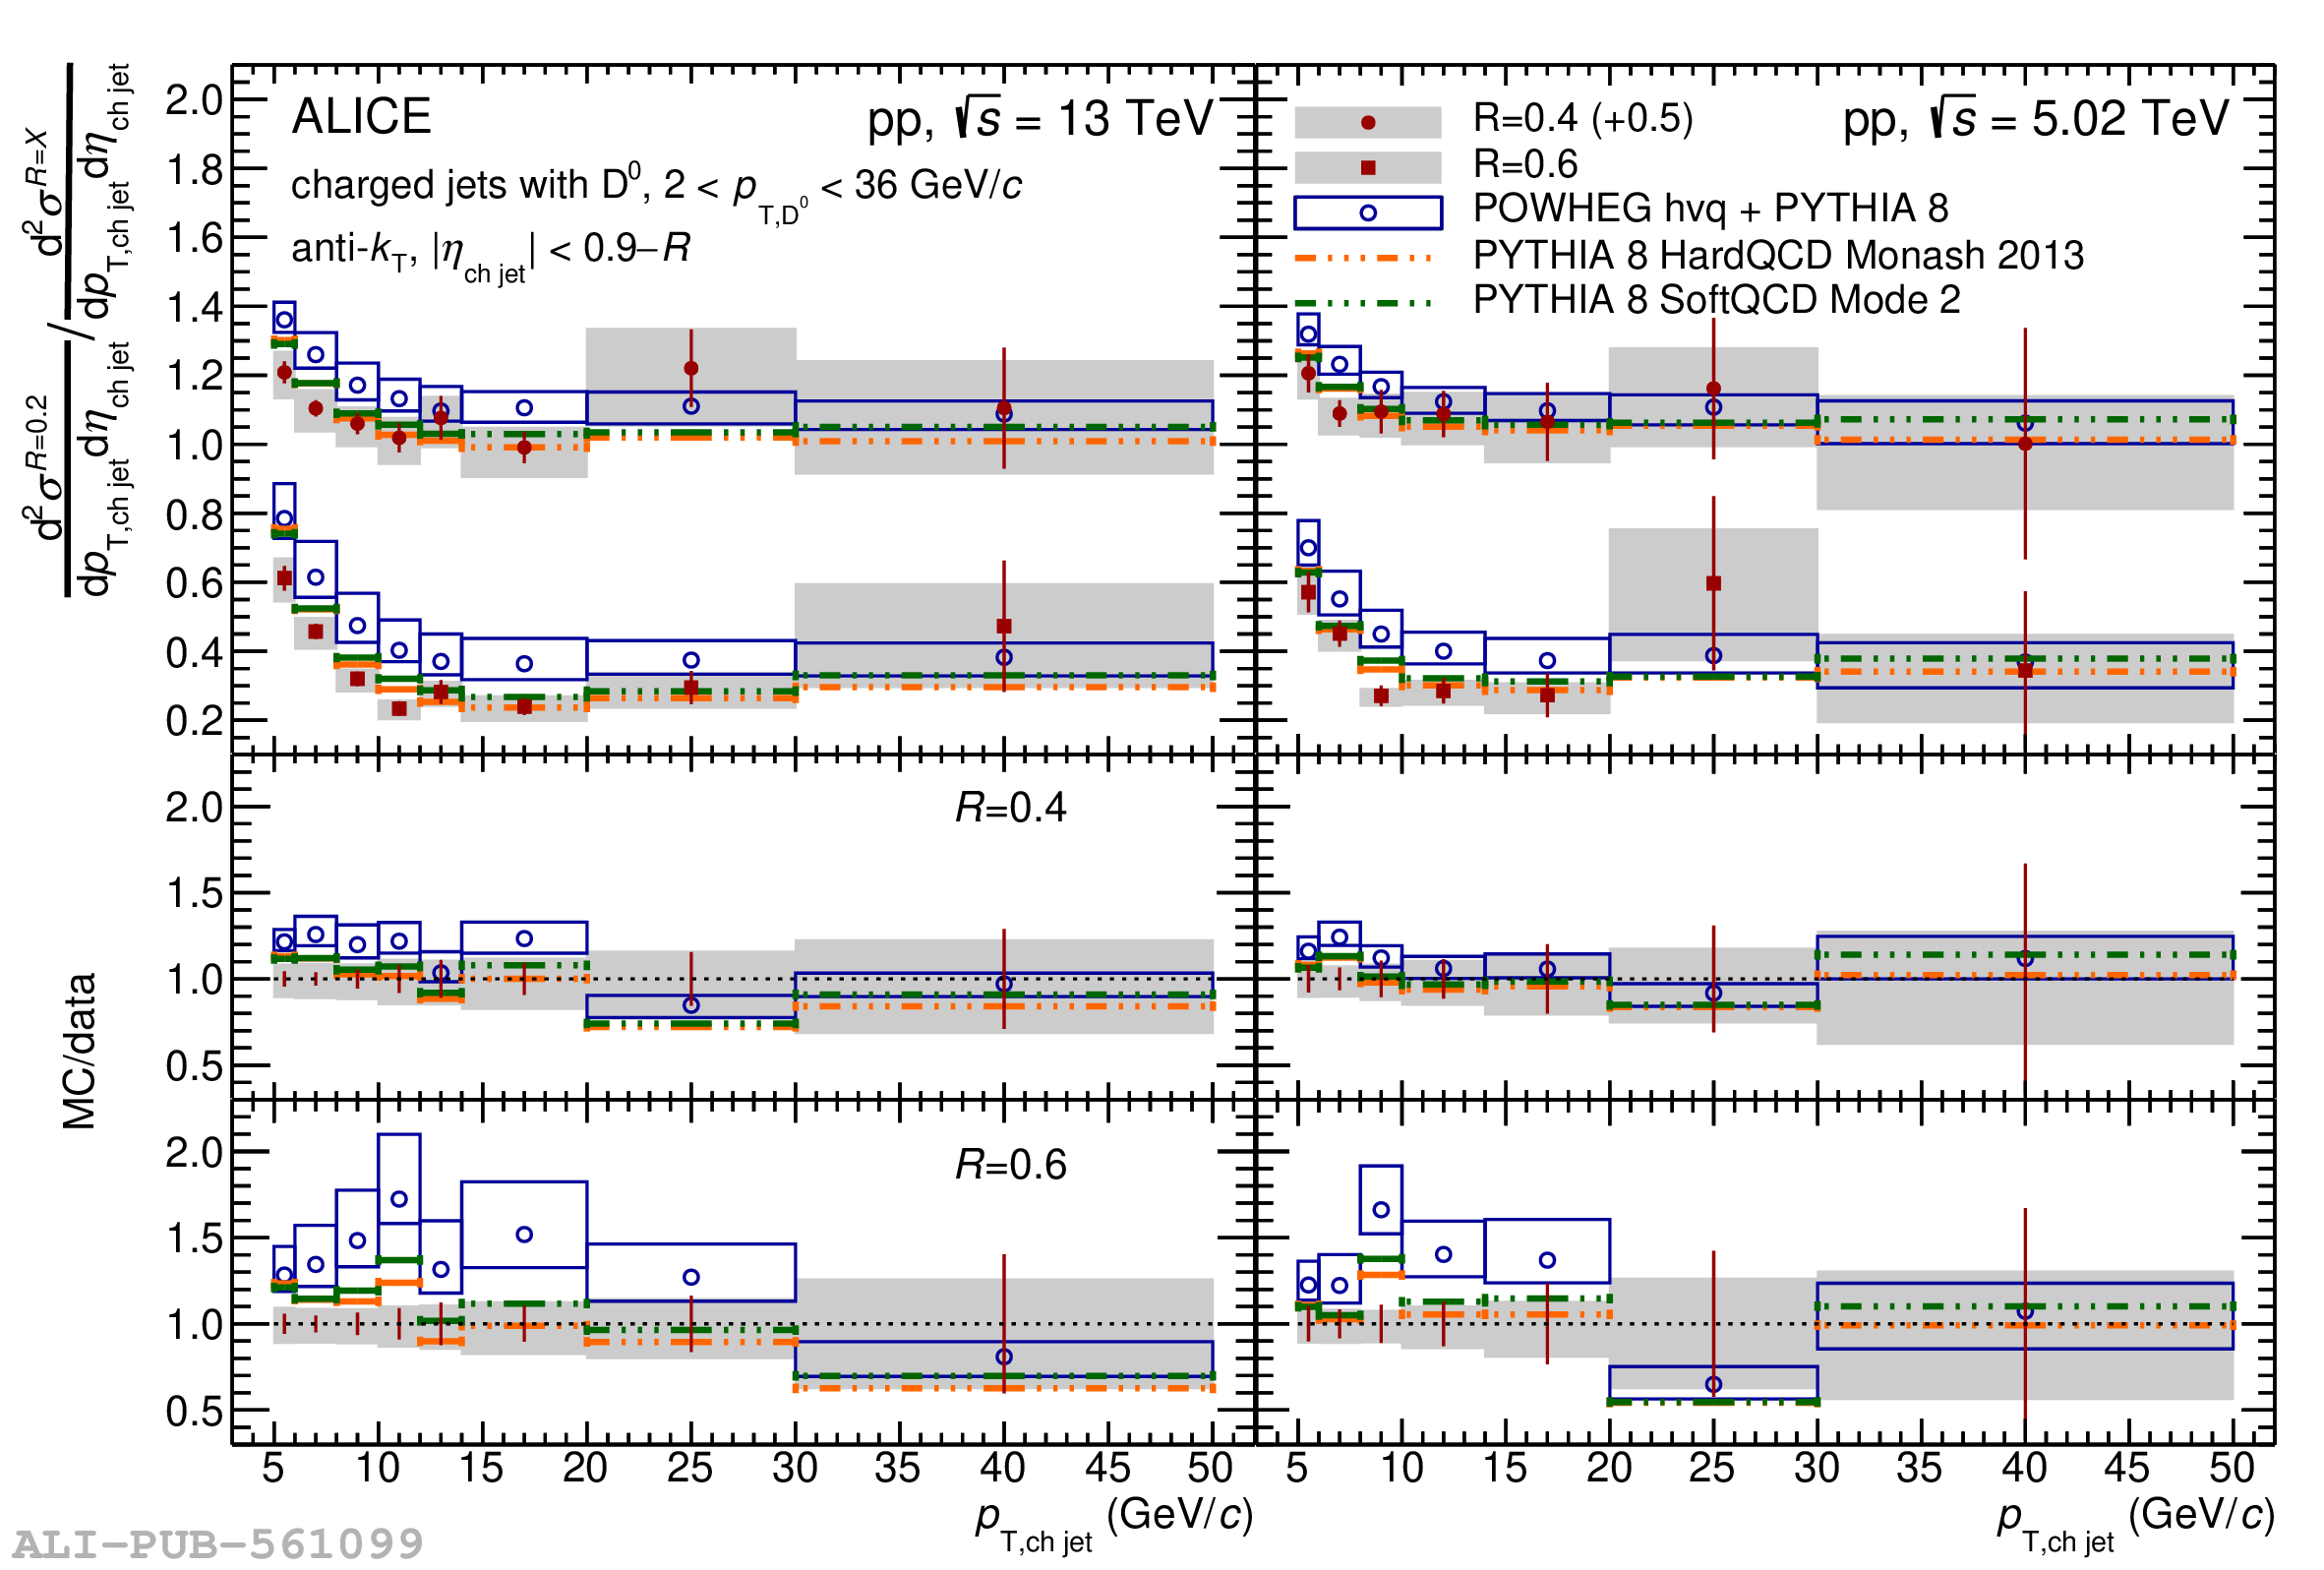 |
Figure 10
The fraction of $\mathrm{D^{0}}$ jets over inclusive charged-particle jets in pp collisions at $\sqrt{s}$ = 5.02 TeV for (a) $R = 0.2$, (b) $R = 0.4$, and (c) $R = 0.6$ compared to PYTHIA 8 HardQCD Monash 2013 (dash-dotted lines) and POWHEG hvq + PYTHIA 8 (open circles) predictions. The shaded bands indicate the systematic uncertainty on the data cross section ratios while the open boxes represent the theoretical uncertainties on the POWHEG predictions. | 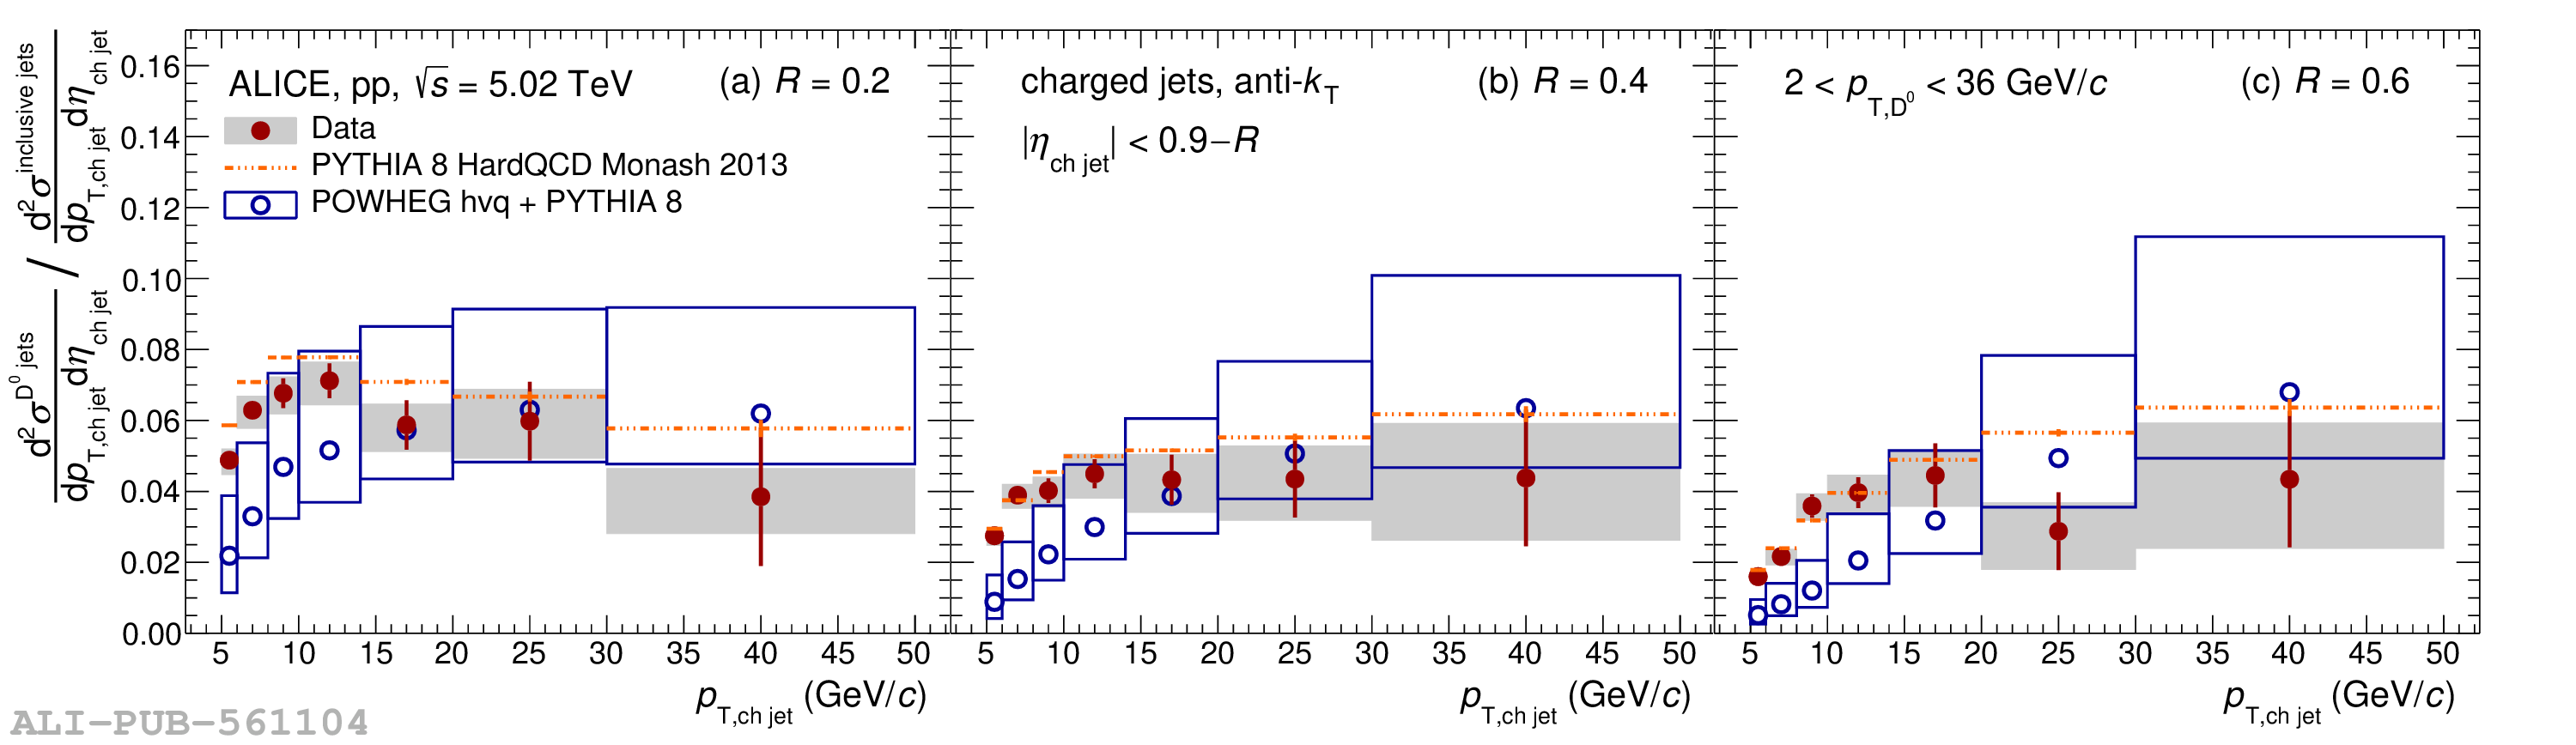 |
Figure 11
Distributions of $z_{||}^{\textrm{ch}}$-differential yield of charm jets tagged with $\mathrm{D^{0}}$ mesons normalised by the number of $\mathrm{D^{0}}$ jets within each distribution in pp collisions at $\sqrt{s}$ = 13 TeV in four jet-$p_{\rm T}$ intervals ${5< p_{\mathrm{T,ch\,jet}} <7}$ GeV/$c$, ${7< p_{\mathrm{T,ch\,jet}} <10}$ GeV/$c$, ${10< p_{\mathrm{T,ch\,jet}} <15}$ GeV/$c$, and ${15< p_{\mathrm{T,ch\,jet}} <50}$ GeV/$c$ from left to right, respectively. Top, middle, and bottom rows represent jets with $R=0.2$, $0.4$, and $0.6$, respectively. They are compared to PYTHIA 8 HardQCD Monash 2013 (dash-dotted lines), PYTHIA 8 SoftQCD Mode 2 (dashed lines), and POWHEG hvq + PYTHIA 8 (open circles) predictions. The shaded bands indicate the systematic uncertainty on the distributions. Bottom panels present ratios of MC predictions to the data. |  |
Figure 12
Distributions of $z_{||}^{\textrm{ch}}$-differential yield of charm jets tagged with $\mathrm{D^{0}}$ mesons and normalised by the number of $\mathrm{D^{0}}$ jets within each distribution in pp collisions at $\sqrt{s}$ = 5.02 TeV in four $p_{\mathrm{T,ch\,jet}}$ intervals $5< p_{\mathrm{T,ch\,jet}} <7$ GeV/$c$, ${7< p_{\mathrm{T,ch\,jet}} <10}$ GeV/$c$, ${10< p_{\mathrm{T,ch\,jet}} <15}$ GeV/$c$, and ${15< p_{\mathrm{T,ch\,jet}} <50}$ GeV/$c$ from left to right, respectively. Top, middle, and bottom rows represent jets with $R=0.2$, $0.4$, and $0.6$, respectively. They are compared to PYTHIA 8 HardQCD Monash 2013 (dash-dotted lines), PYTHIA 8 SoftQCD Mode 2 (dashed lines), and POWHEG hvq + PYTHIA 8 (open circles) predictions. The shaded bands indicate the systematic uncertainty on the distributions. Bottom panels present ratios of MC predictions to the data. | 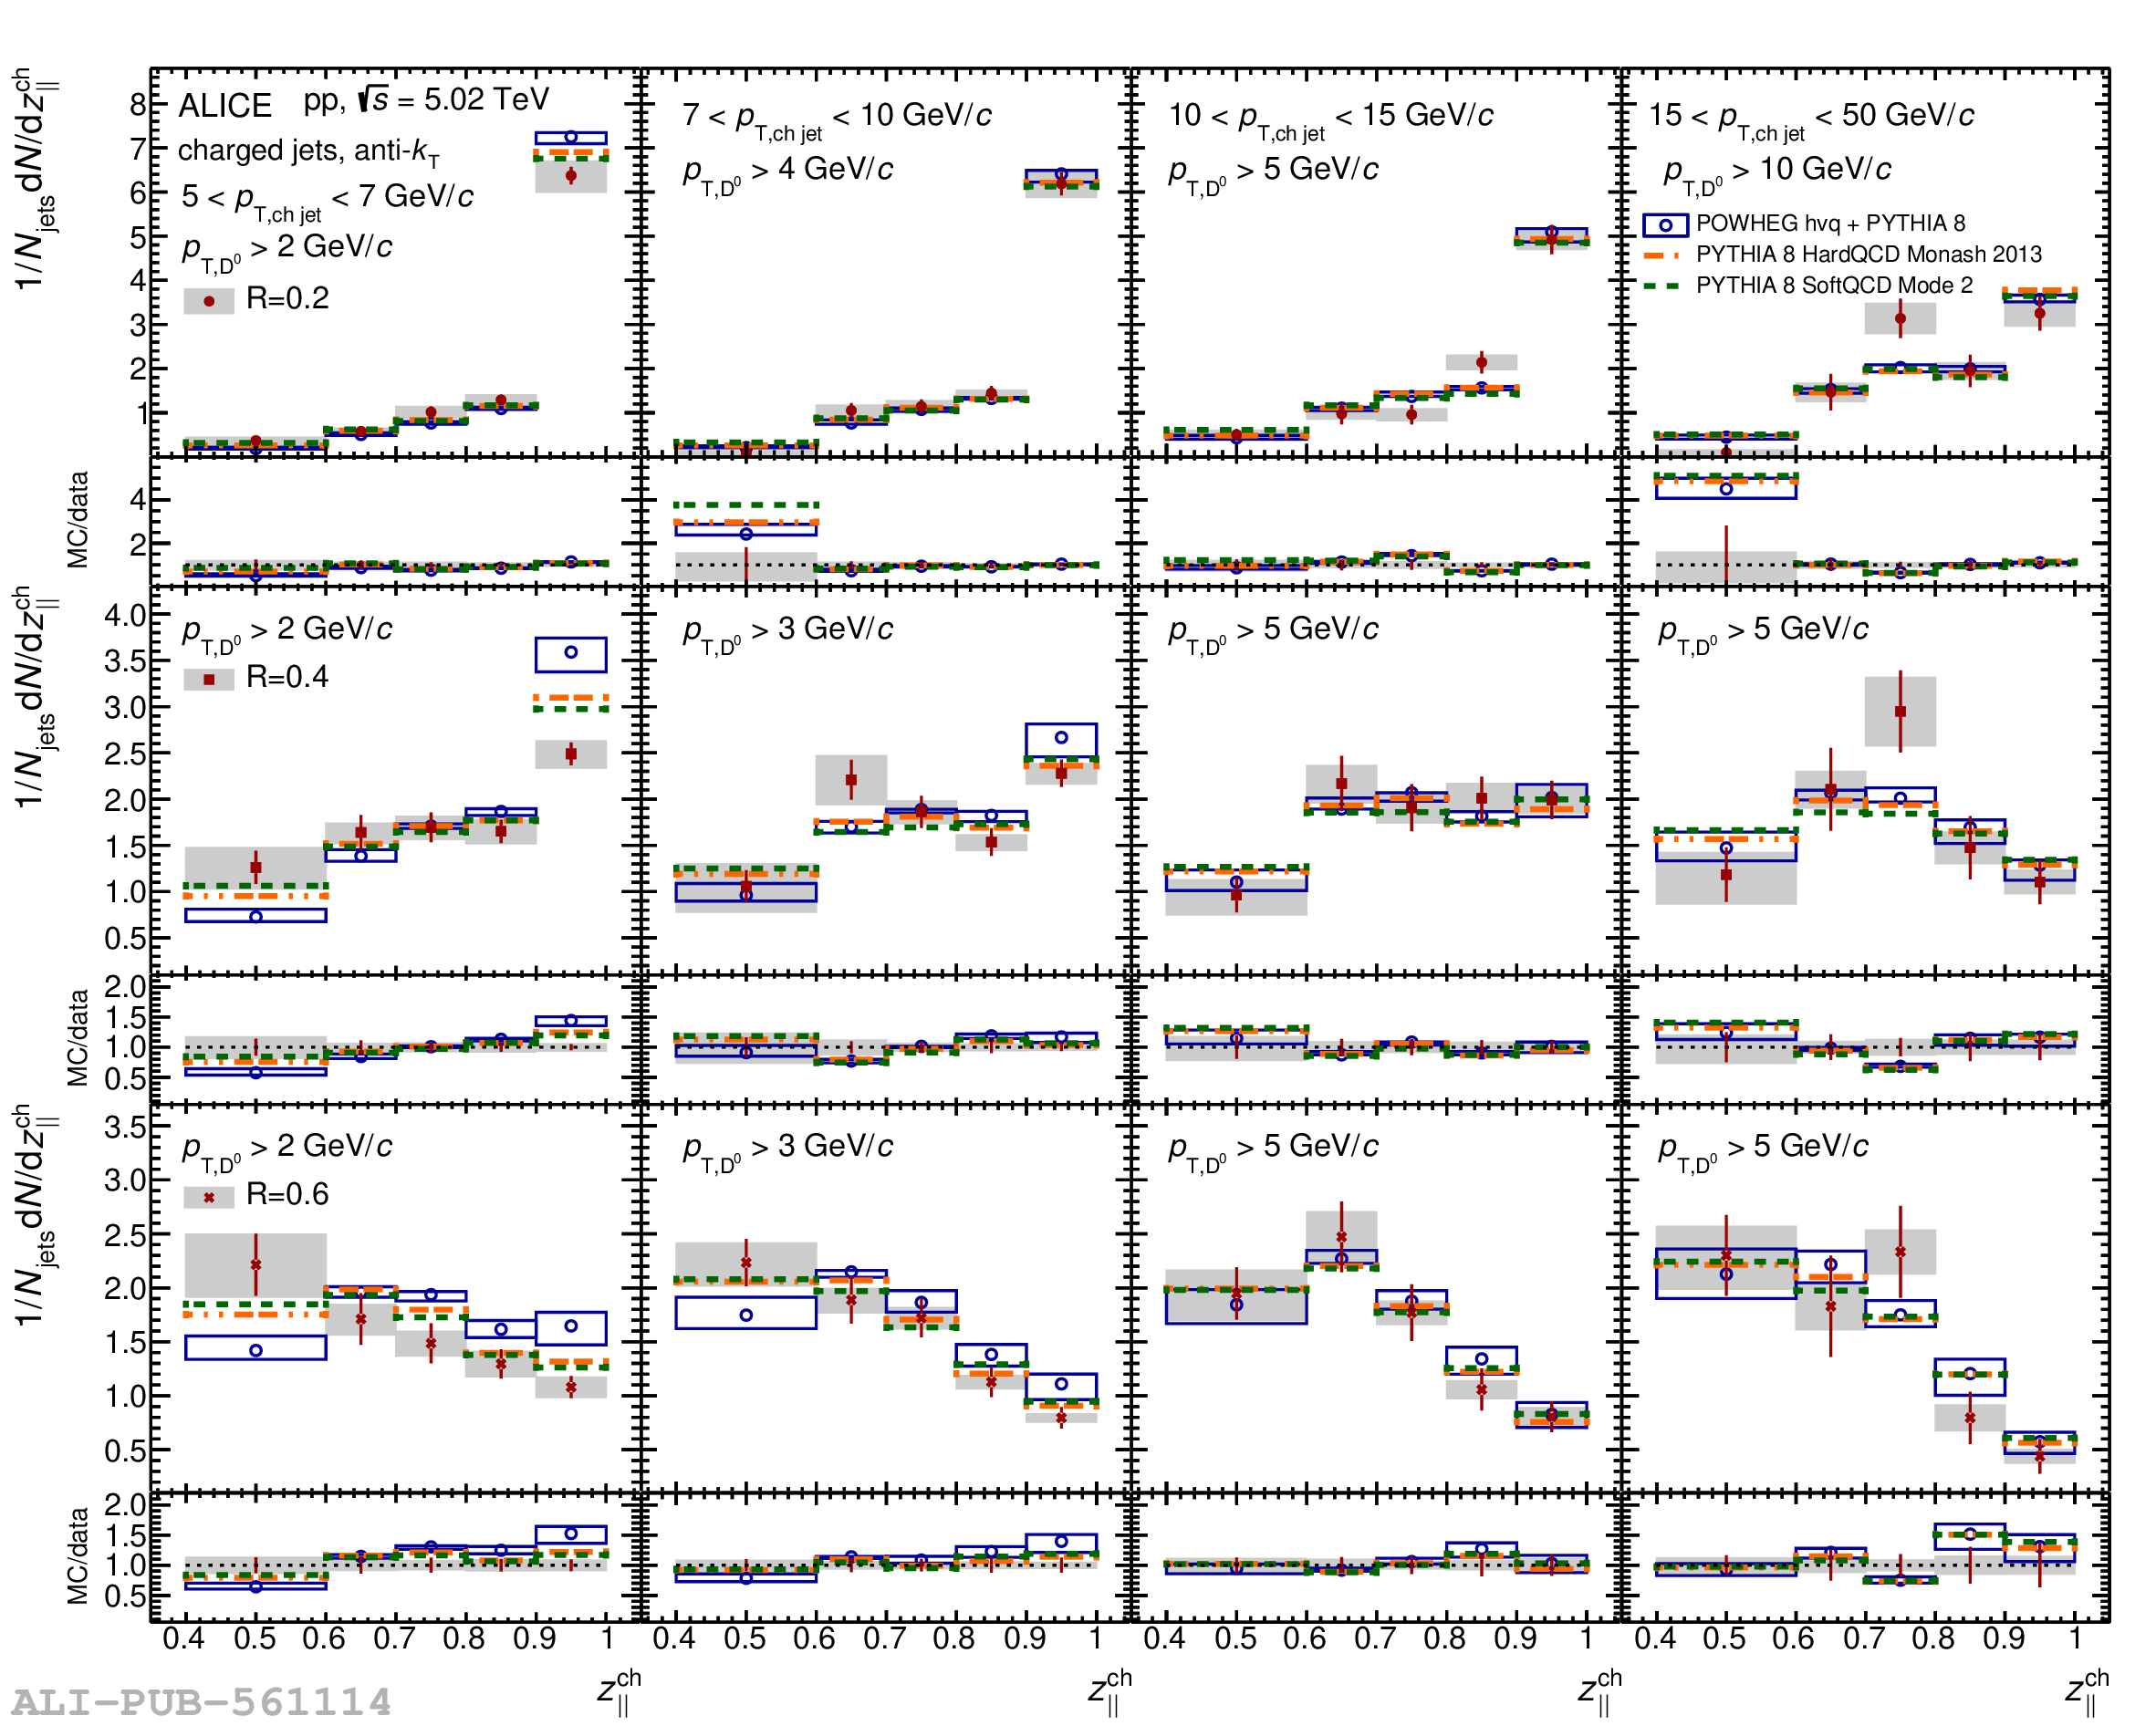 |
Figure A.1
Top panel: $p_{\mathrm{T,ch\,jet}}$-differential cross section of charm jets tagged with $\mathrm{D^{0}}$ mesons for $R=0.3$ in pp collisions at $\sqrt{s}$ = 5.02 TeV compared to PYTHIA 8 HardQCD Monash 2013 (dash-dotted lines), PYTHIA 8 Monash 2013 SoftQCD Mode 2 (dashed lines) and POWHEG hvq + PYTHIA 8 (open circles) predictions. The shaded bands indicate the systematic uncertainty on the data cross section while open boxes represent the theoretical uncertainties on the POWHEG predictions. Bottom panel presents ratios of MC predictions to the data. | 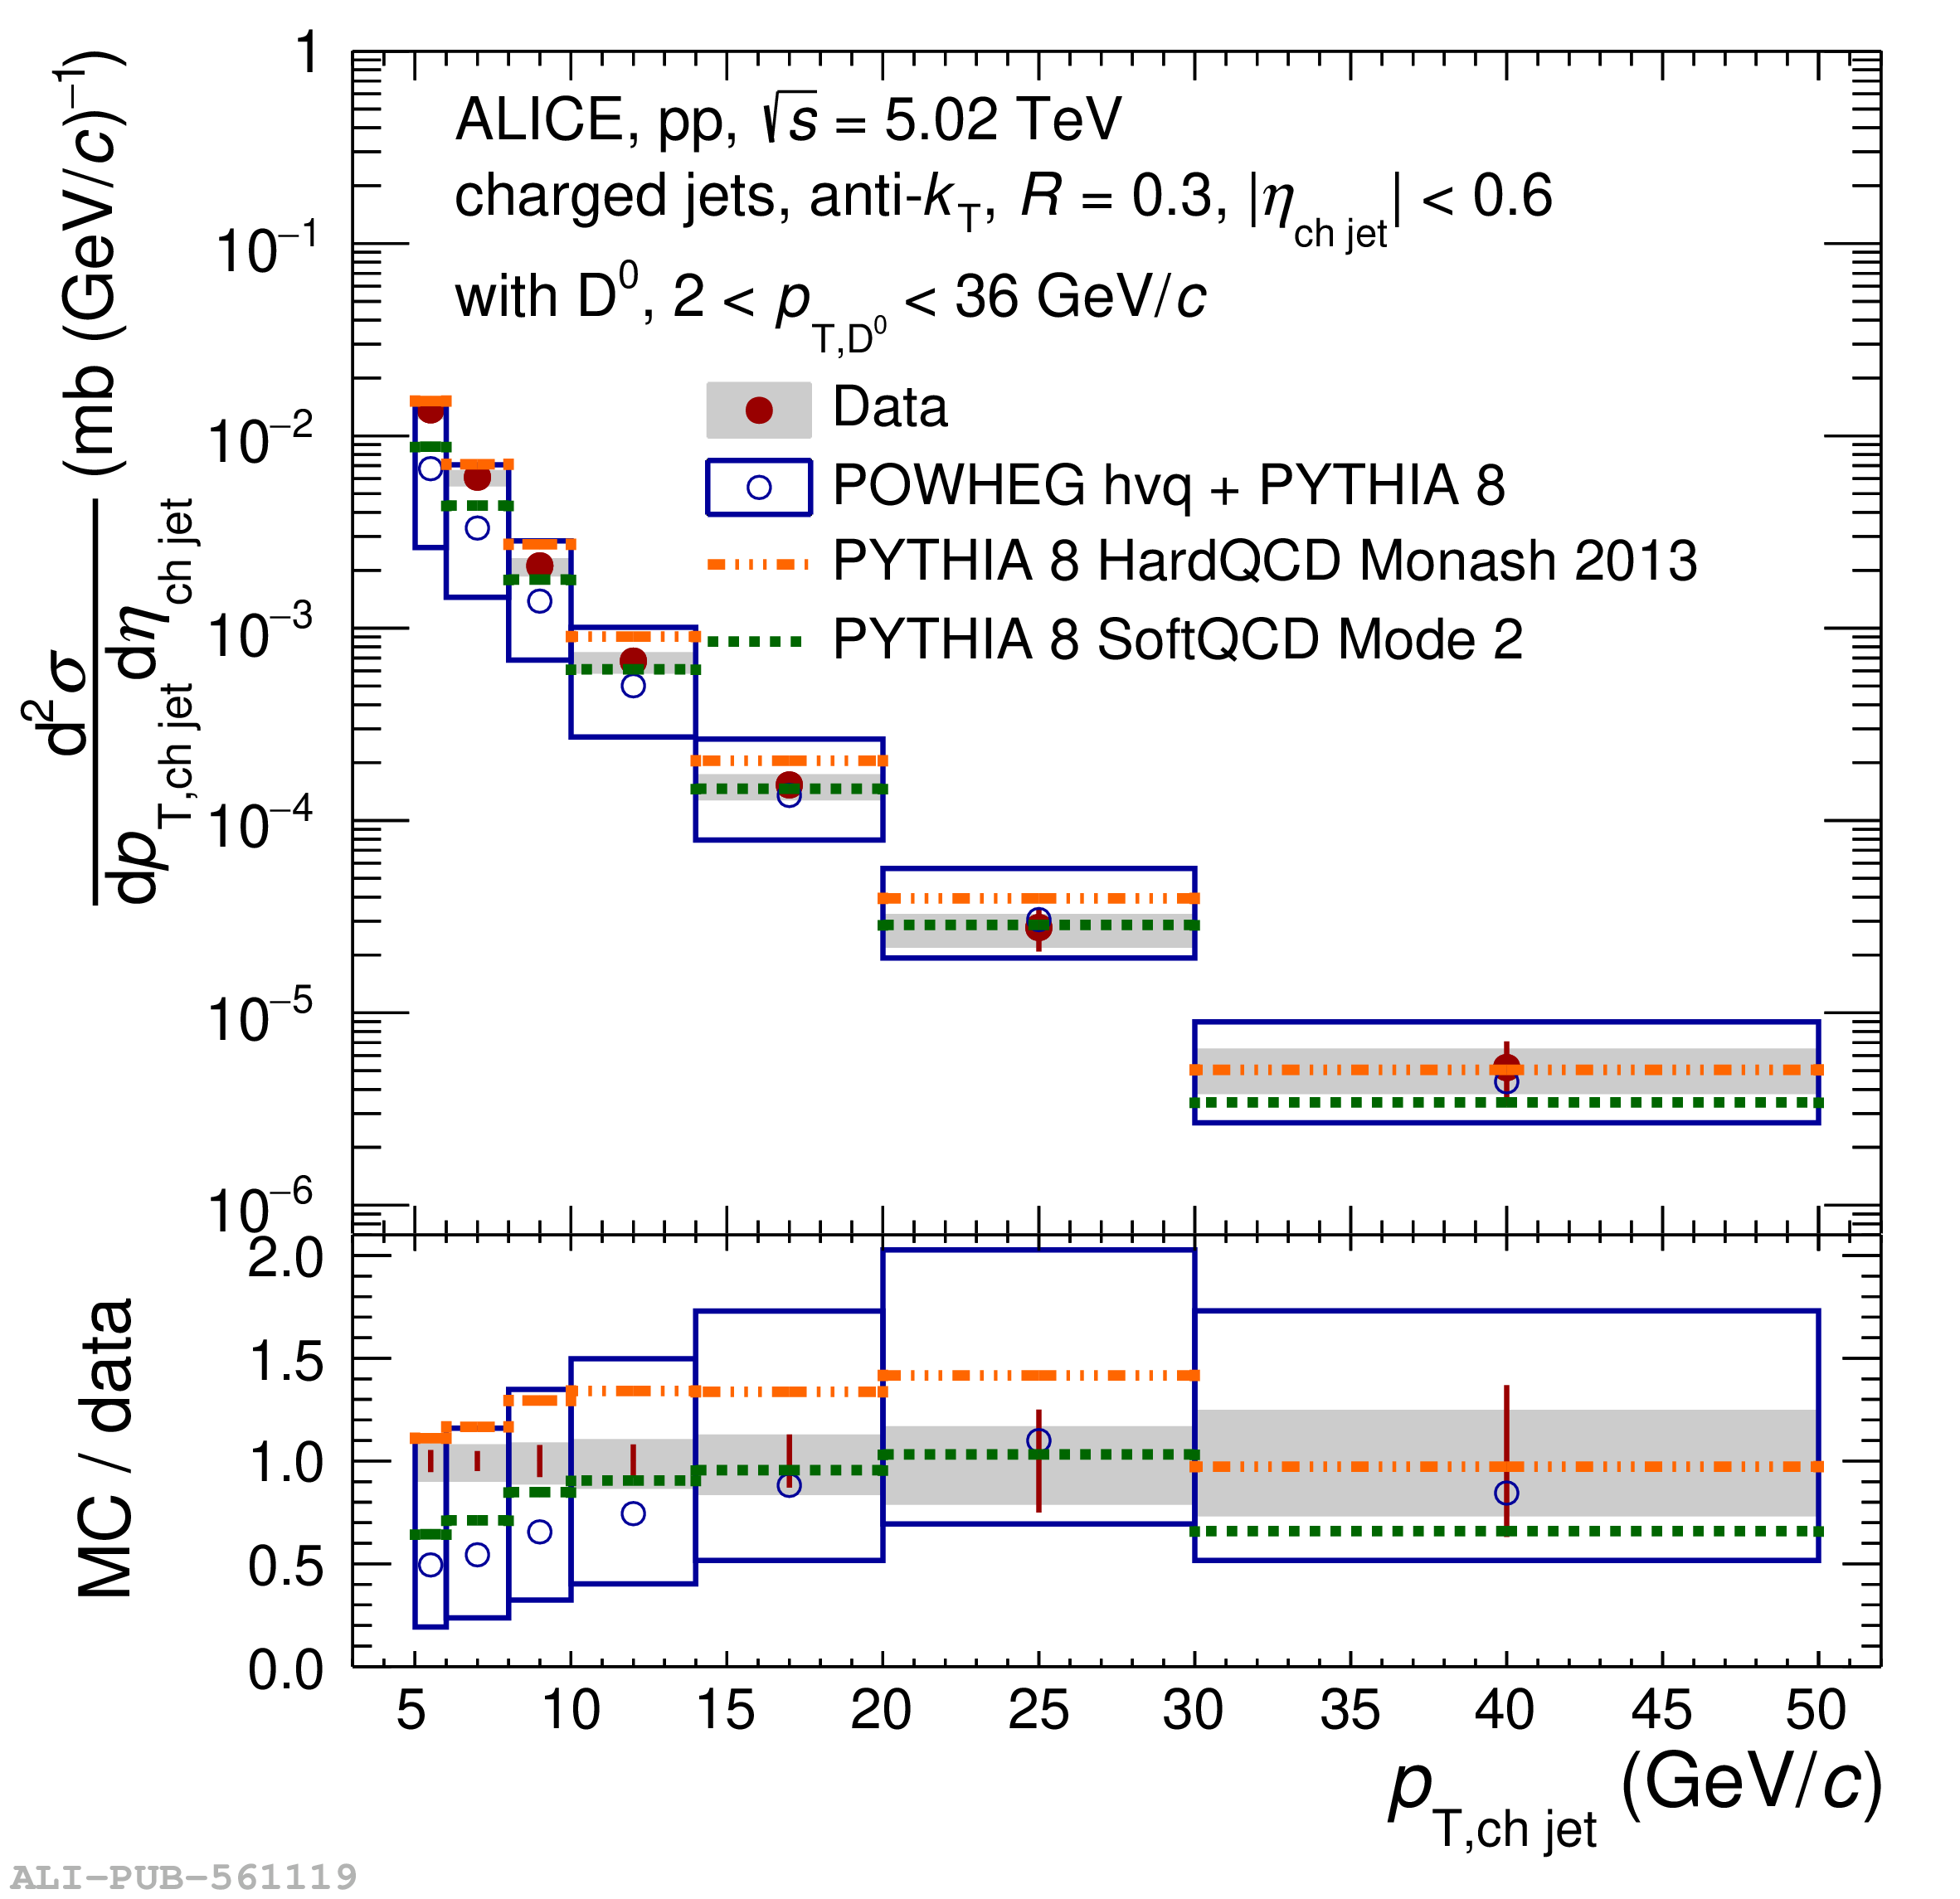 |

Figure A.3
Top panels: $z_{||}^{\textrm{ch}}$-differential yield of $R=0.3$ charm jets tagged with $\mathrm{D^{0}}$ mesons normalised by the number of $\mathrm{D^{0}}$ jets within each distribution in pp collisions at $\sqrt{s}$ = 5.02 TeV in four $p_{\mathrm{T,ch\,jet}}$ intervals (top left) ${5< p_{\mathrm{T,ch\,jet}} <7}$ GeV/$c$, (top right) $7< p_{\mathrm{T,ch\,jet}} <10$ GeV/$c$, (bottom left) ${10< p_{\mathrm{T,ch\,jet}} <15}$ GeV/$c$ and (bottom right) ${15< p_{\mathrm{T,ch\,jet}} <50}$ GeV/$c$. They are compared to PYTHIA 8 Monash 2013 (dashed-dotted lines), PYTHIA 8 Monash 2013 SoftQCD Mode 2 (dashed lines) and POWHEG hvq + PYTHIA 8 (open circles) predictions. The shaded bands indicate the systematic uncertainty on the distributions while open boxes represent the theoretical uncertainties on the POWHEG predictions. Bottom panels present ratios of MC predictions to the data. |  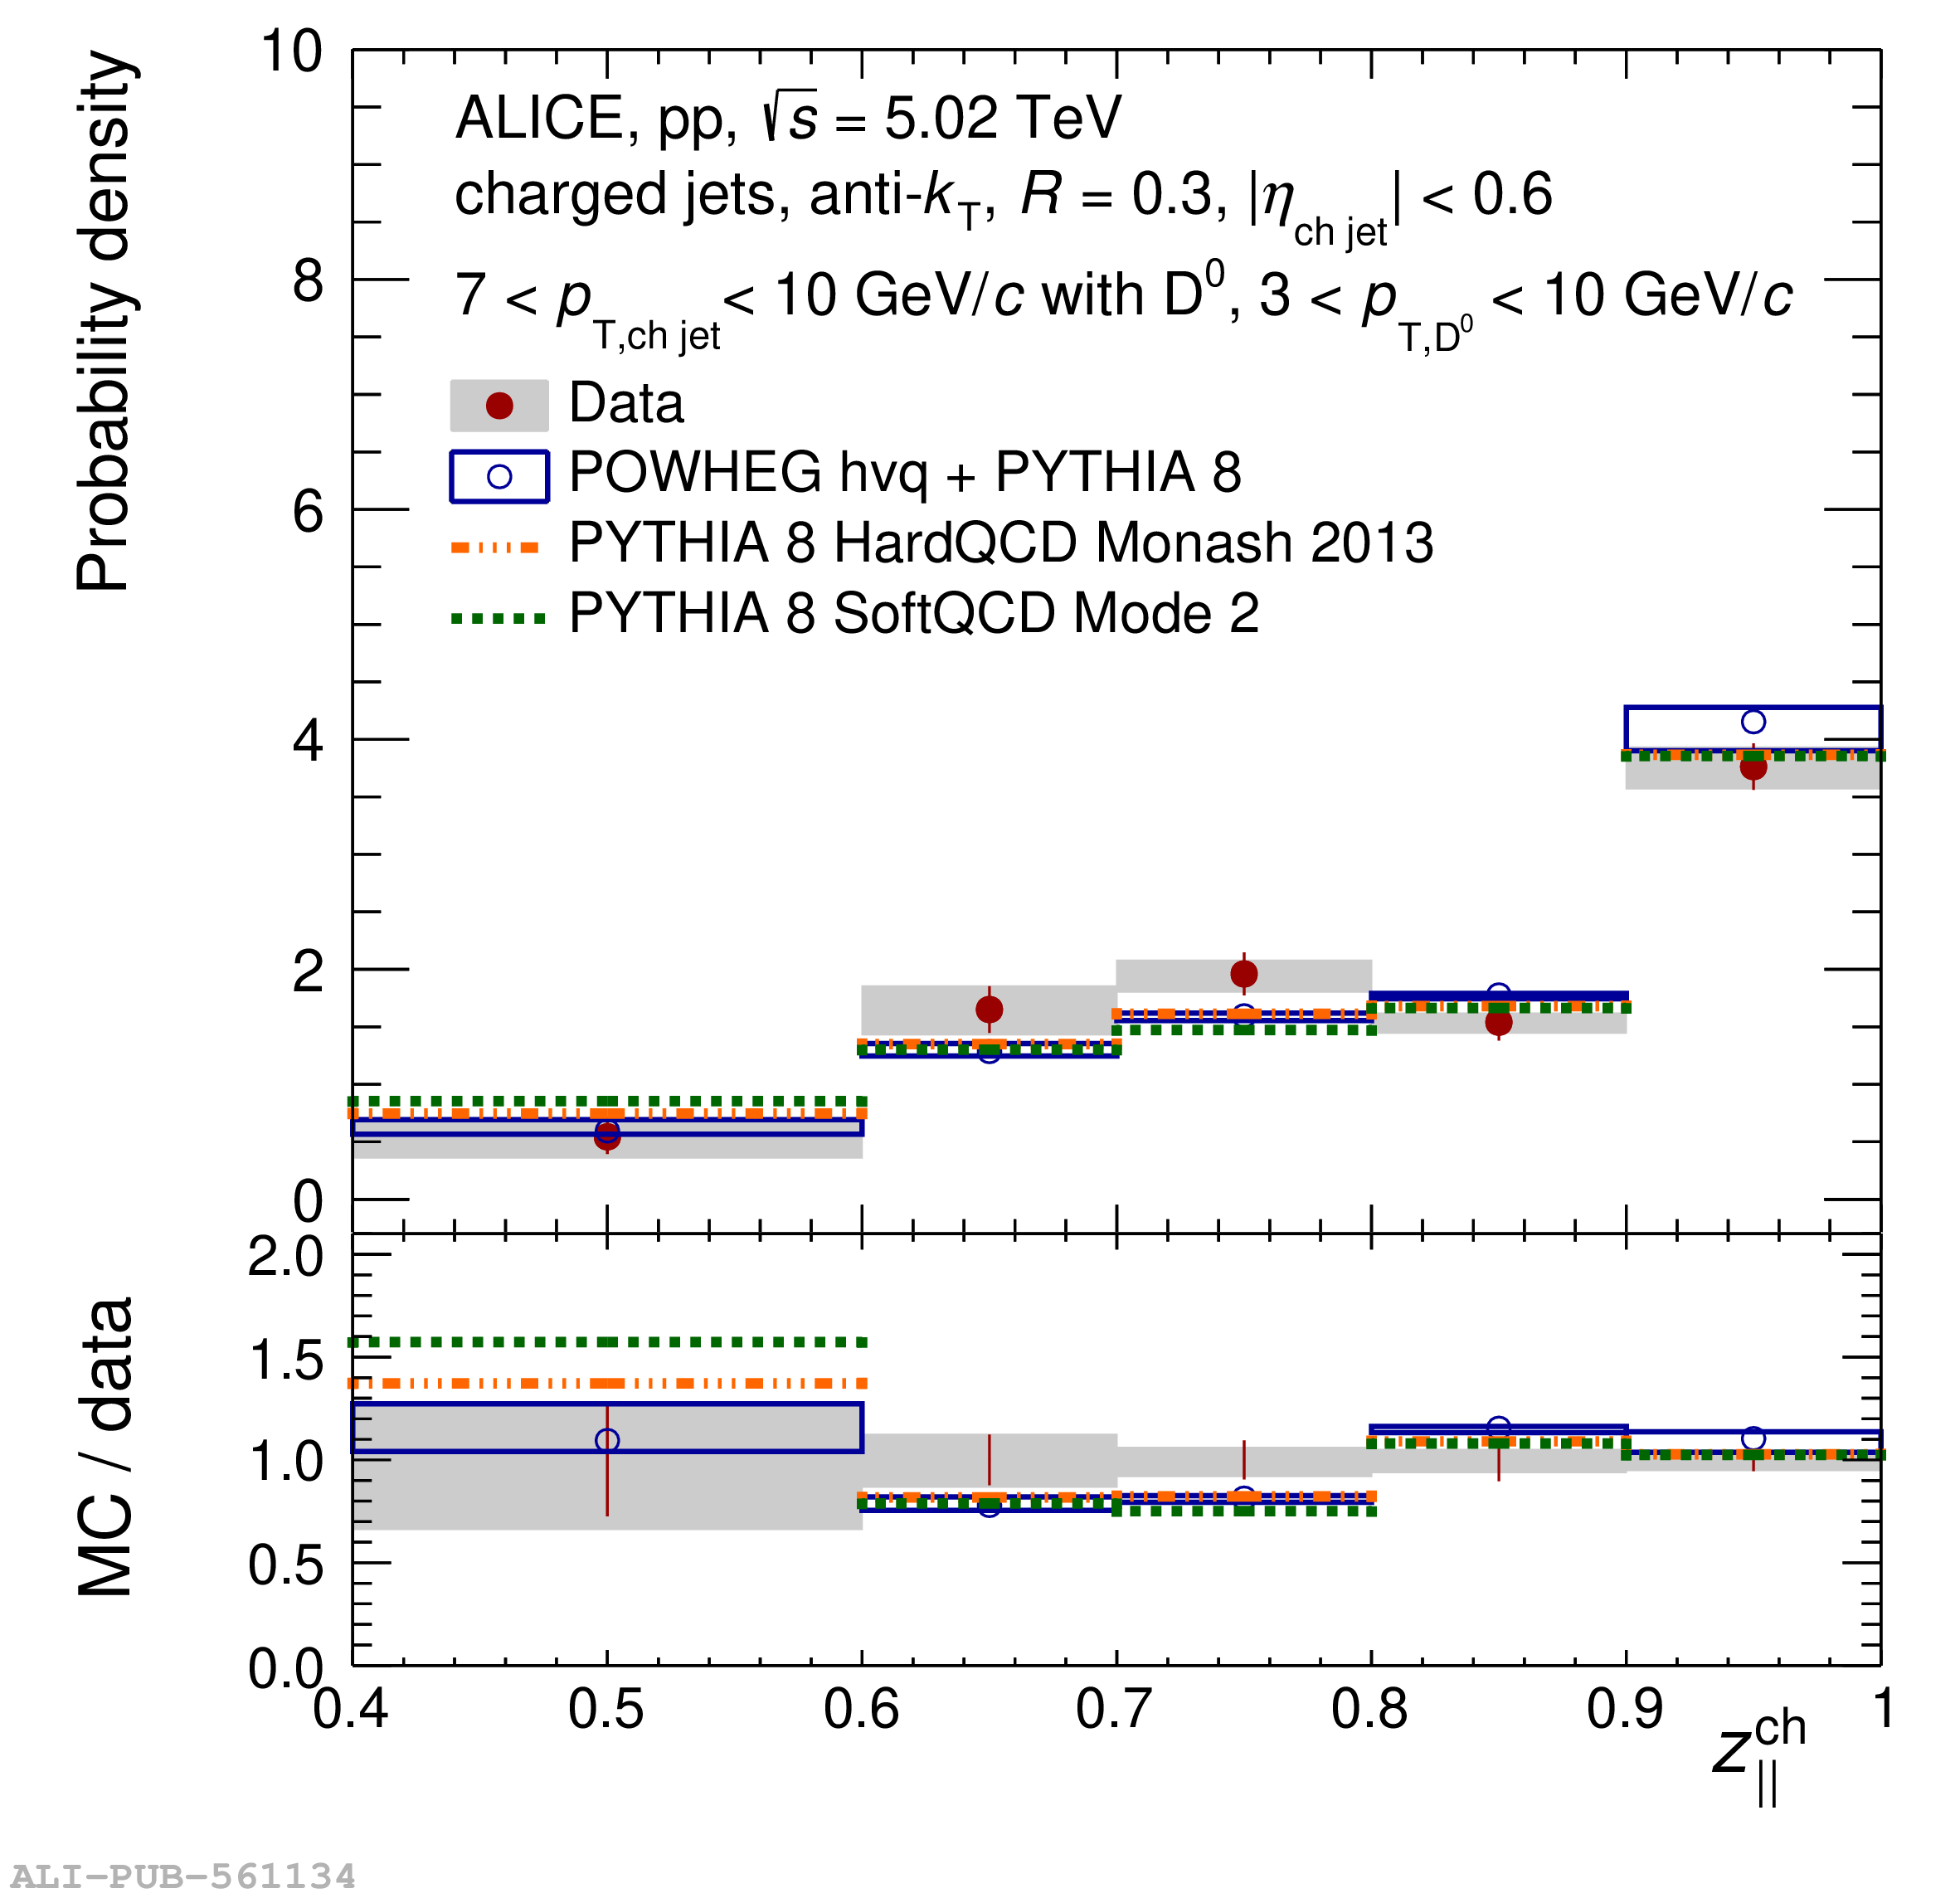 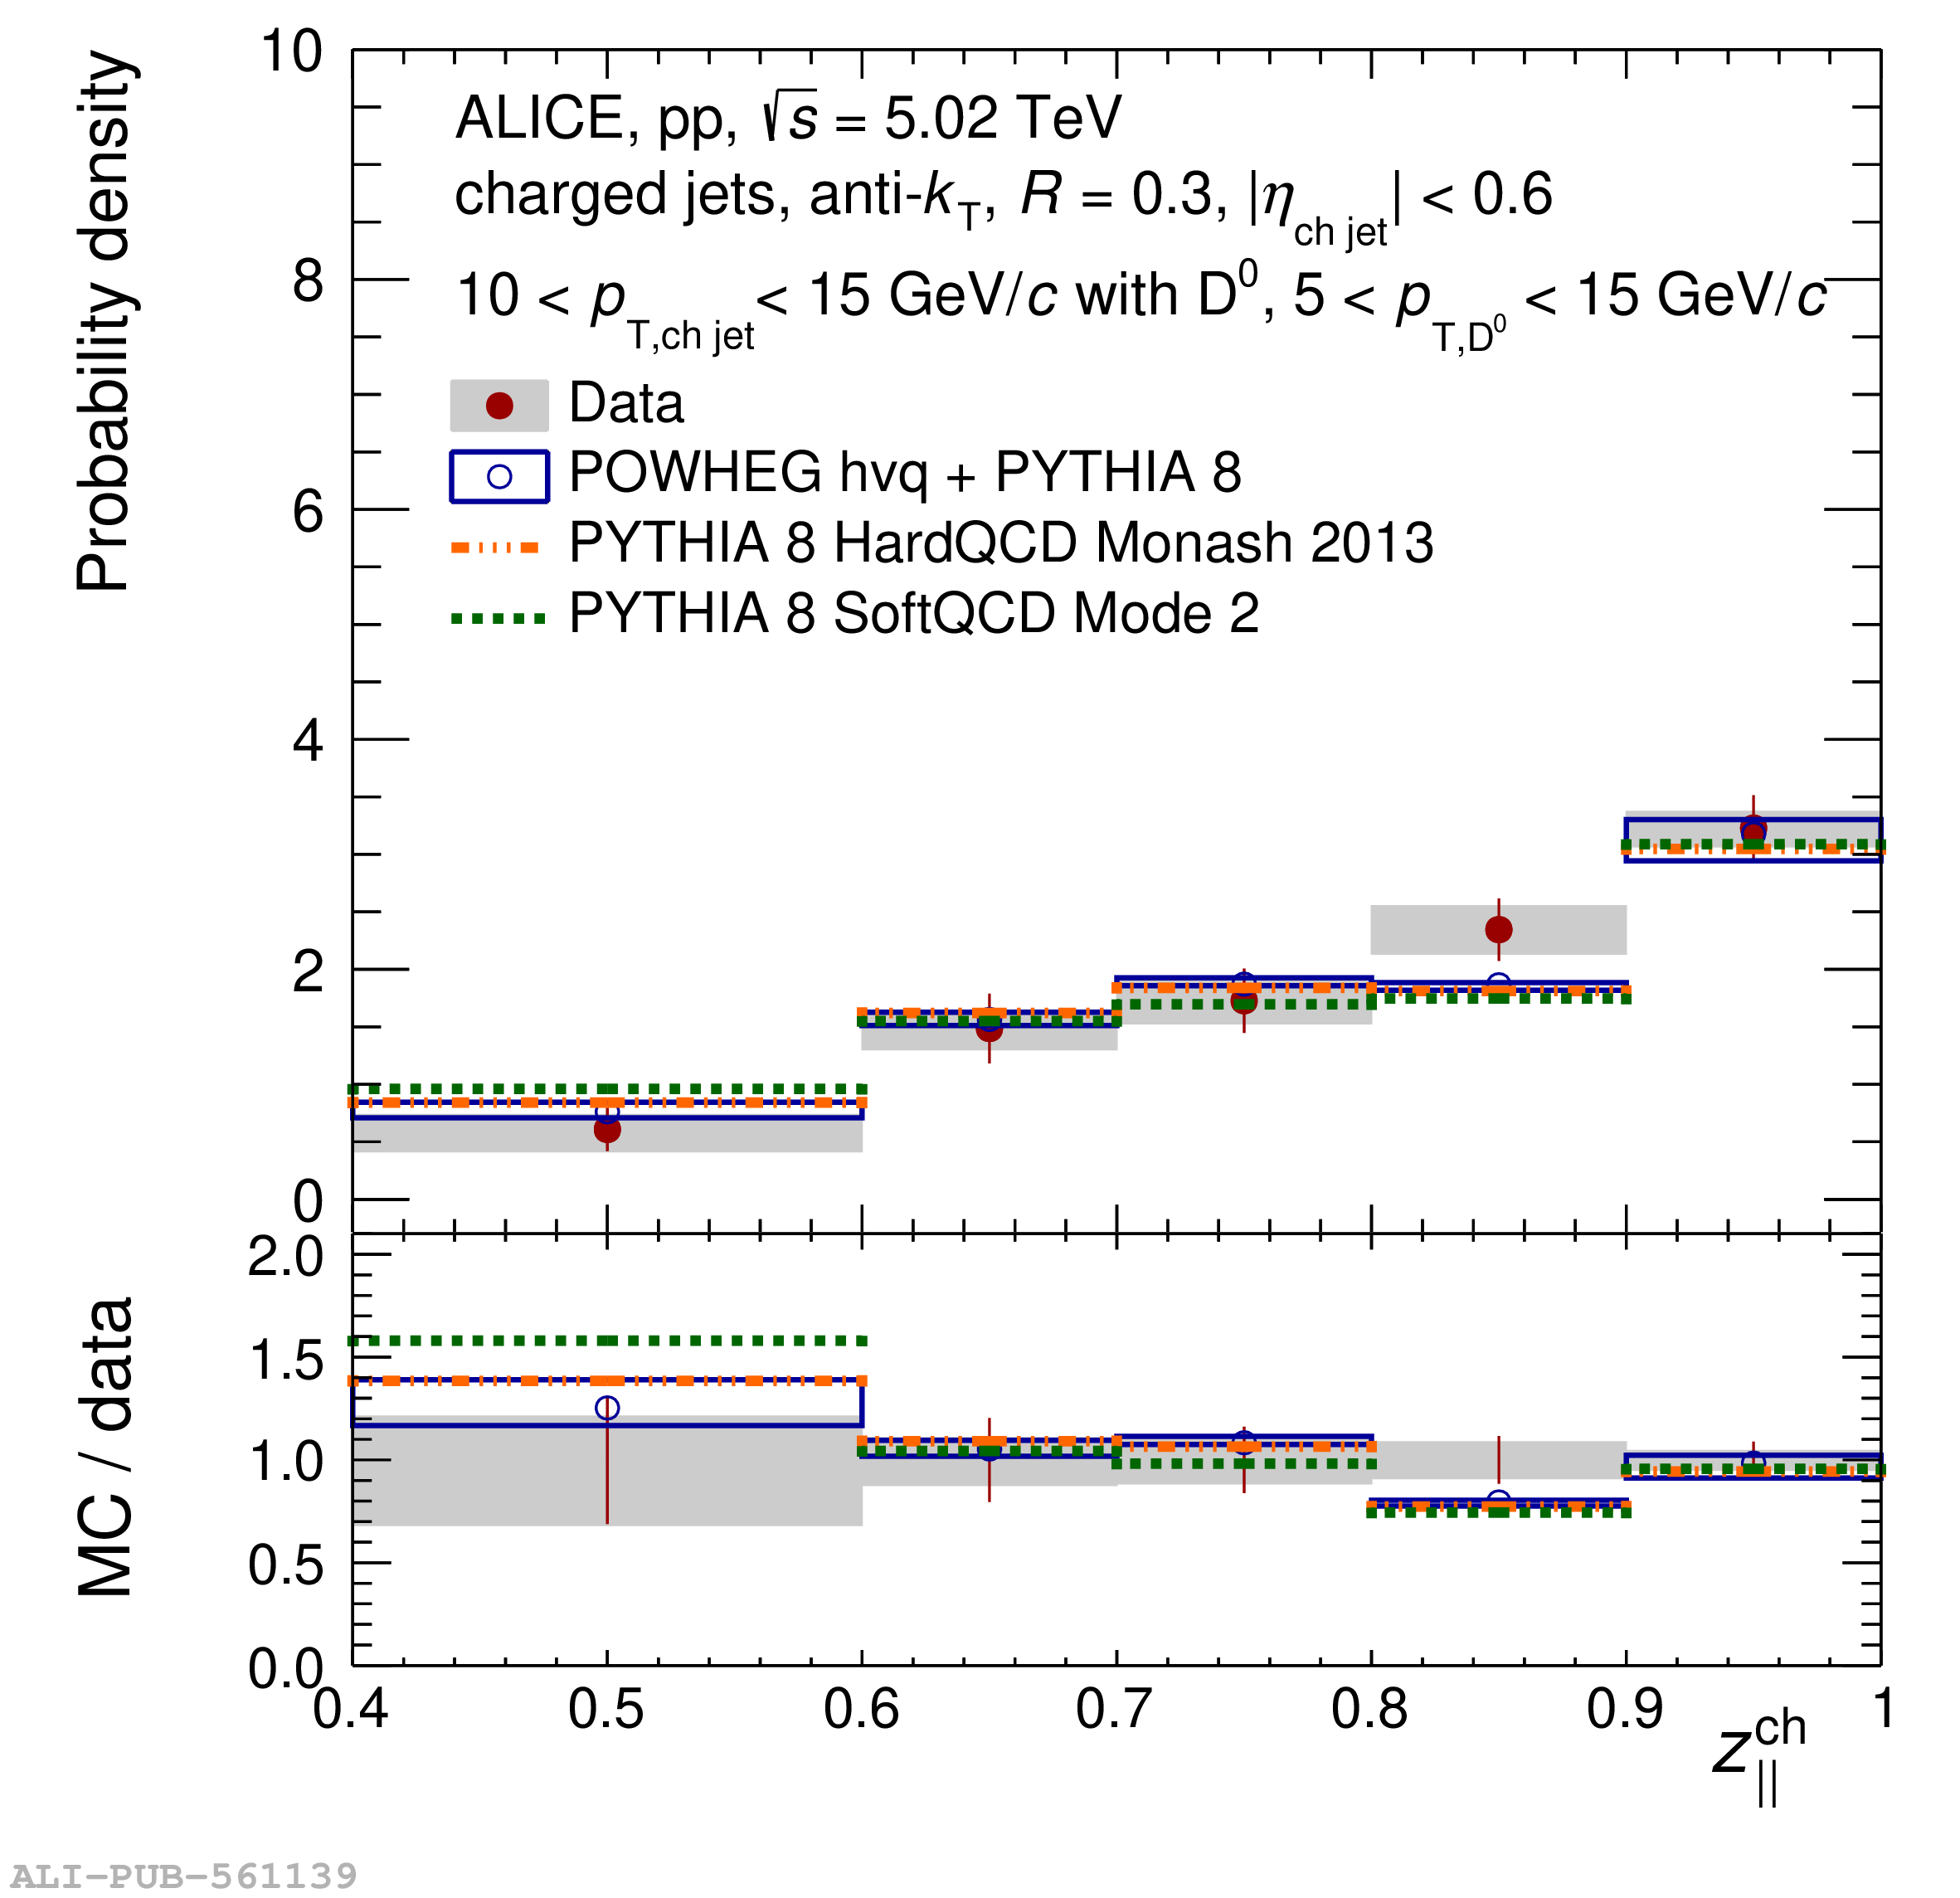 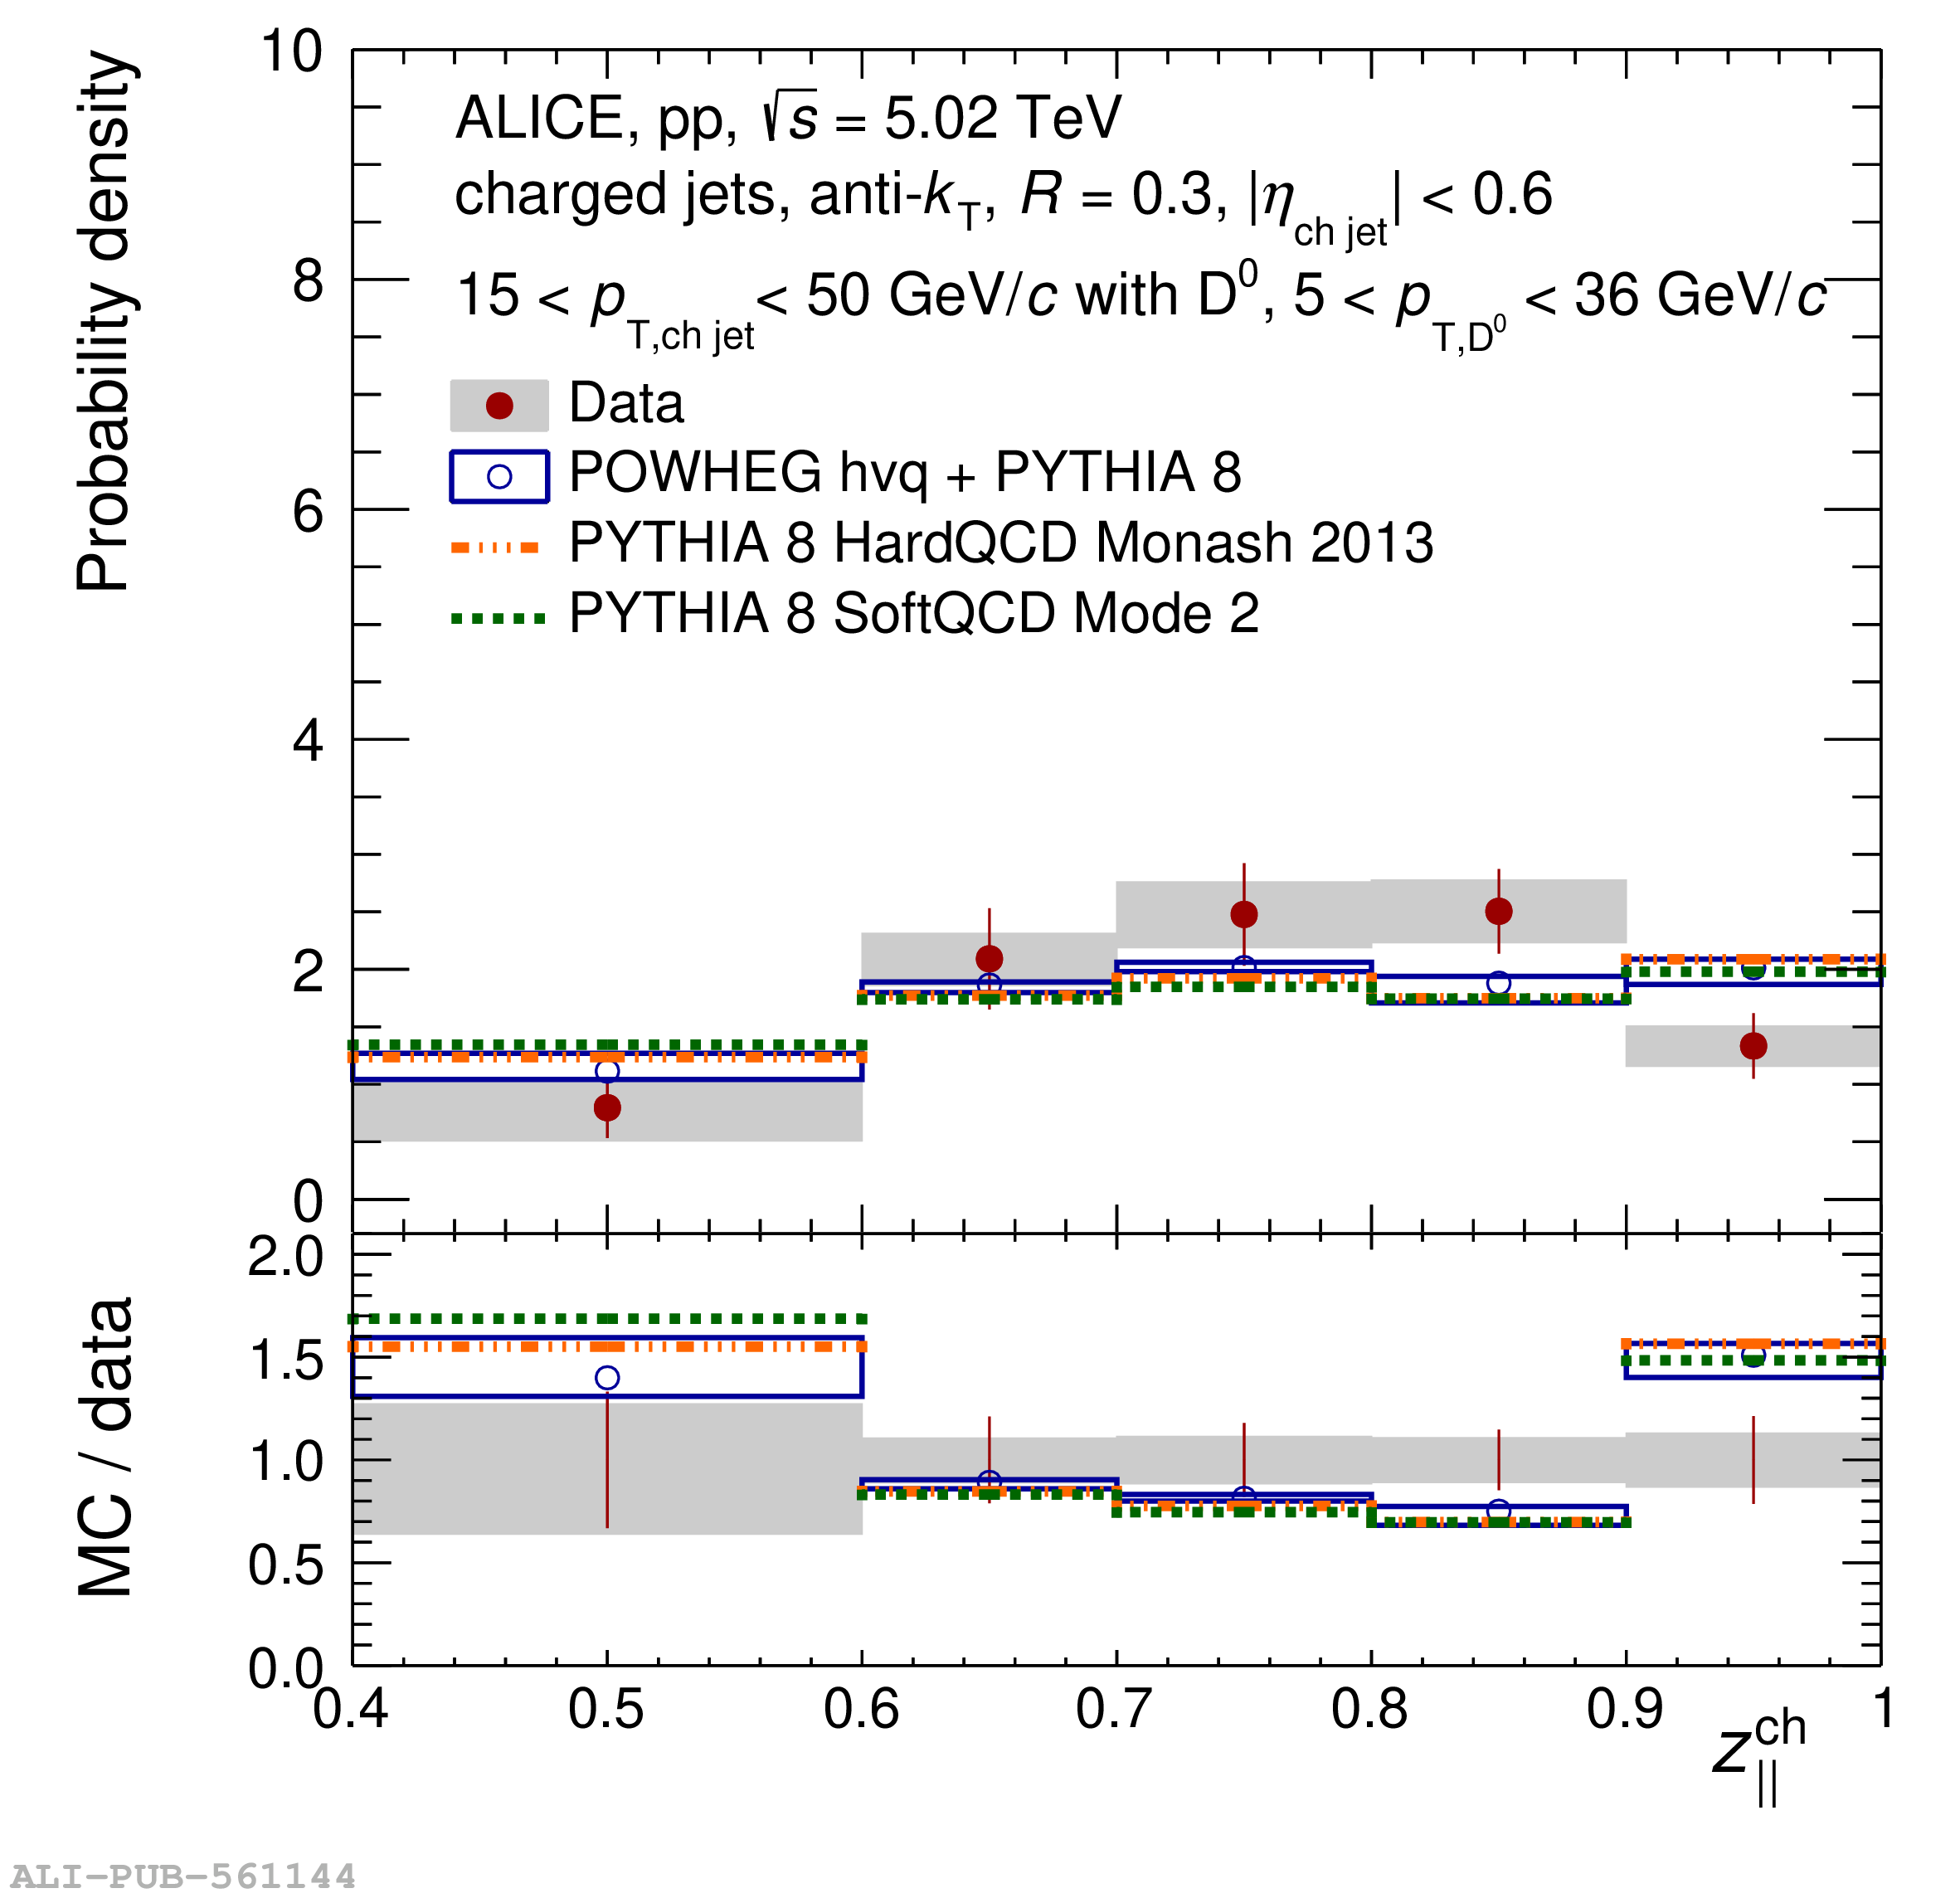 |