Luminosity determination within the ALICE experiment is based on the measurement, in van der Meer scans, of the cross sections for visible processes involving one or more detectors (visible cross sections). In 2015 and 2018, the Large Hadron Collider provided Pb$-$Pb collisions at a centre-of-mass energy per nucleon pair of $\sqrt{s_{\rm NN}} = 5.02$ TeV. Two visible cross sections, associated with particle detection in the Zero Degree Calorimeter (ZDC) and in the V0 detector, were measured in a van der Meer scan. This article describes the experimental set-up and the analysis procedure, and presents the measurement results. The analysis involves a comprehensive study of beam-related effects and an improved fitting procedure, compared to previous ALICE studies, for the extraction of the visible cross section. The resulting uncertainty of both the ZDC-based and the V0-based luminosity measurement for the full sample is 2.5%. The inelastic cross section for hadronic interactions in Pb$-$Pb collisions at $\sqrt{s_{\rm NN}} = 5.02$ TeV, obtained by efficiency correction of the V0-based visible cross section, was measured to be $7.67 \pm 0.25$ b, in agreement with predictions using the Glauber model.
JINST 19 (2024) P02039
e-Print: arXiv:2204.10148 | PDF | inSPIRE
CERN-EP-2022-072
Figure group
Figure 1
Left: correlationbetween the arrival times, relative to main--main collisions, of signals in ZNA and ZNC for events triggered by V0M. The square box depicts the satellite-collision rejection cut discussed in the text. Events outside the box are from main--satellite collisions (horizontal and vertical bands) and from satellite--satellite collisions (diagonal band) Right: distribution of the arrival time, relative to main-main collisions, in one of the two neutron calorimeters for ZED-triggered single-side neutron events. The superimposed curve shows a fit with a sum of Gaussian distributions. Both figures are for head-on collisions ($\Delta x=\Delta y=0$). | 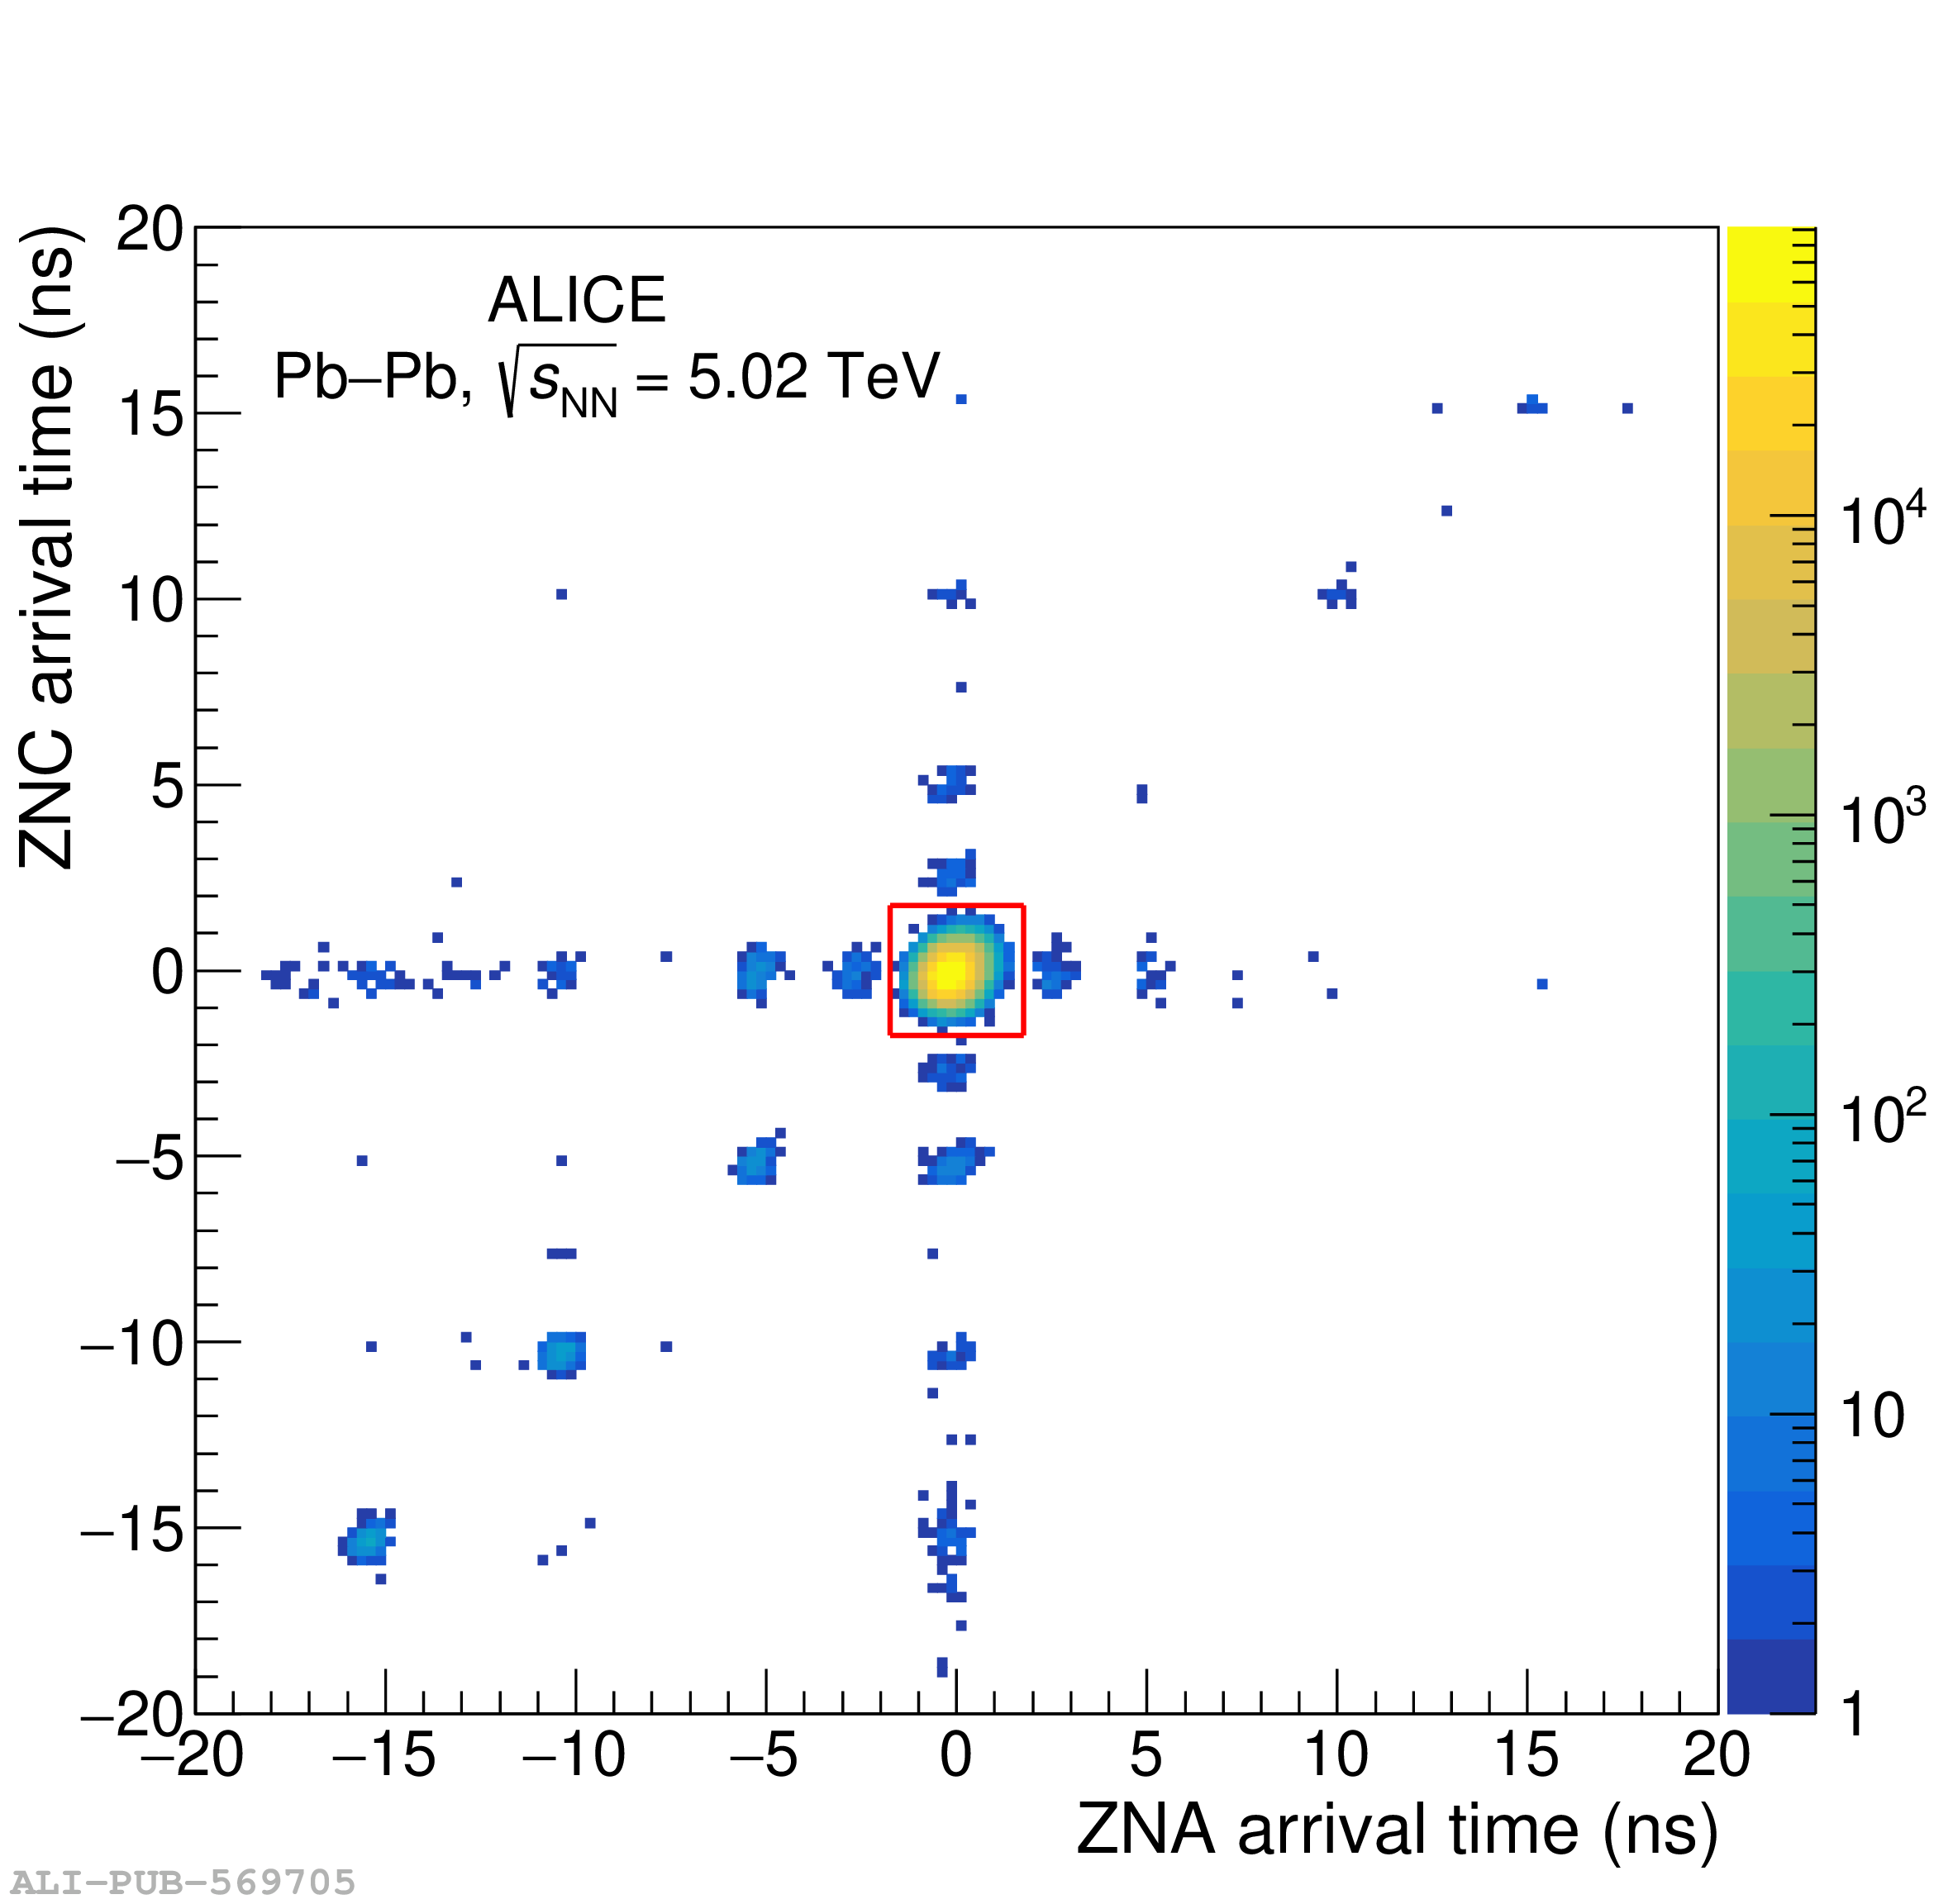 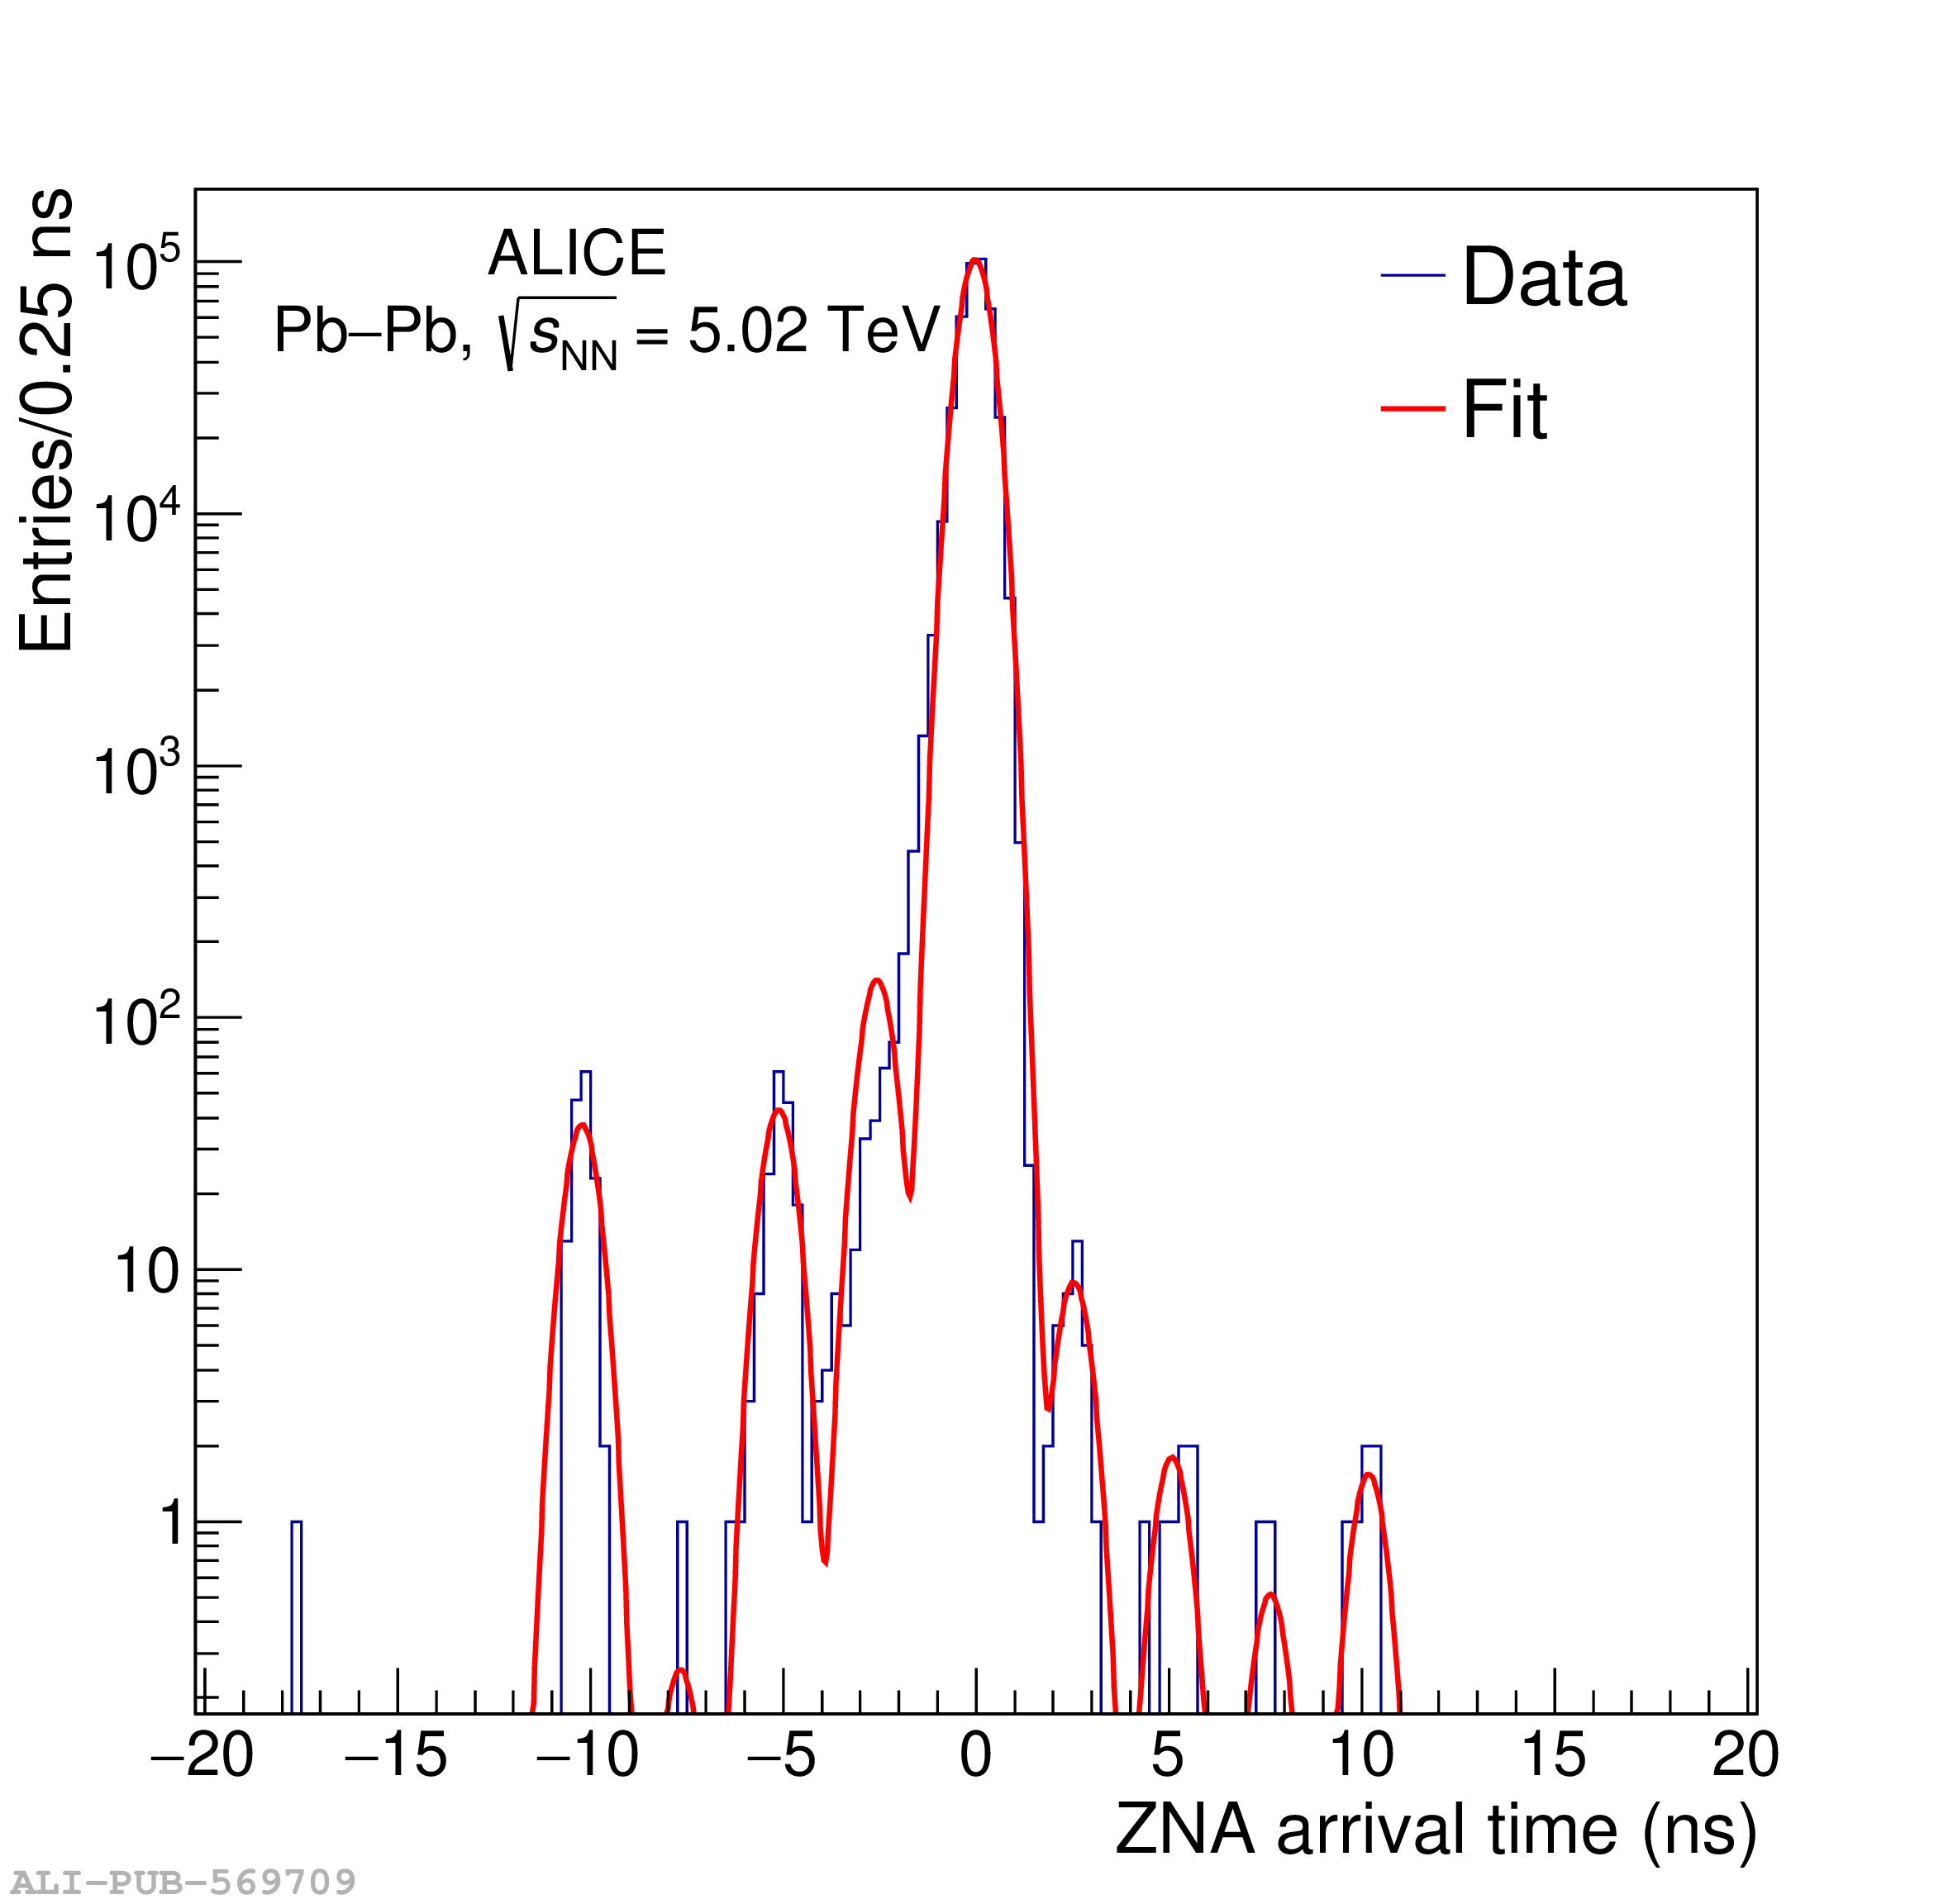 |
Figure 2
ZED (top) and V0M (bottom) trigger probabilities per bunch crossing for a typical colliding bunch pair,as a function of time, during the first horizontal and vertical vdM scan. Each time bin corresponds to an acquisition window of $\sim 2$ s. The uncertainties are statistical only. The fit expectation values are also shown, as lines, in each time bin. Time bins during which the beams are being displaced, not considered in the analysis, are not shown. | 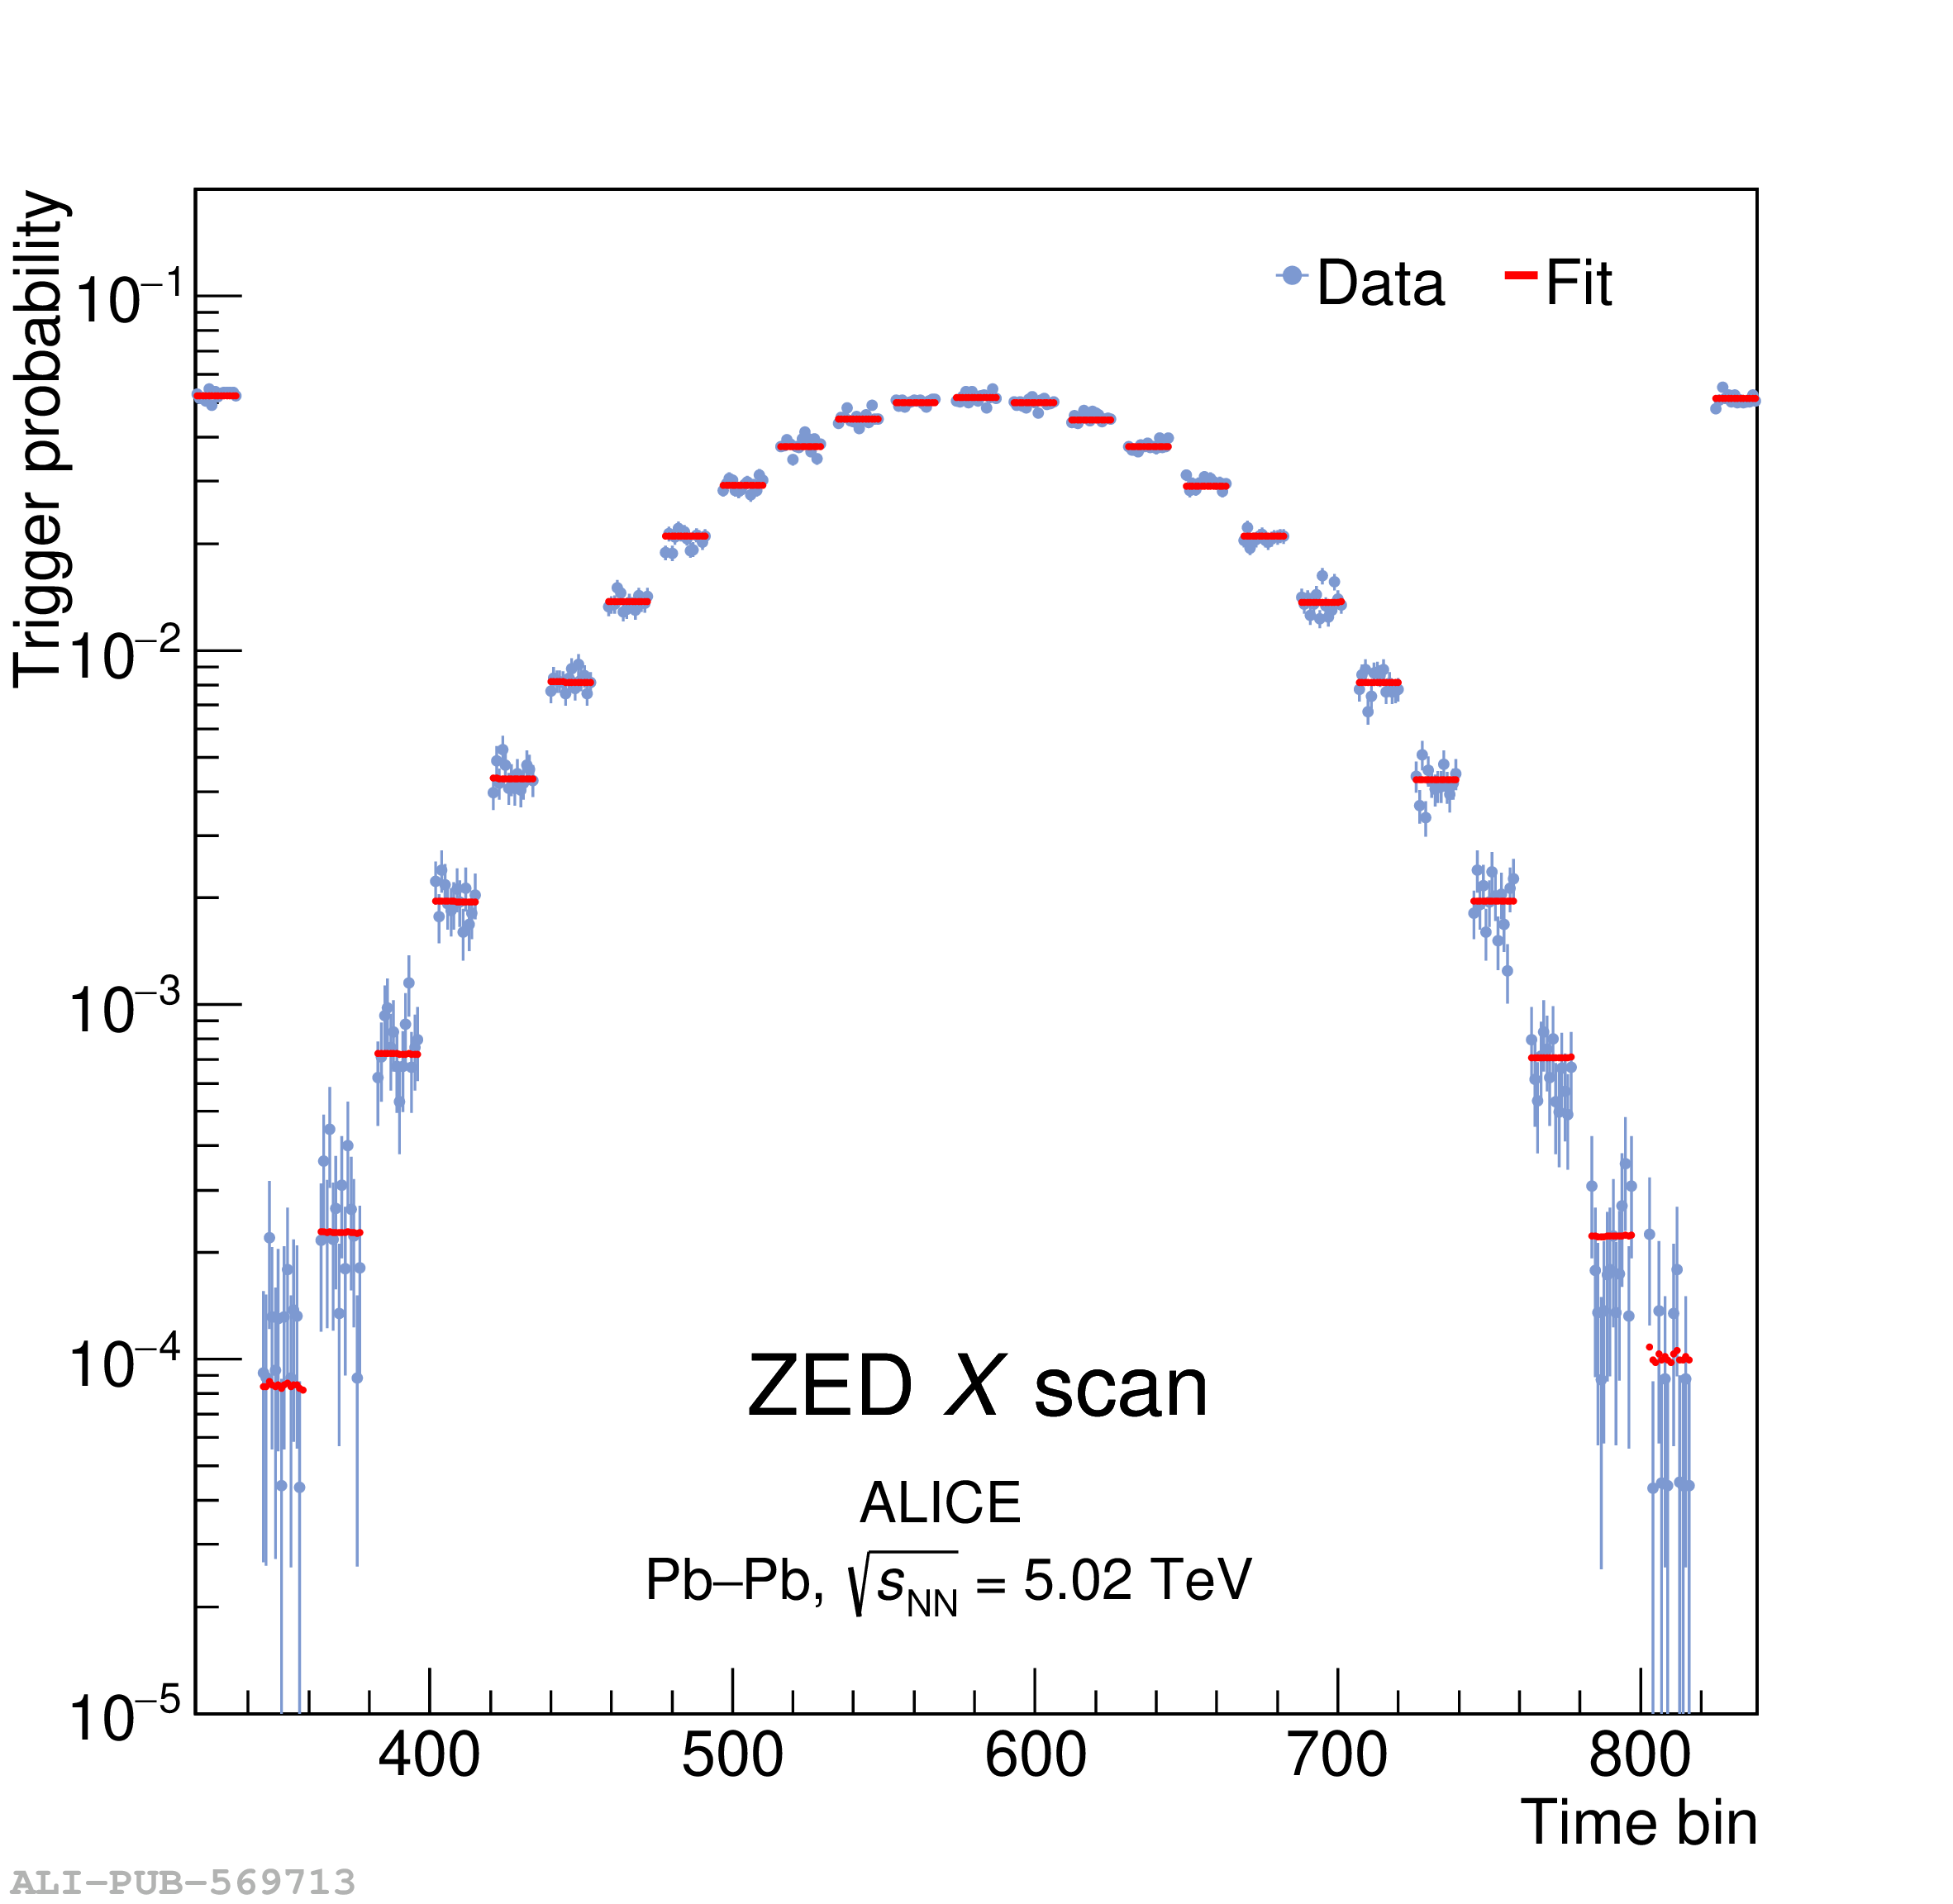 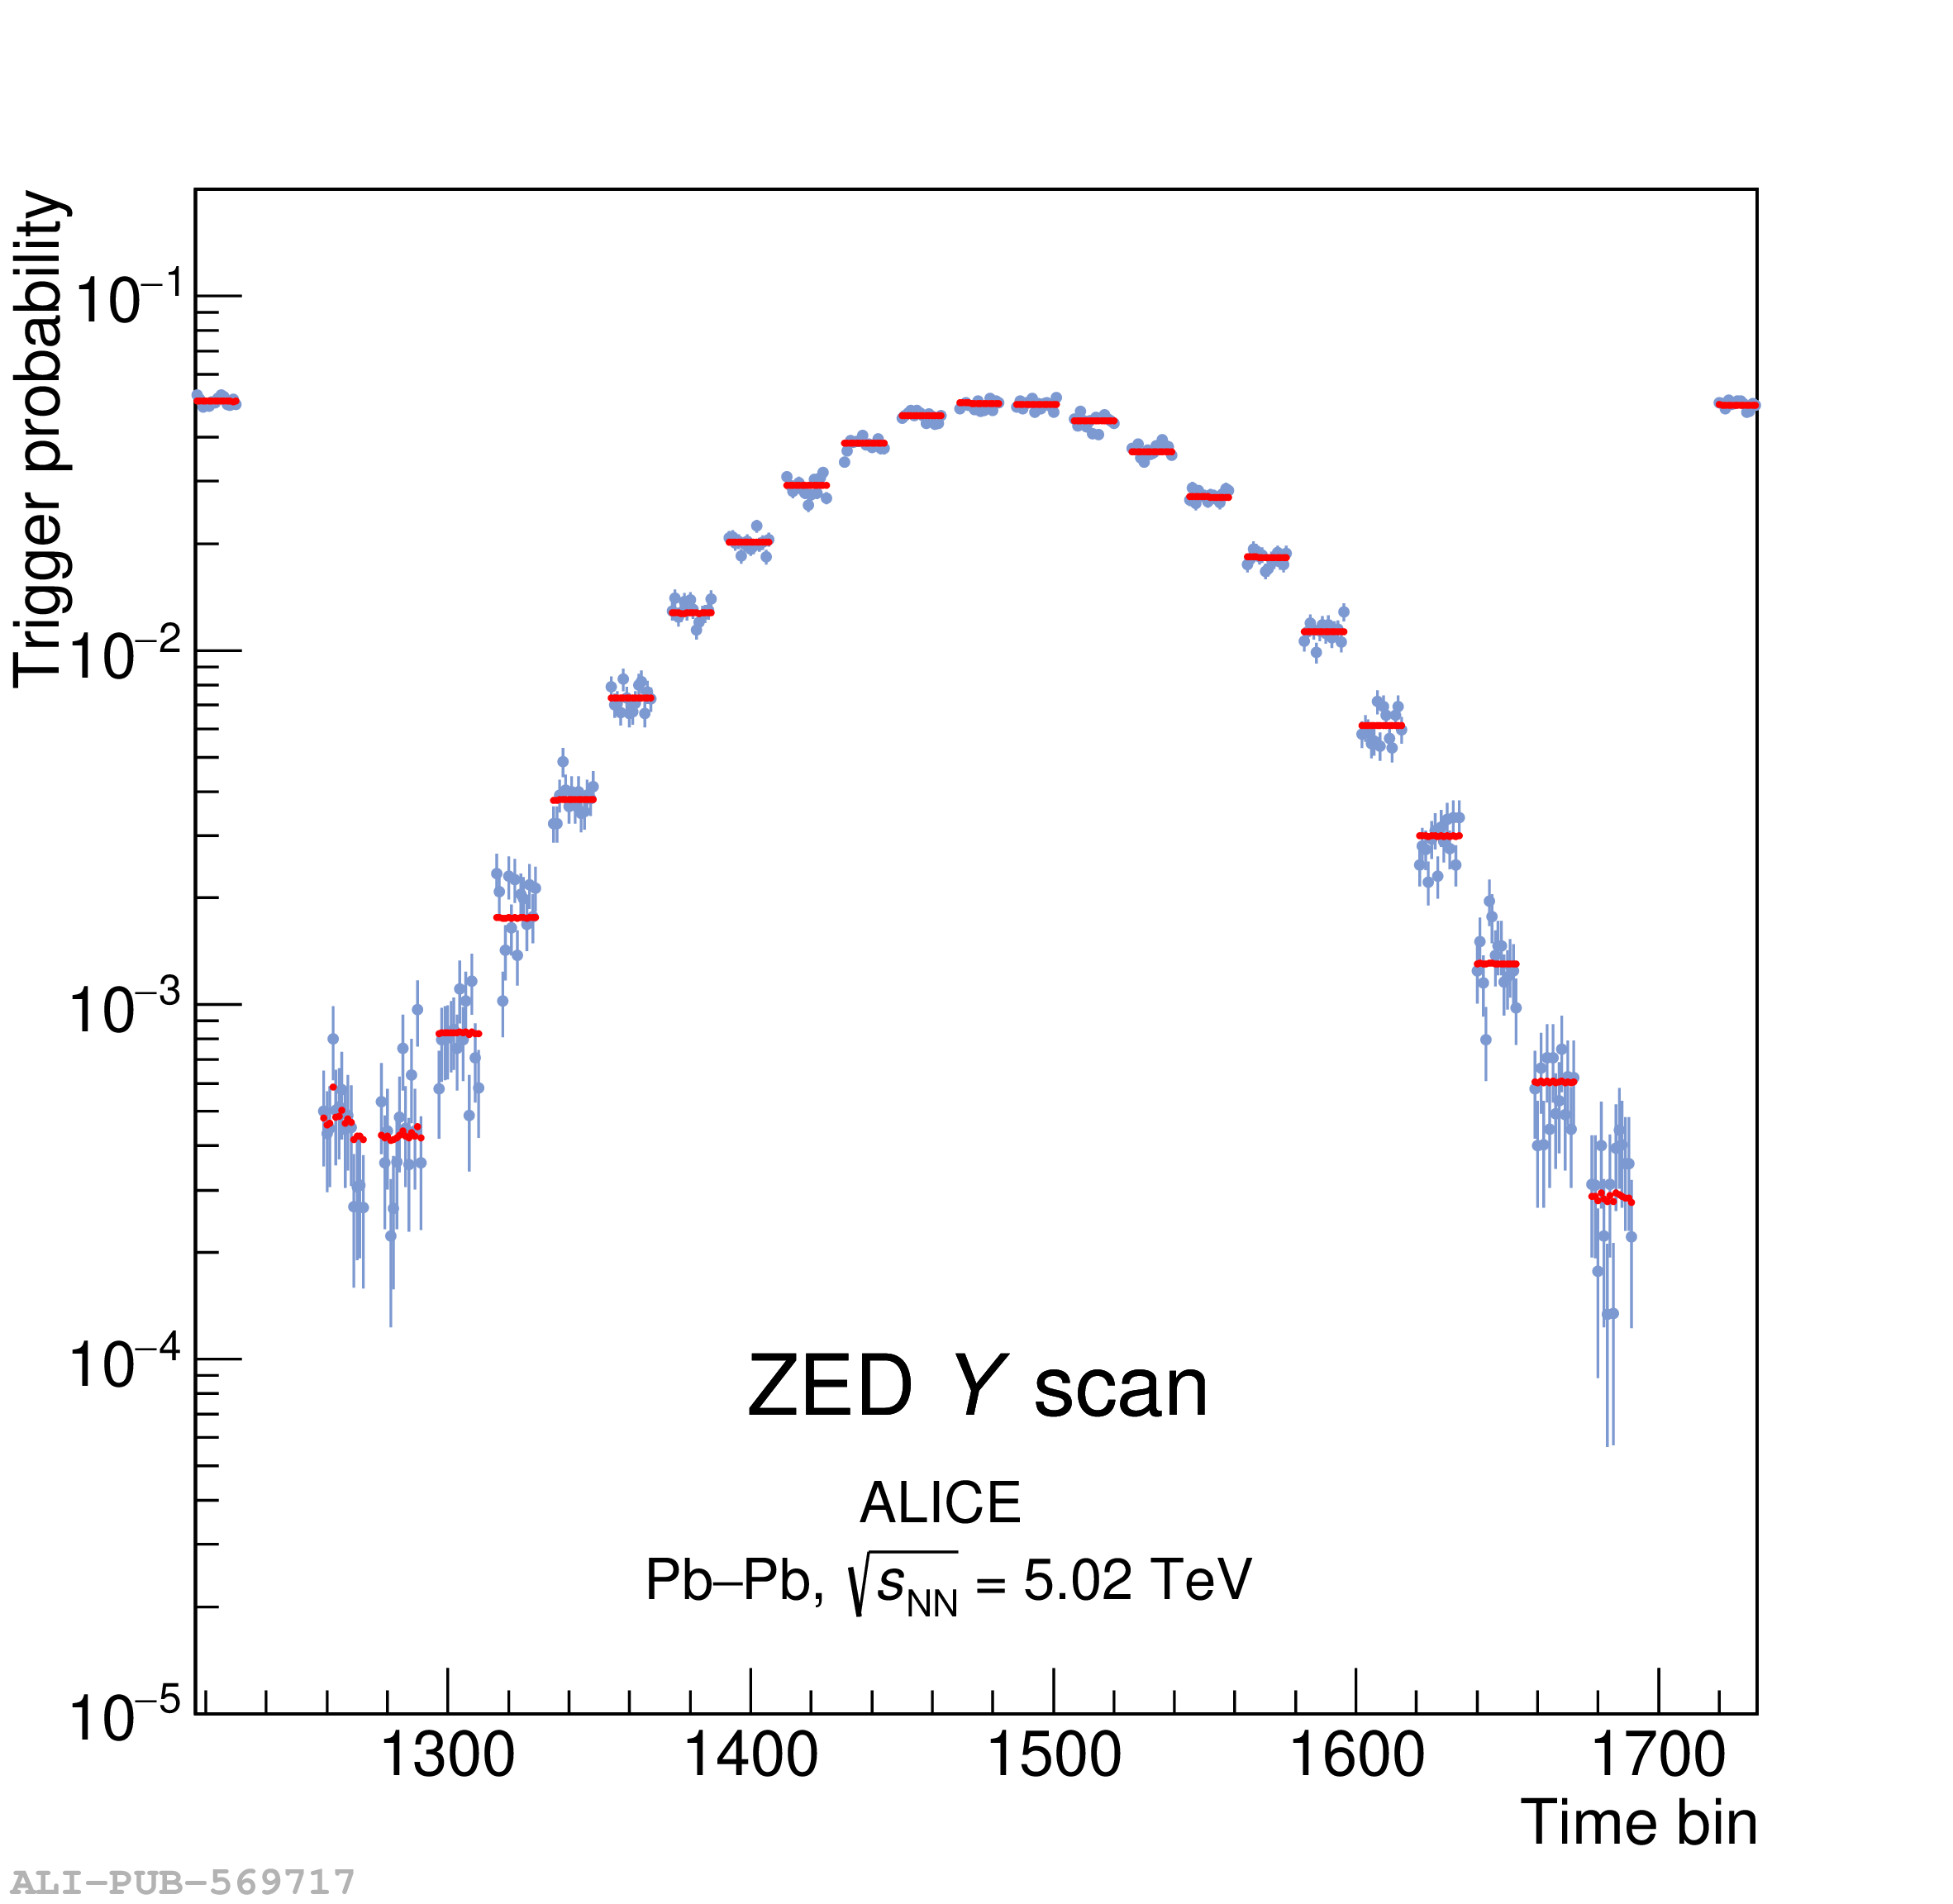 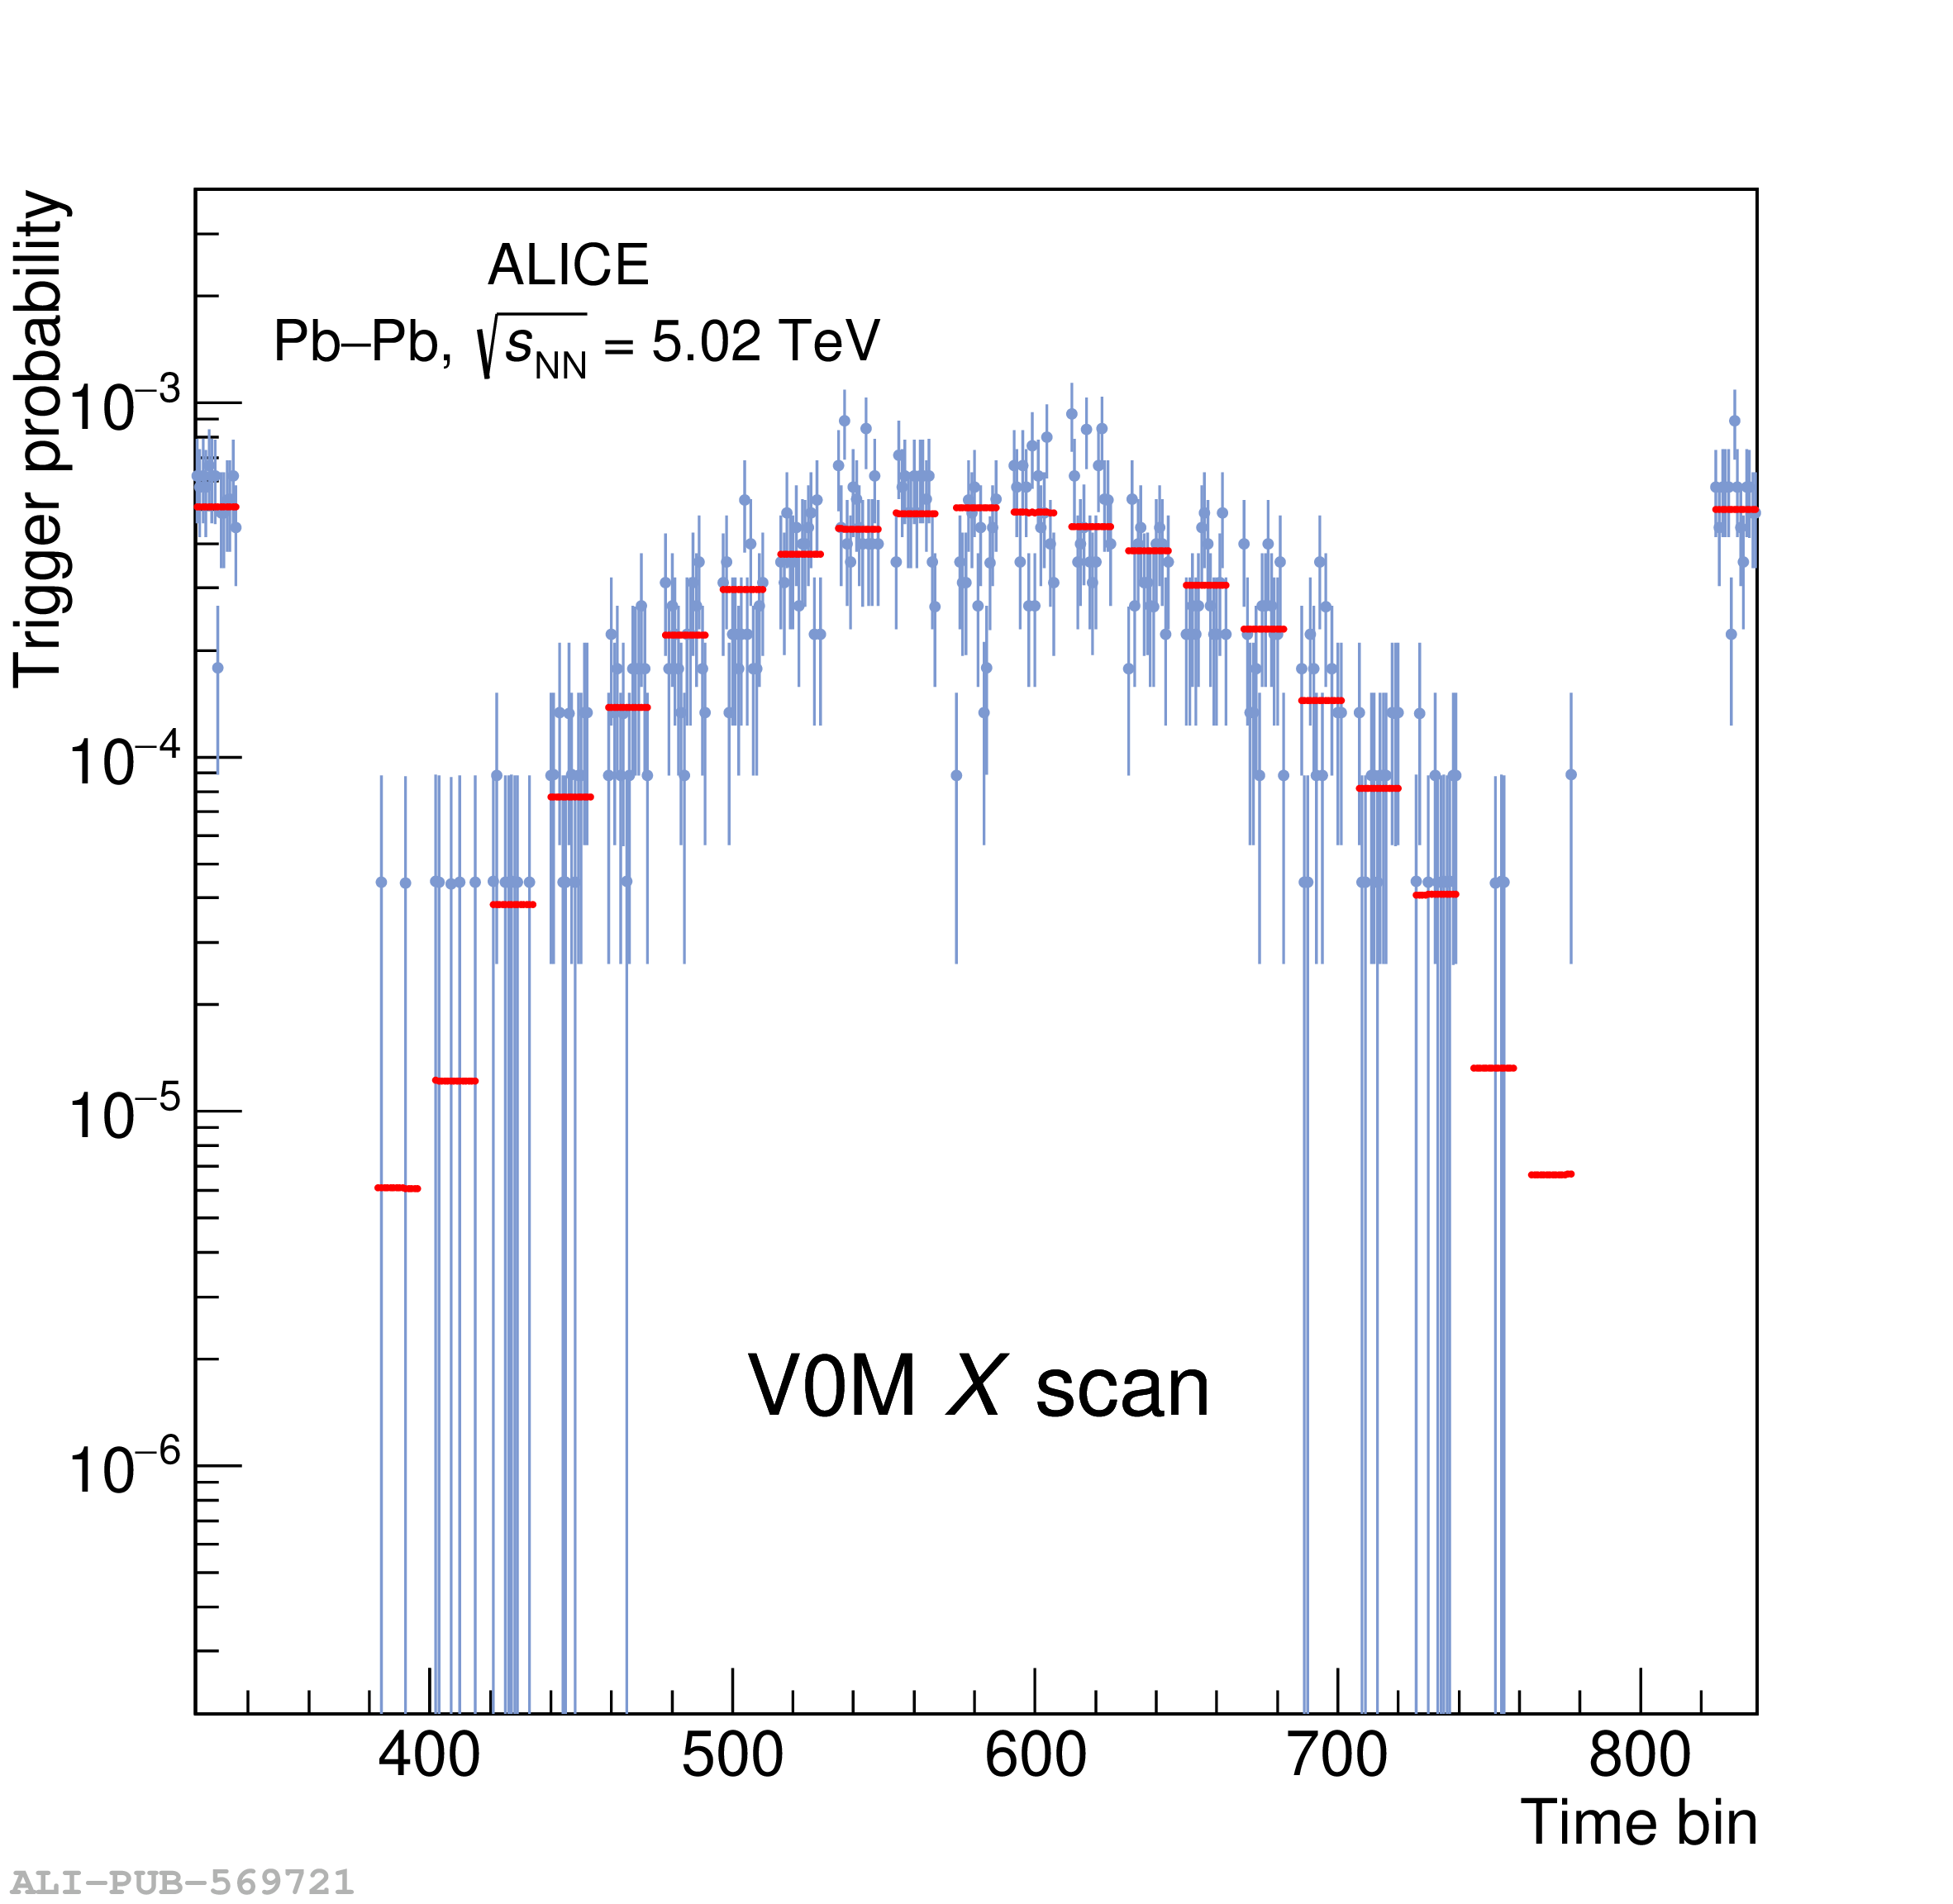 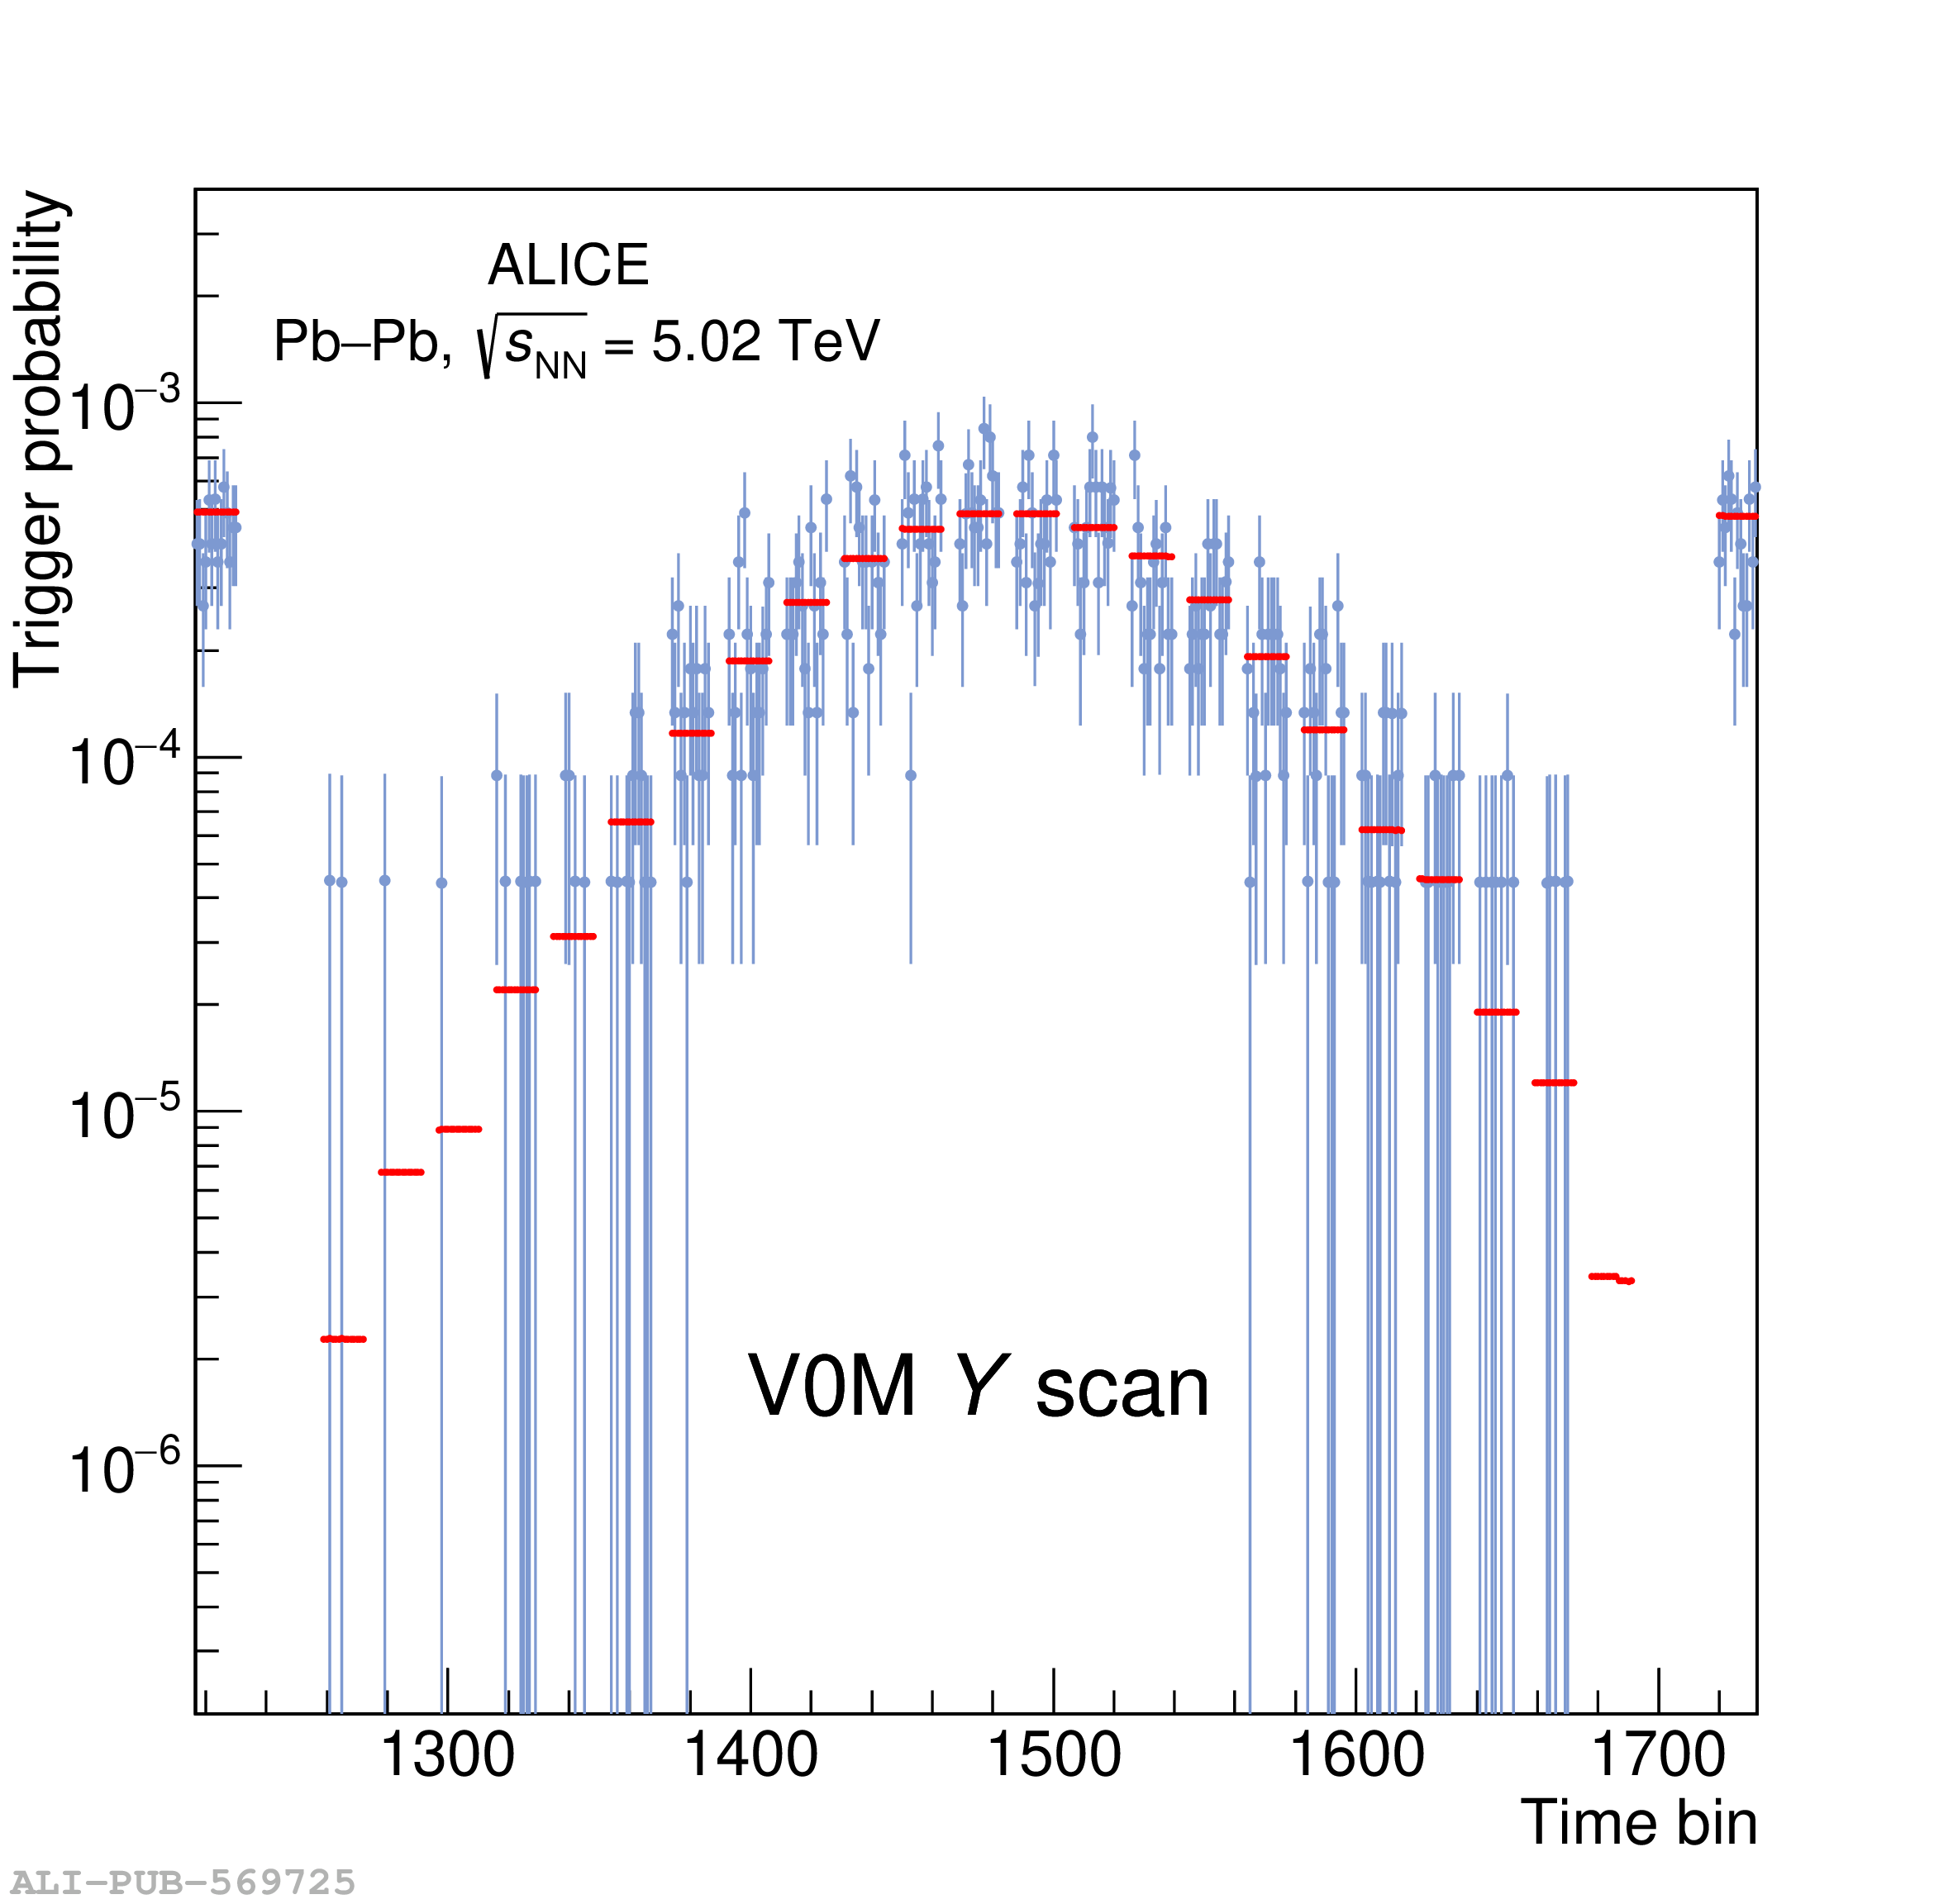 |
Figure 3
Nominal versus measured displacements in the horizontal (left) and vertical (right) length-scale calibration scans, obtained from events with reconstructed-track multiplicity ranging from 260 to 500. Data are represented by symbols, while a linear fit is represented by the solid lines. The uncertainties are smaller than the symbol sizes. The fit residuals are shown in the lower panel. The blue (green, red) lines and solid circles (triangles, squares) correspond to a nominal displacement step size of 21.06 $\mu$m (32.43 $\mu$m, 42.16 $\mu$m). | 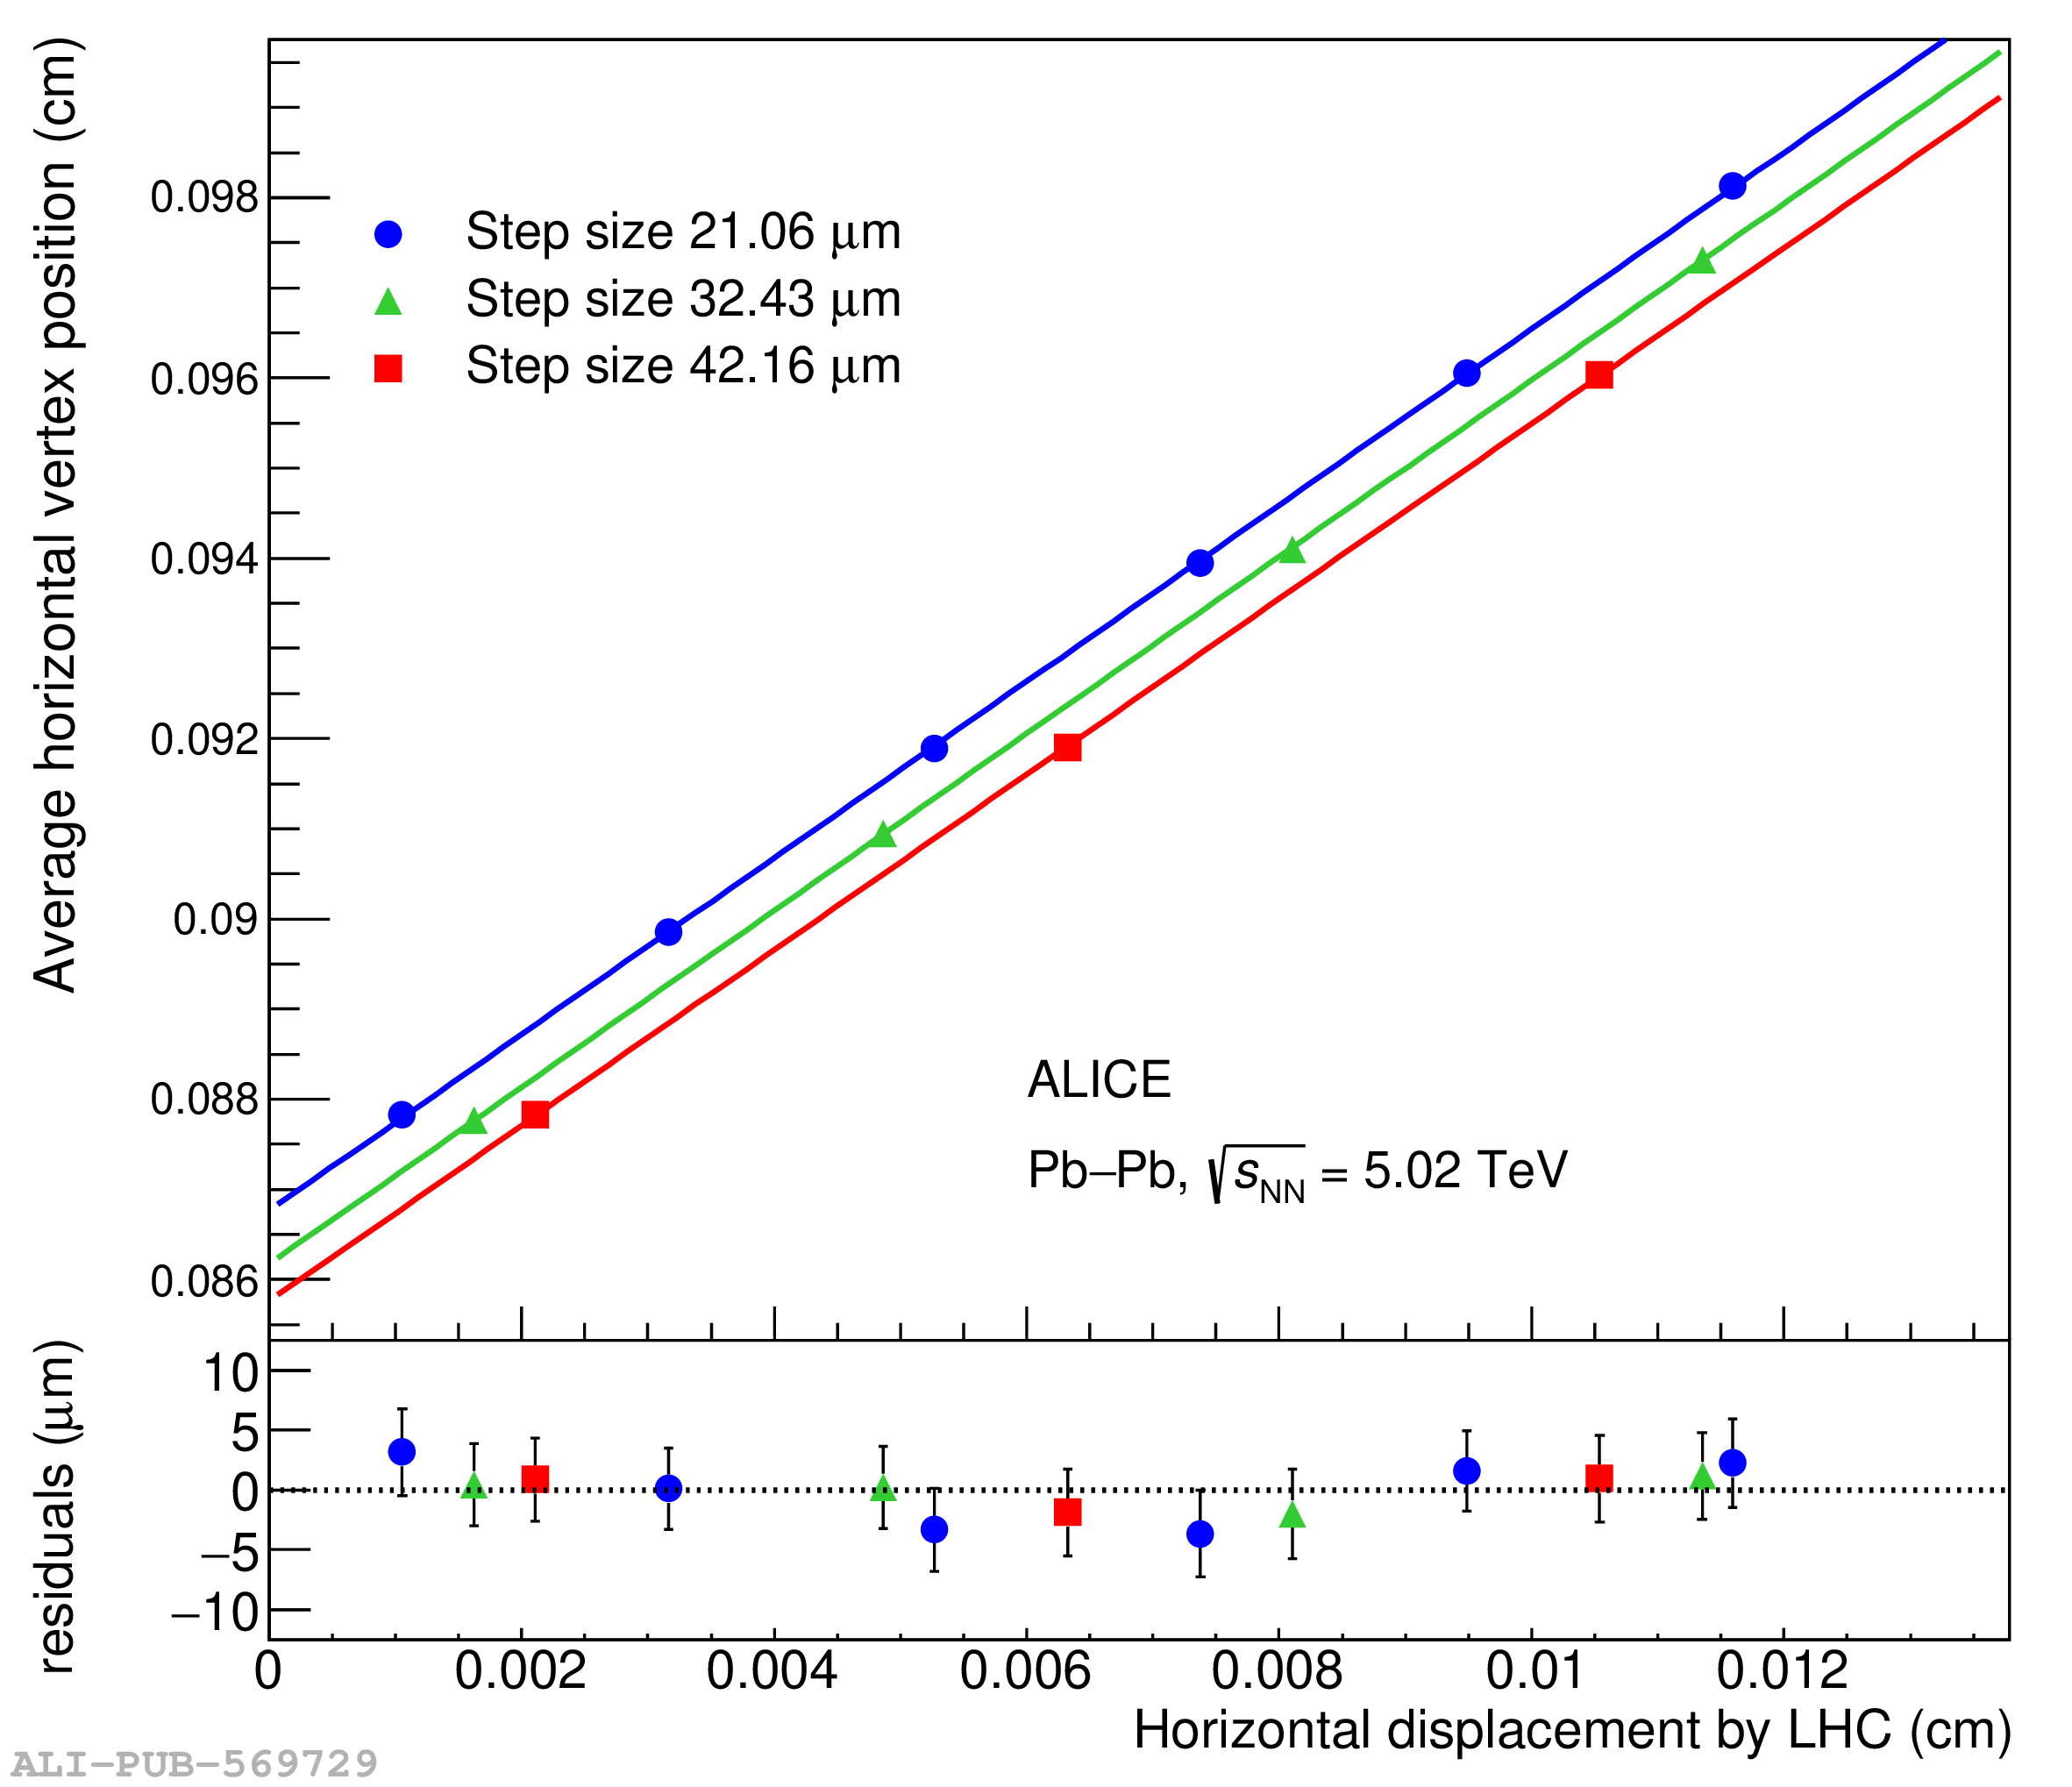 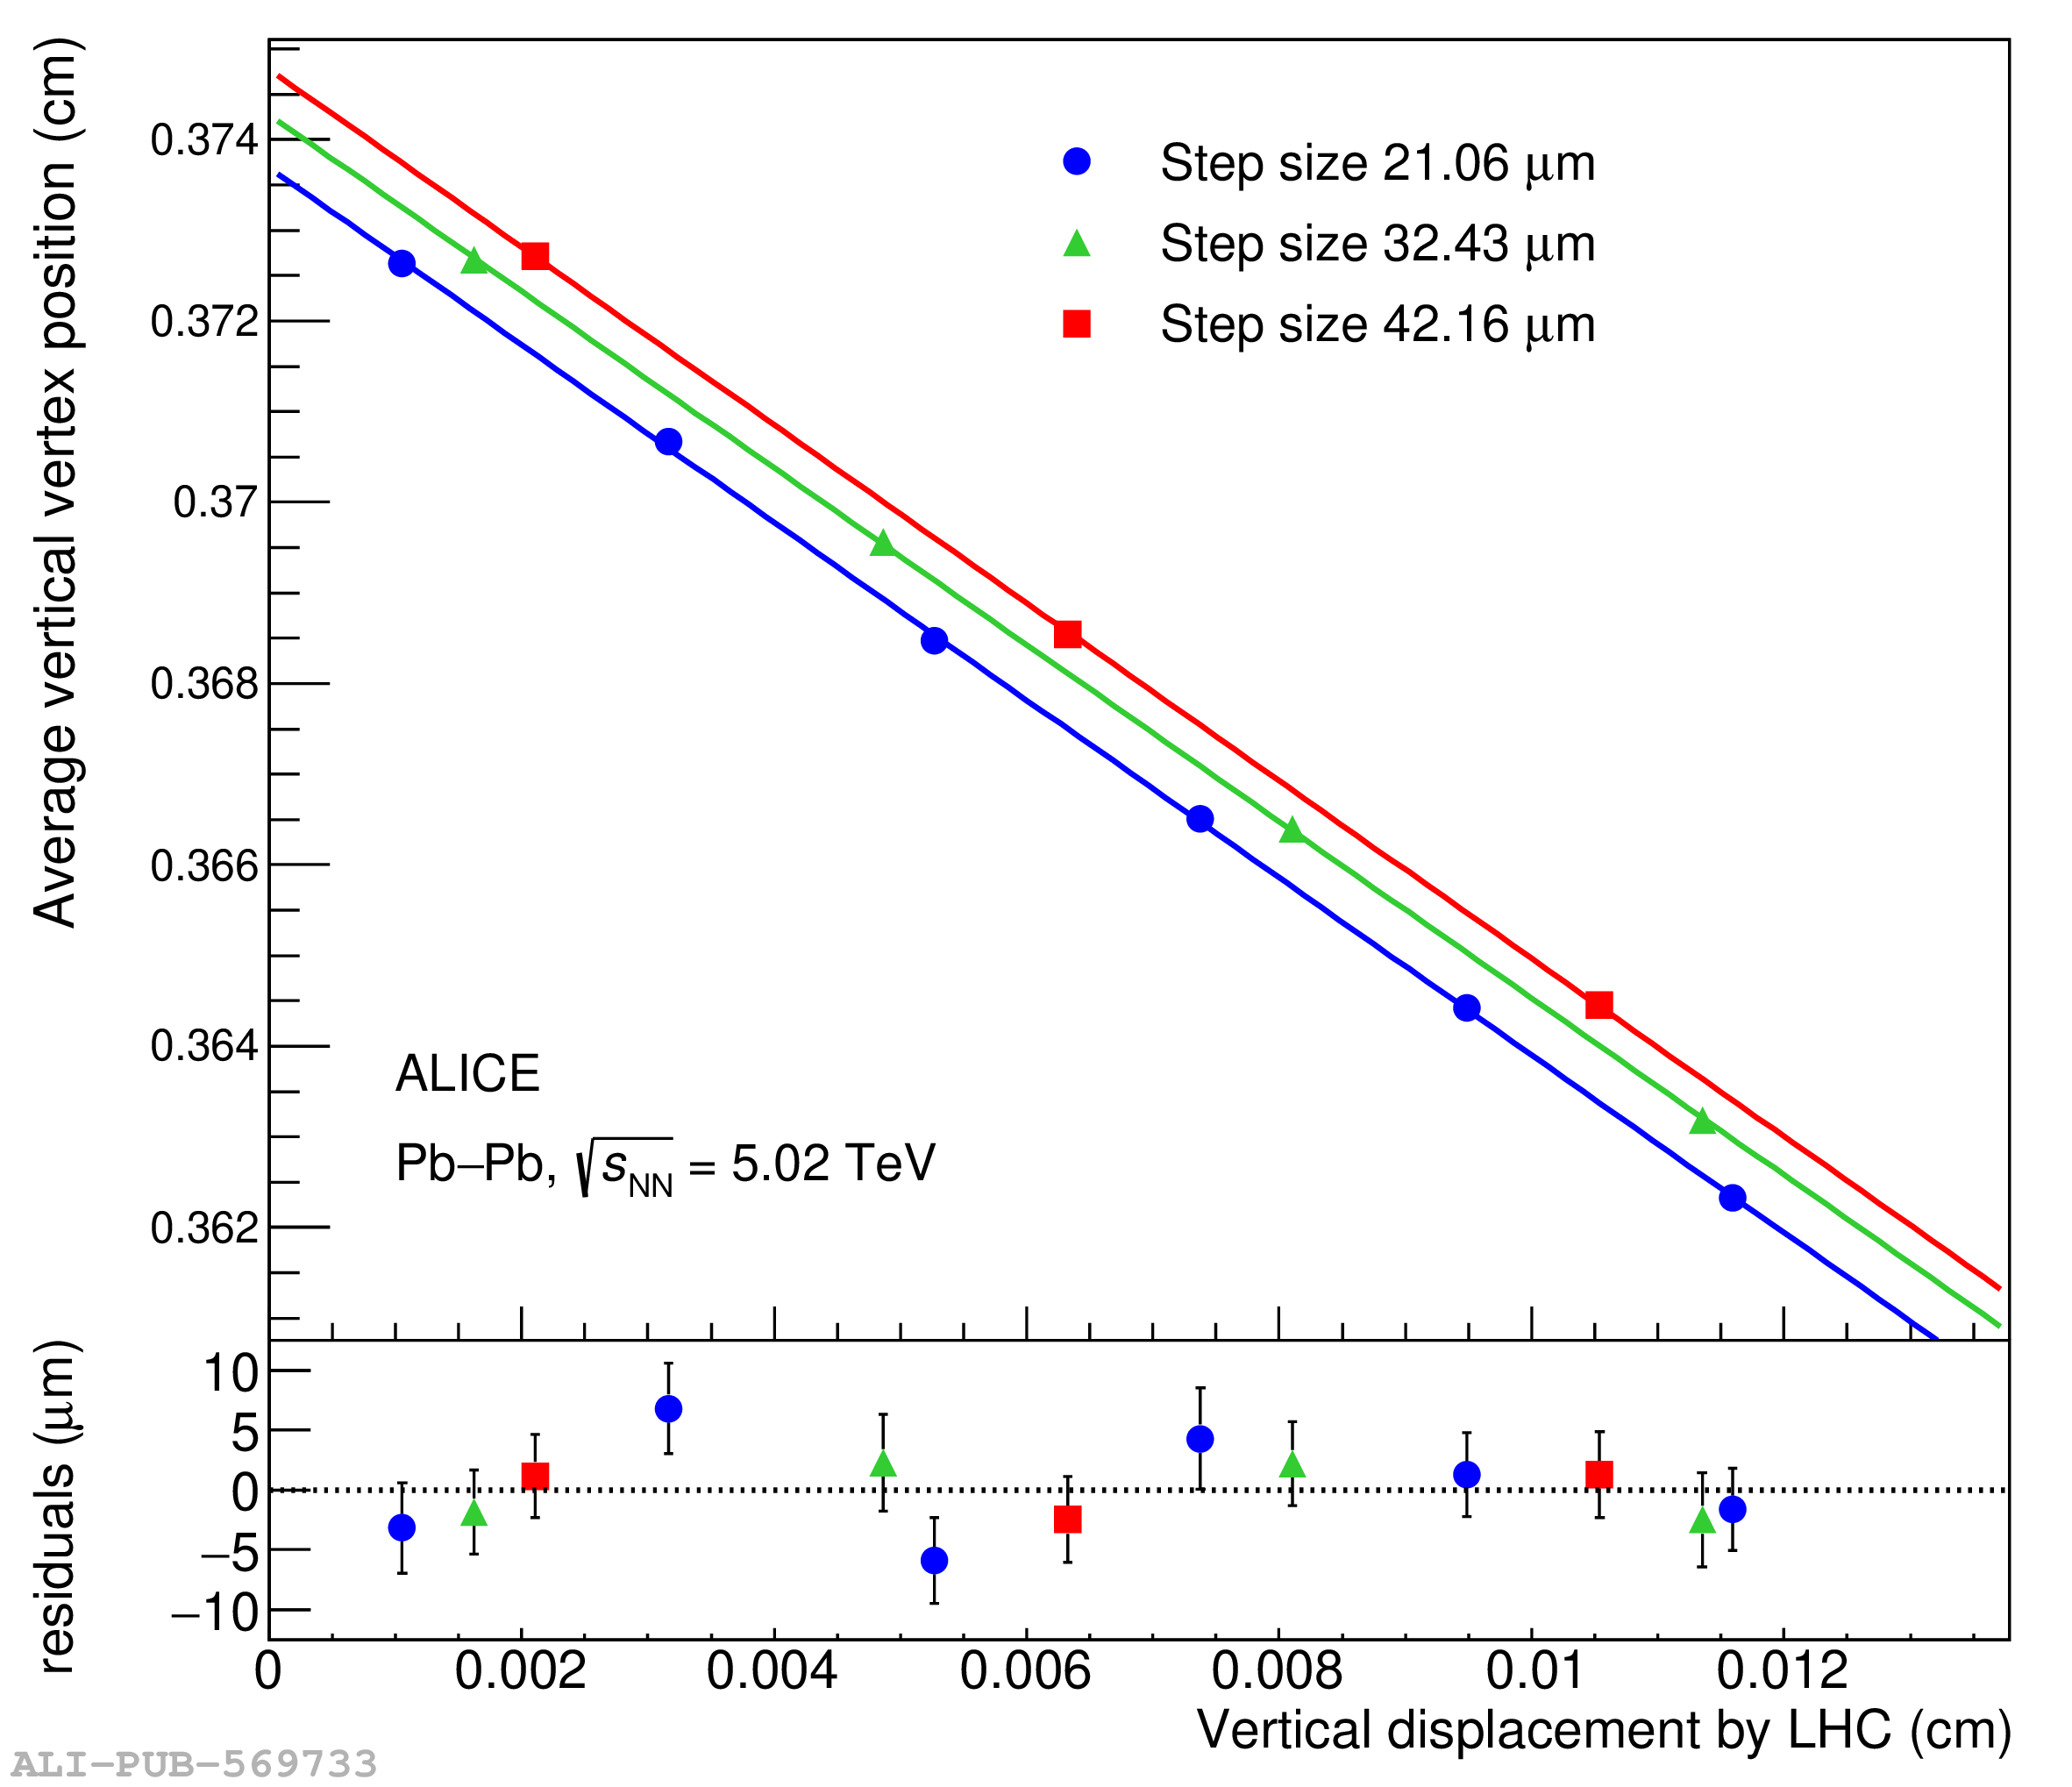 |
Figure 4
Measured ZED (left) and V0M (right) visible cross sections as a function of the product of the ion bunch intensities, for the first (top) and second vdM scan (bottom). Uncertainties are statistical only. The solid line represents a fit to a constant value. |  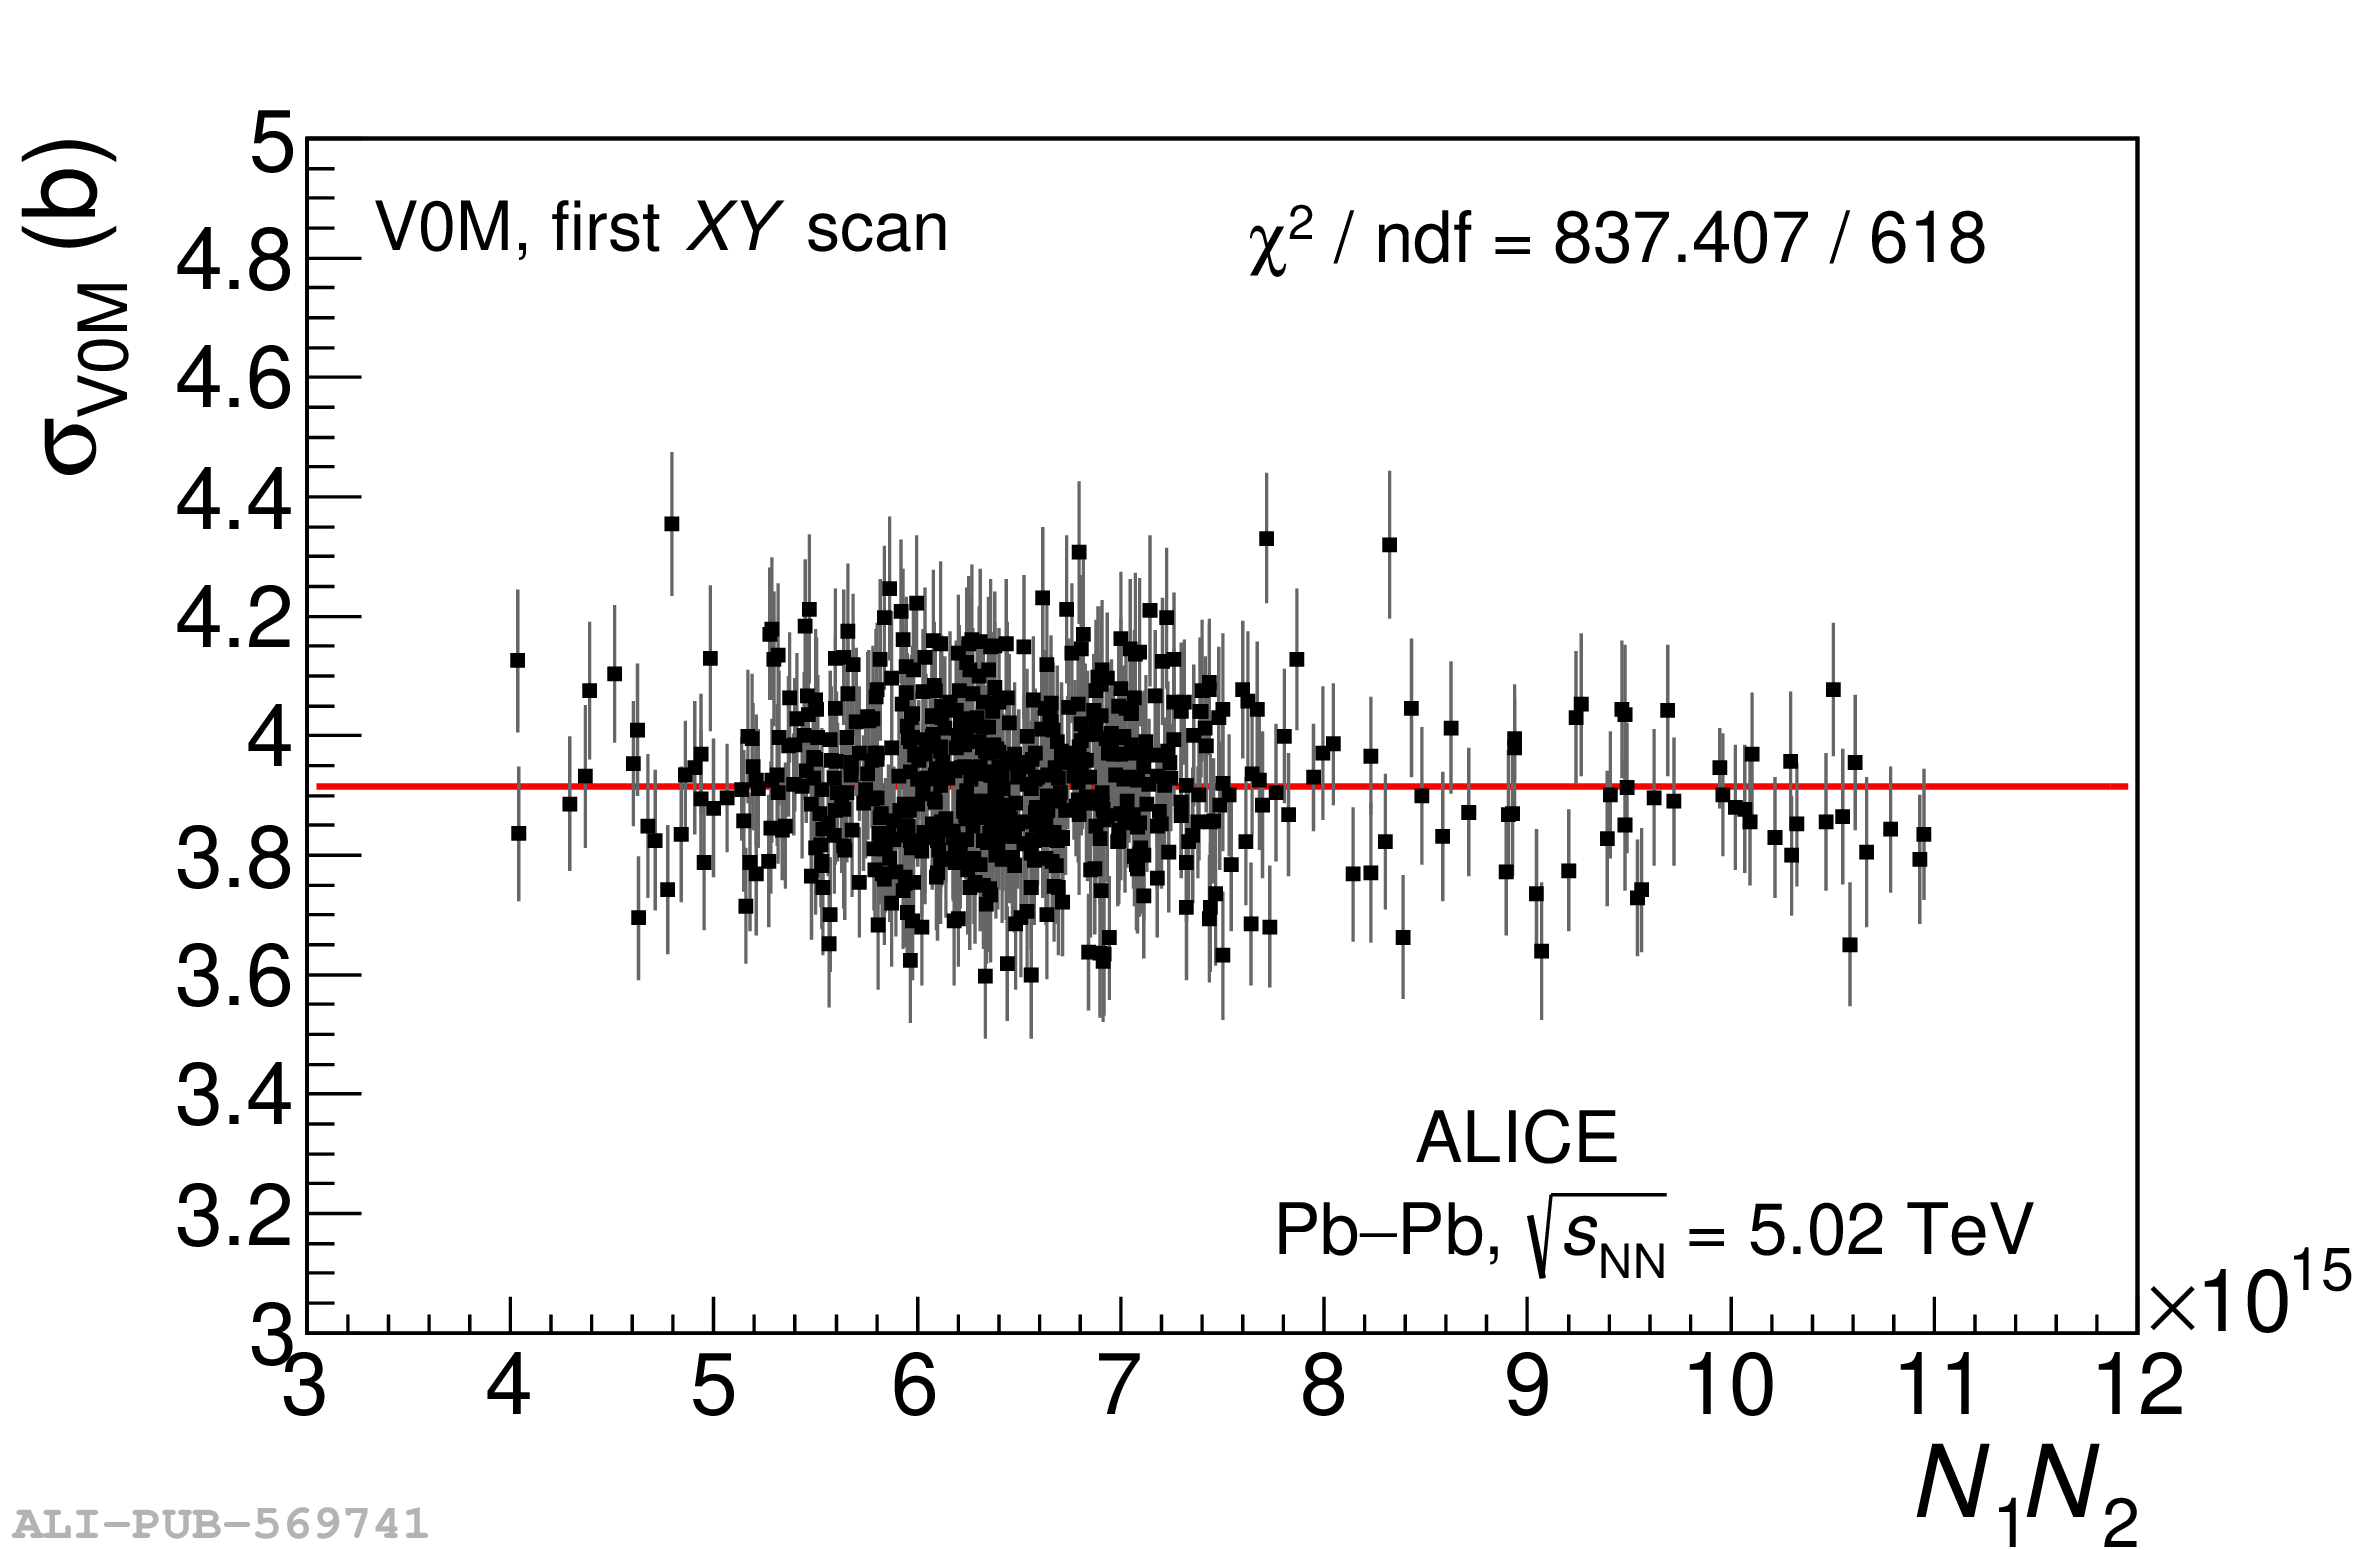 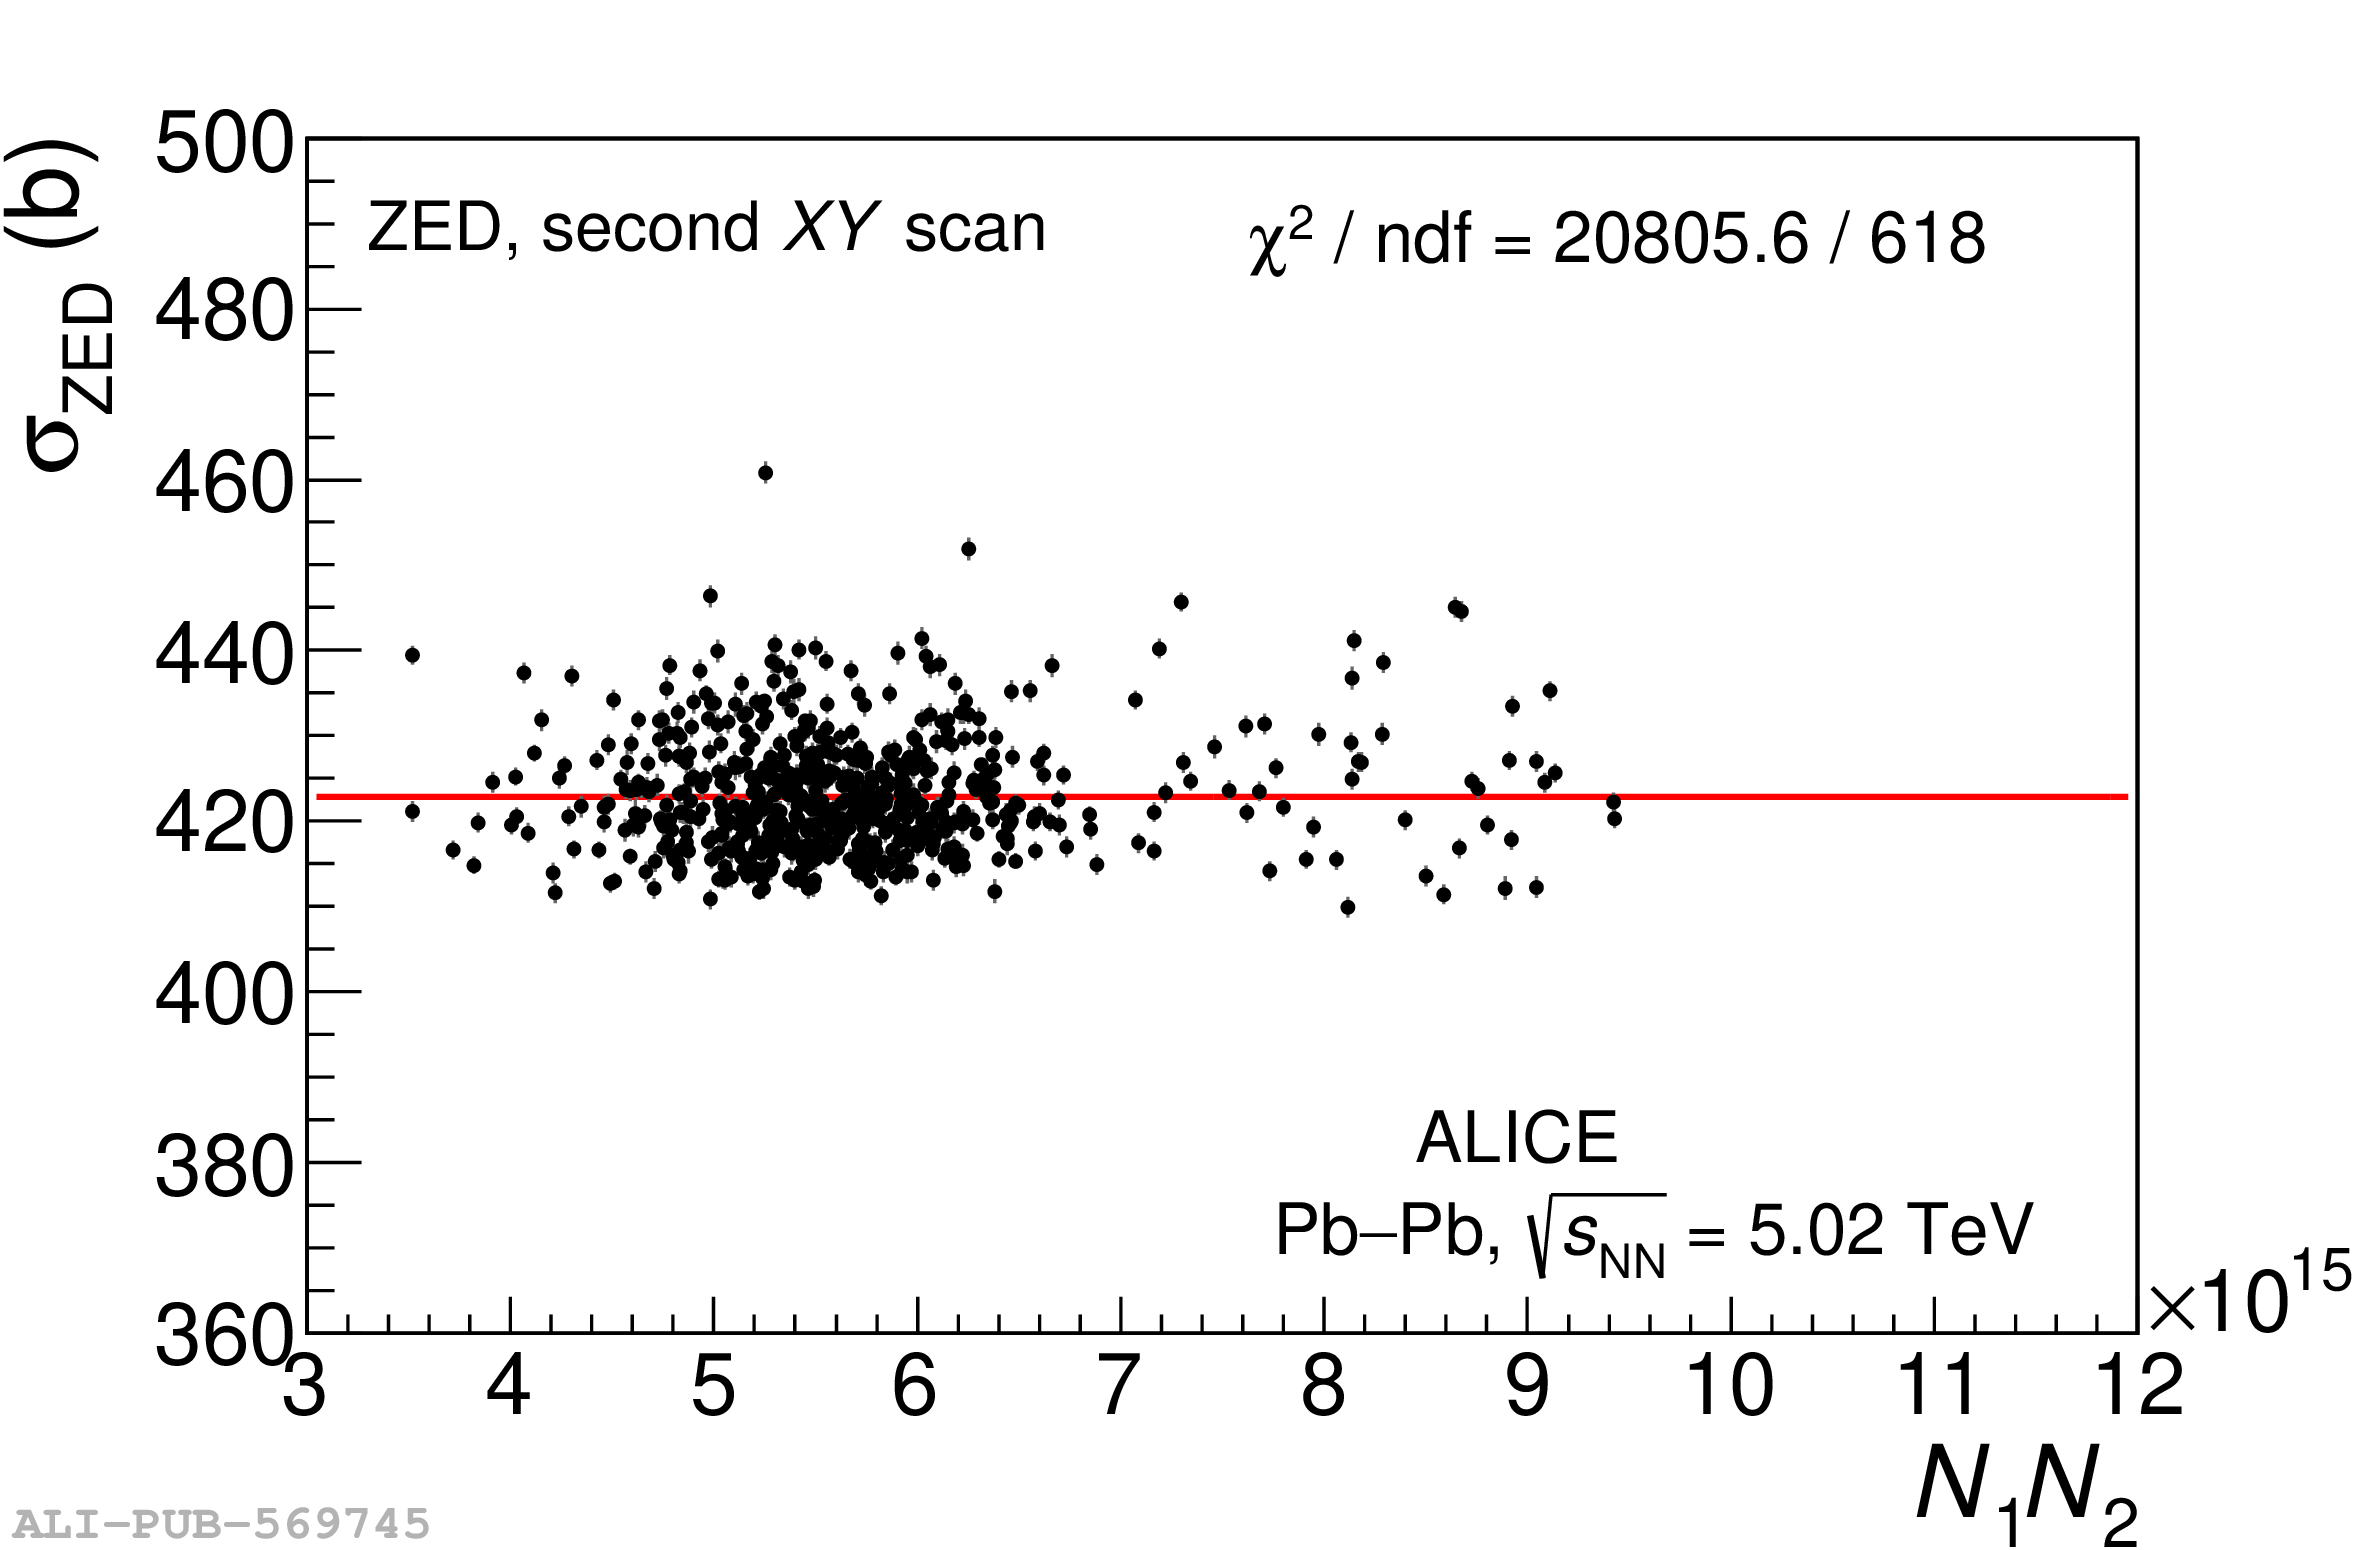 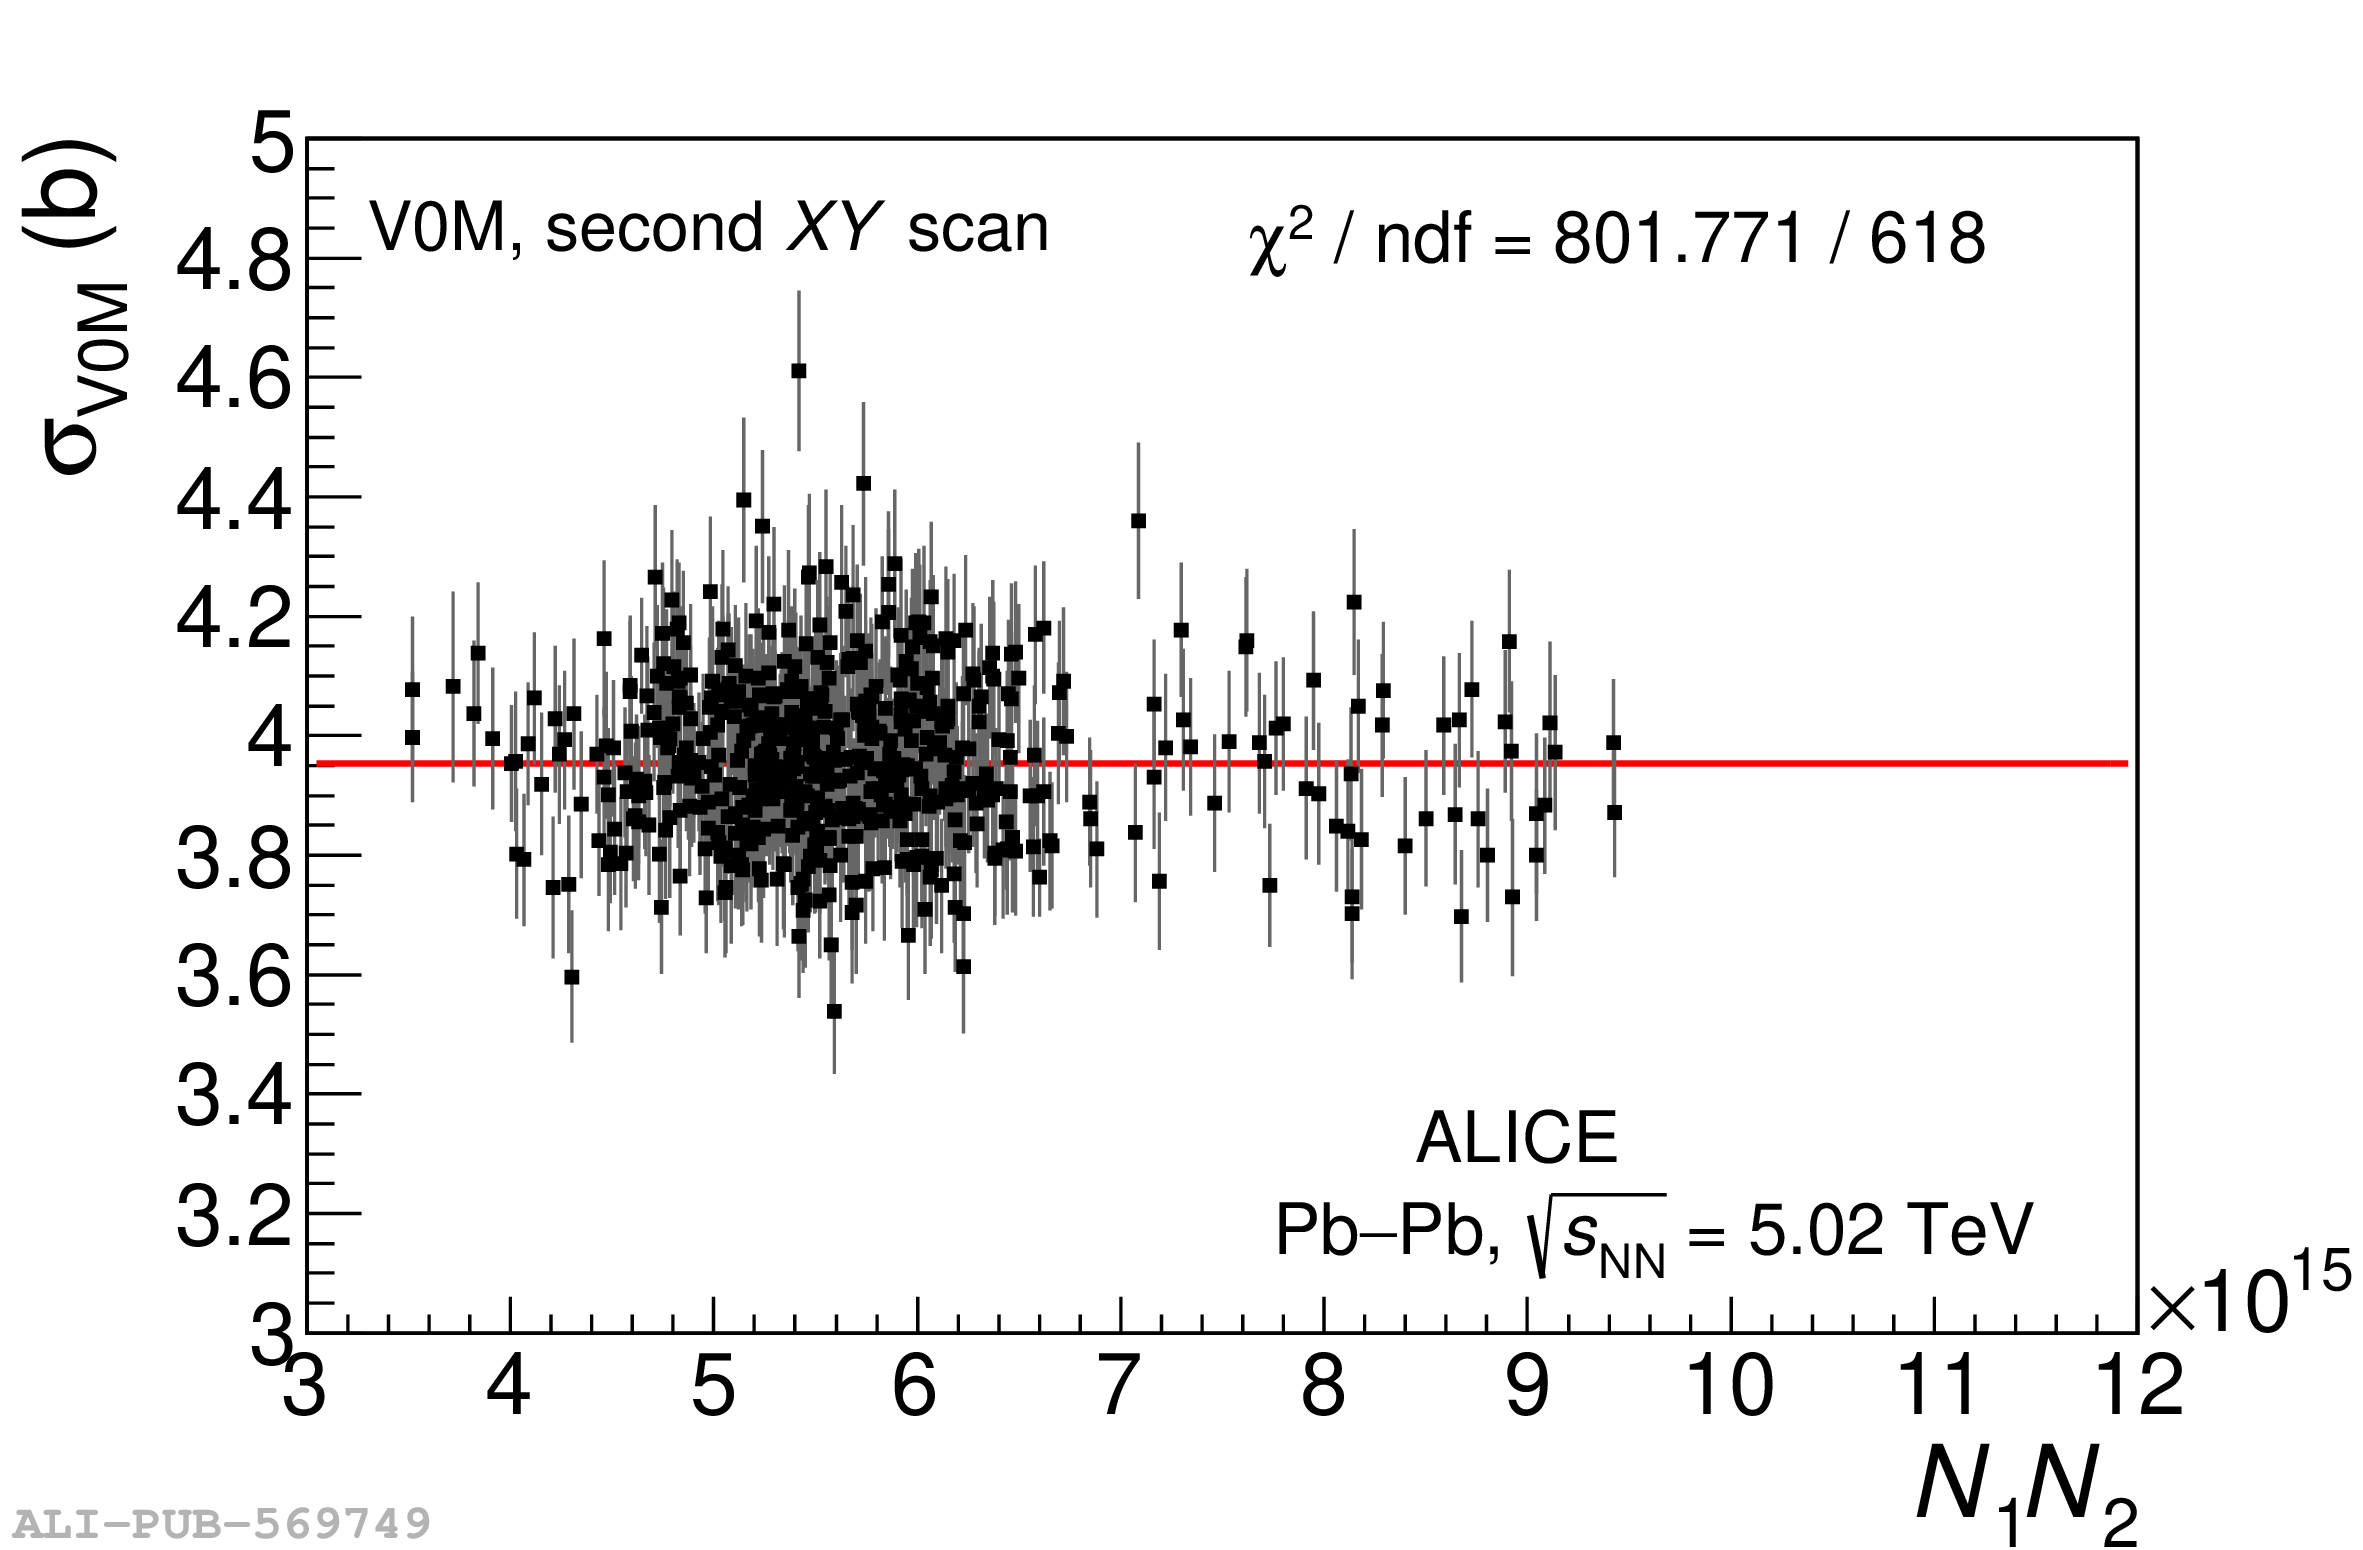 |

Figure 6
Left: ratio of V0M and ZED luminosities calculated according to Eq. \ref{eq:V0MtoZED} as a function of time with respect to the beginning of the data-taking periods for 2015 (circles) and 2018 (squares). The uncertainties are statistical. Right: distribution of the ratios for all runs (2015 and 2018), weighted with the run luminosity. The dashed vertical lines are located at $L_{\rm{V0M}}/L_{\rm{ZED}}=1$ $\pm$ $\alpha$, where $\alpha$ $\sim$ 0.007 is the mean quadratic difference from unity. |   |