Invariant-mass (mass-difference) distribution of D0, D+, and D∗+ meson candidates in different pT intervals for the centrality class 0–10%. The fit functions are composed of a Gaussian function for the signal
and an additional term for the background, as described in detail in the text. The values for the Gaussian meanμ, width σ, and raw yield S are also reported. Top row: D0-meson candidates with 0 < pT < 1 GeV/c without reconstructing the decay vertex. The invariant-mass distributions are shown before (left) and after (right) the subtraction of the combinatorial background estimated from event-mixing. Middle row: D0-meson candidates with 1 < pT < 1.5 GeV/c with reconstruction of the decay vertex before (left) and after (right) background subtraction. The width of the Gaussian in this and in the previous pT interval is fixed to the value obtained from simulations. Bottom row: D+-meson candidates with 5 < pT < 5.5 GeV/c (left) and D∗+-meson candidates with 16 < pT < 24 GeV/c (right). | 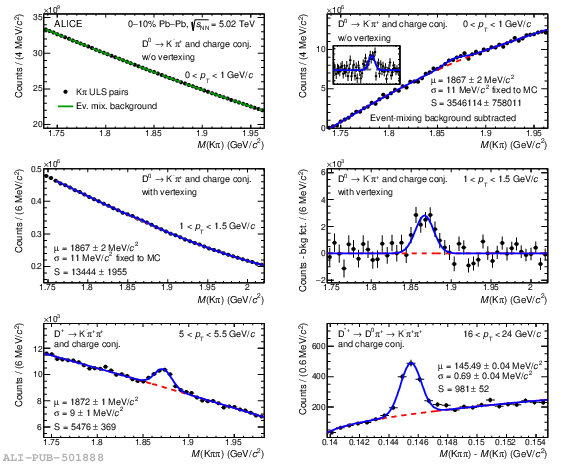 |