Correlation strength parameter, $\lambda$, extracted in the present analysis from K$^0_{\rm S}$K$^{\rm \pm}$ femtoscopy averaged over K$^0_{\rm S}$K$^{\rm +}$and K$^0_{\rm S}$K$^{\rm -}$ and the two baseline fit methods (red symbols), along withcomparisons with identical kaon results from ALICE (blue symbols) Statistical (lines) and the linear sum of statistical and systematic uncertainties (boxes) are shown. | 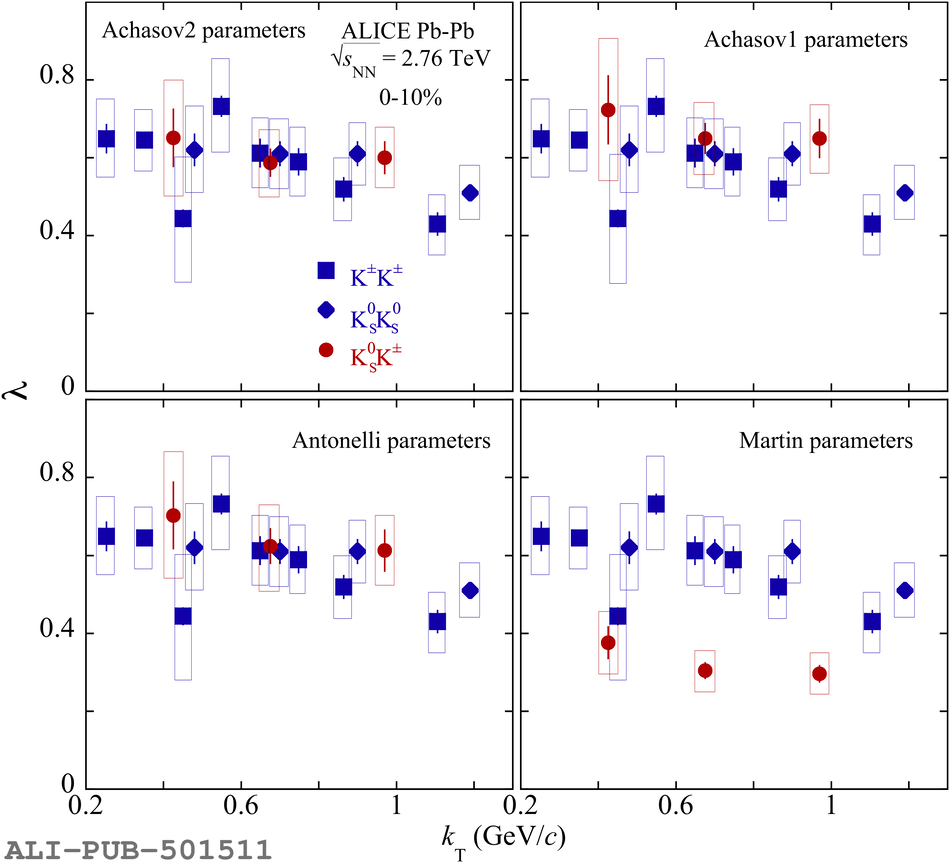 |