Left: scattering parameters obtained from the Lednick\'y--Lyuboshitz fit compared with available world data and theoretical calculations. Statistical uncertainties are represented as bars and systematic uncertainties, if provided, as boxes. Right: experimental femtoscopic correlation function for $\kam p\oplus \kap \overline{p}$ pairs in the 30--40\% centrality interval, together with various Lednick\'y--Lyuboshitz calculations obtained using the scattering length parameters from Refs. and the source radius from this analysis. The statistical and systematic uncertainties of the measured data points are added in quadrature and shown as vertical bars. | 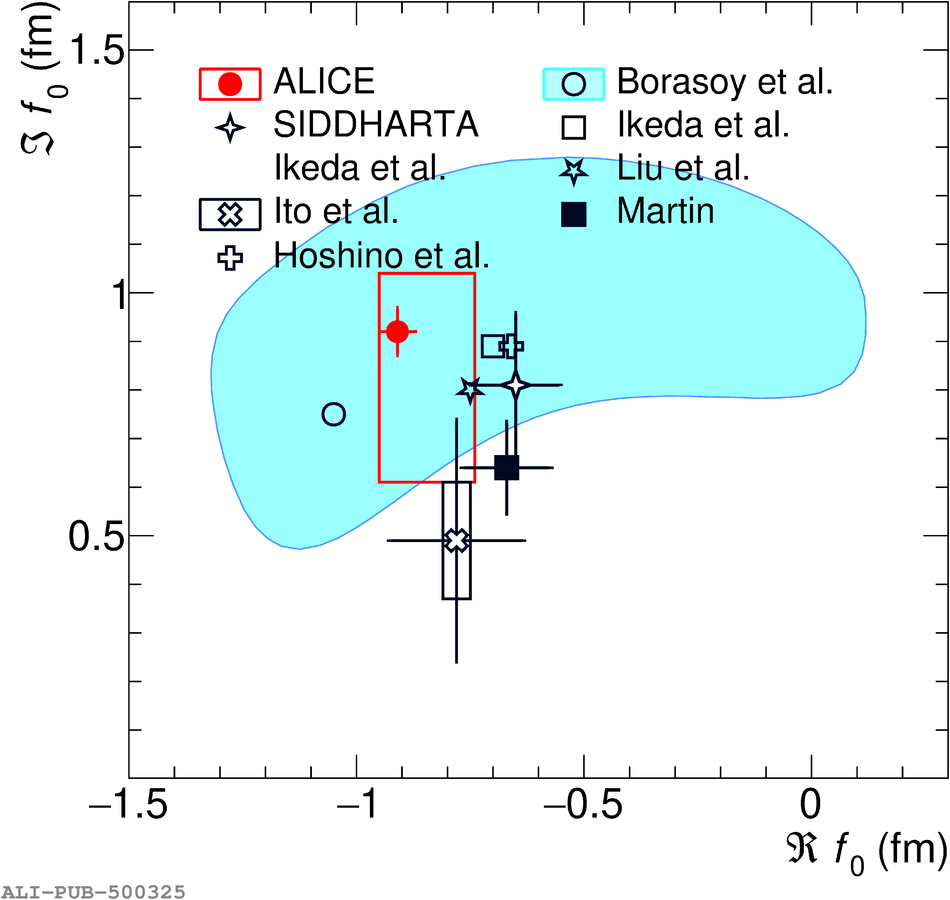  |