The $\rm K^{-}p \oplus K^{+}\overline{p}$ correlation functions in the six centrality classes, with the corresponding Lednick\'y--Lyuboshitz fits (denoted as ``L--L'') and Kyoto model calculations shown as light cyan and orange bands, respectively. The width of the bands corresponds to the 1-$\sigma$ uncertainties. The inserts show the $\rm K^{+}p \oplus K^{-}\overline{p}$ correlation functions with Lednick\'y--Lyuboshitz fits as light cyan bands. The bottom panels show the difference between data and the fit (model) normalised by the statistical uncertainty of the data $\sigma_{\rm stat}$. The average pair transverse mass $\langle m_{\rm T}\rangle$ is $0.92\pm0.03$ GeV/$c^{2}$ for all centrality intervals The statistical and systematic uncertainties are added in quadrature and shown as vertical bars | 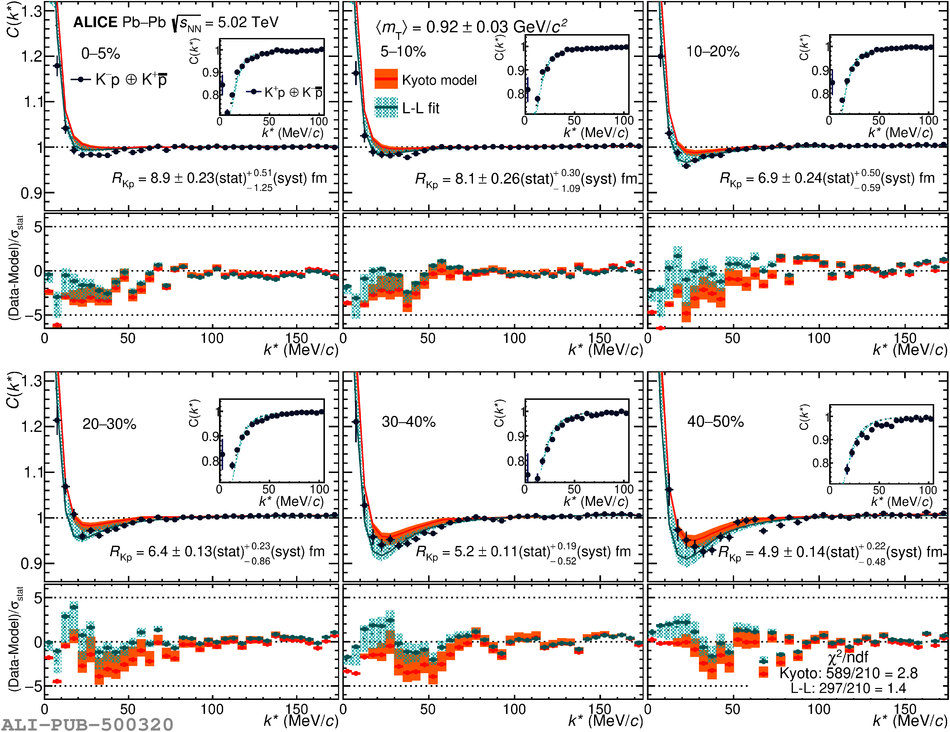 |