Left: Invariant mass distribution of \lplp\ pairs. The dashed green line corresponds to the background. The solid magenta and red lines correspond to Crystal Ball functions representing the \Jpsi\ and \Ppsi\ signal, respectively. The solid blue line corresponds to the sum of background and signal functions. Right: Transverse momentum distribution of \Jpsi\ candidates in the range quoted in the figure (around the \Jpsi\ nominal mass). |  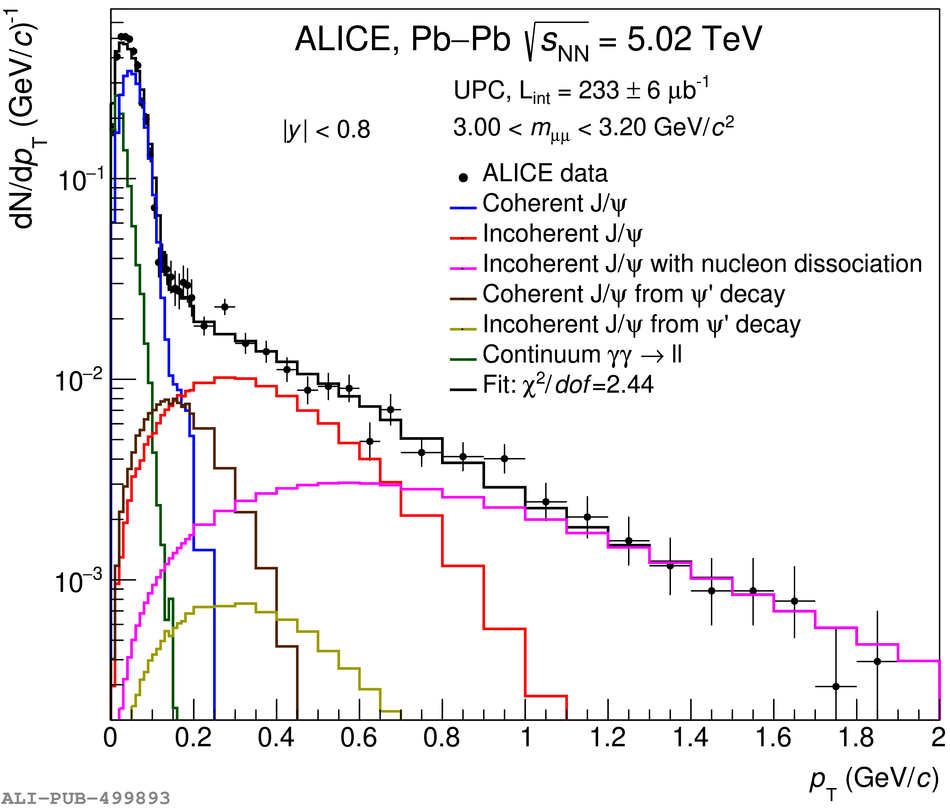 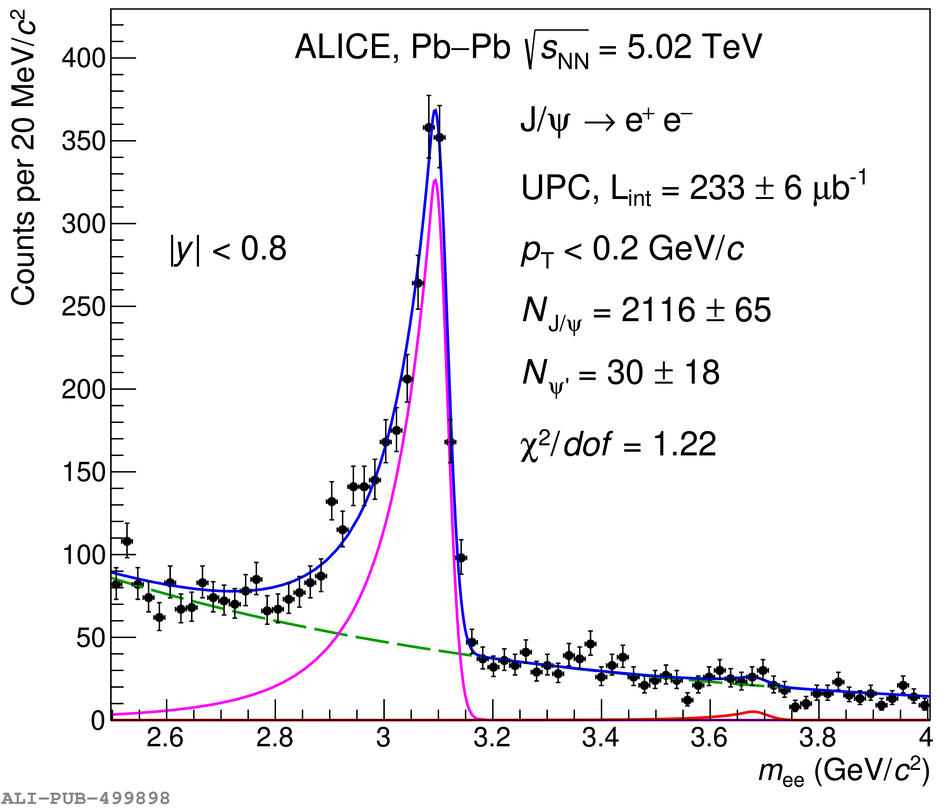 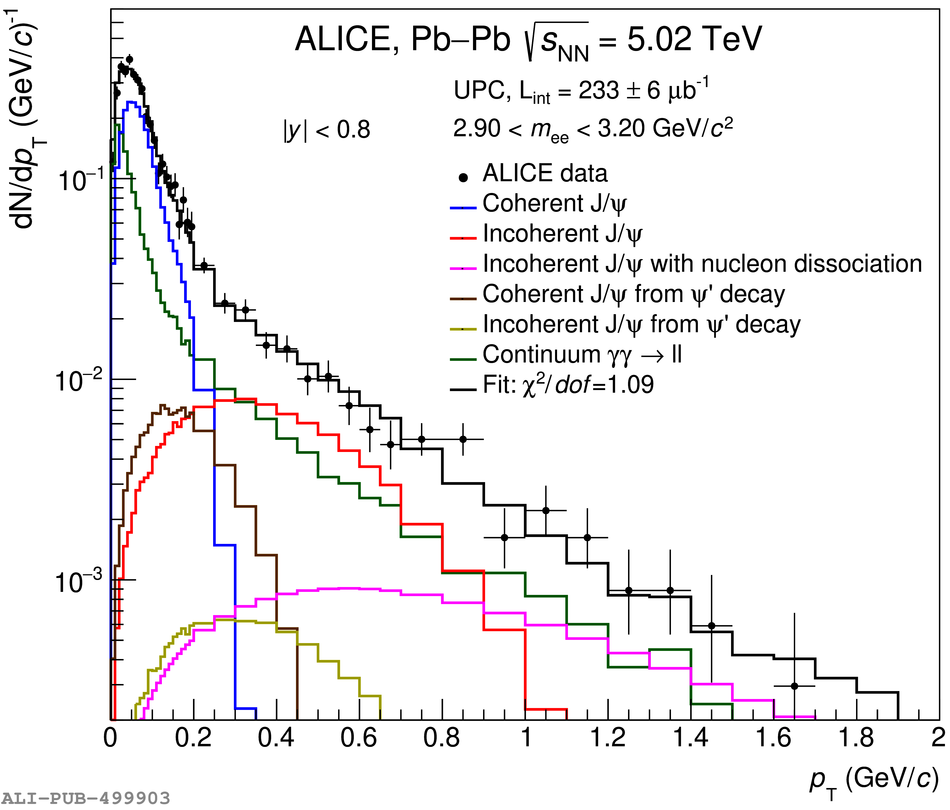 |