(Left) Ratio of \upstwos-to-\upsones yields as a function of the average number of participants. The results are displayed on top of the statistical hadronisation model values . The two curves represent the uncertainty of the pp-like contribution of the corona of the nuclear overlap (Right) Relative nuclear modification factor along with the predictions from the comover interaction model , hydrodynamic calculations , from the transport model and calculations based on the coupled Boltzmann equations . The filled red box at unity denotes the uncertainty on the \upstwos-to-\upsones cross section ratio in pp collisions | 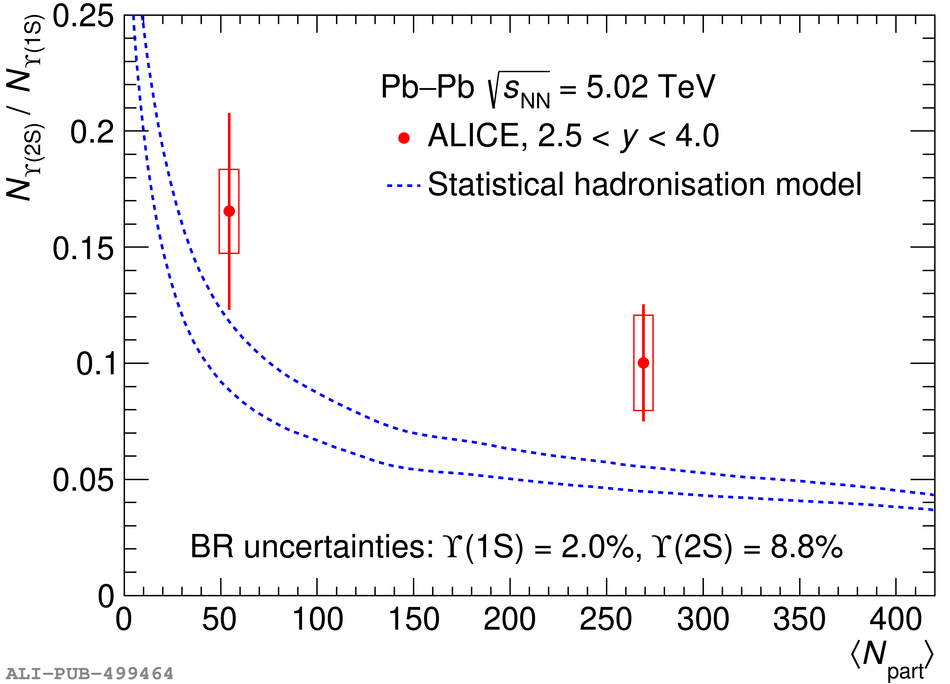 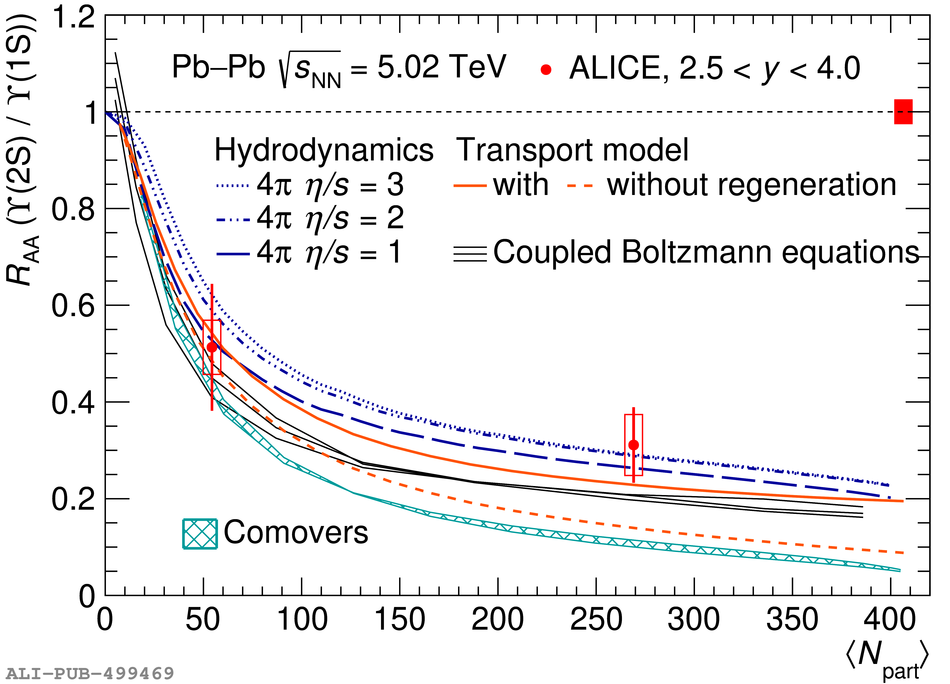 |