Femtoscopic correlations with the particle pair combinations K$^0_{\rm S}$K$^0_{\rm S}$ and K$^0_{\rm S}$K$^\pm$ are studied in pp collisions at $\sqrt{s}=5.02$ and $13$ TeV by the ALICE experiment. At both energies, boson source parameters are extracted for both pair combinations, by fitting models based on Gaussian size distributions of the sources, to the measured two-particle correlation functions. The interaction model used for the K$^0_{\rm S}$K$^0_{\rm S}$ analysis includes quantum statistics and strong final-state interactions through the $f_0(980)$ and $a_0(980)$ resonances. The model used for the K$^0_{\rm S}$K$^\pm$ analysis includes only the final-state interaction through the $a_0$ resonance. Source parameters extracted in the present work are compared with published values from pp collisions at $\sqrt{s}=$ 7 TeV and the different pair combinations are found to be consistent. From the observation that the strength of the K$^0_{\rm S}$K$^0_{\rm S}$ correlations is significantly greater than the strength of the K$^0_{\rm S}$K$^\pm$ correlations, the new results are compatible with the $a_0$ resonance being a tetraquark state of the form $(q_1,\overline{q_2}, s, \overline{s})$, where $q_1$ and $q_2$ are $u$ or $d$ quarks.
Phys.Lett.B 833 (2022) 137335
e-Print: arXiv:2111.06611 | PDF | inSPIRE
Figure group
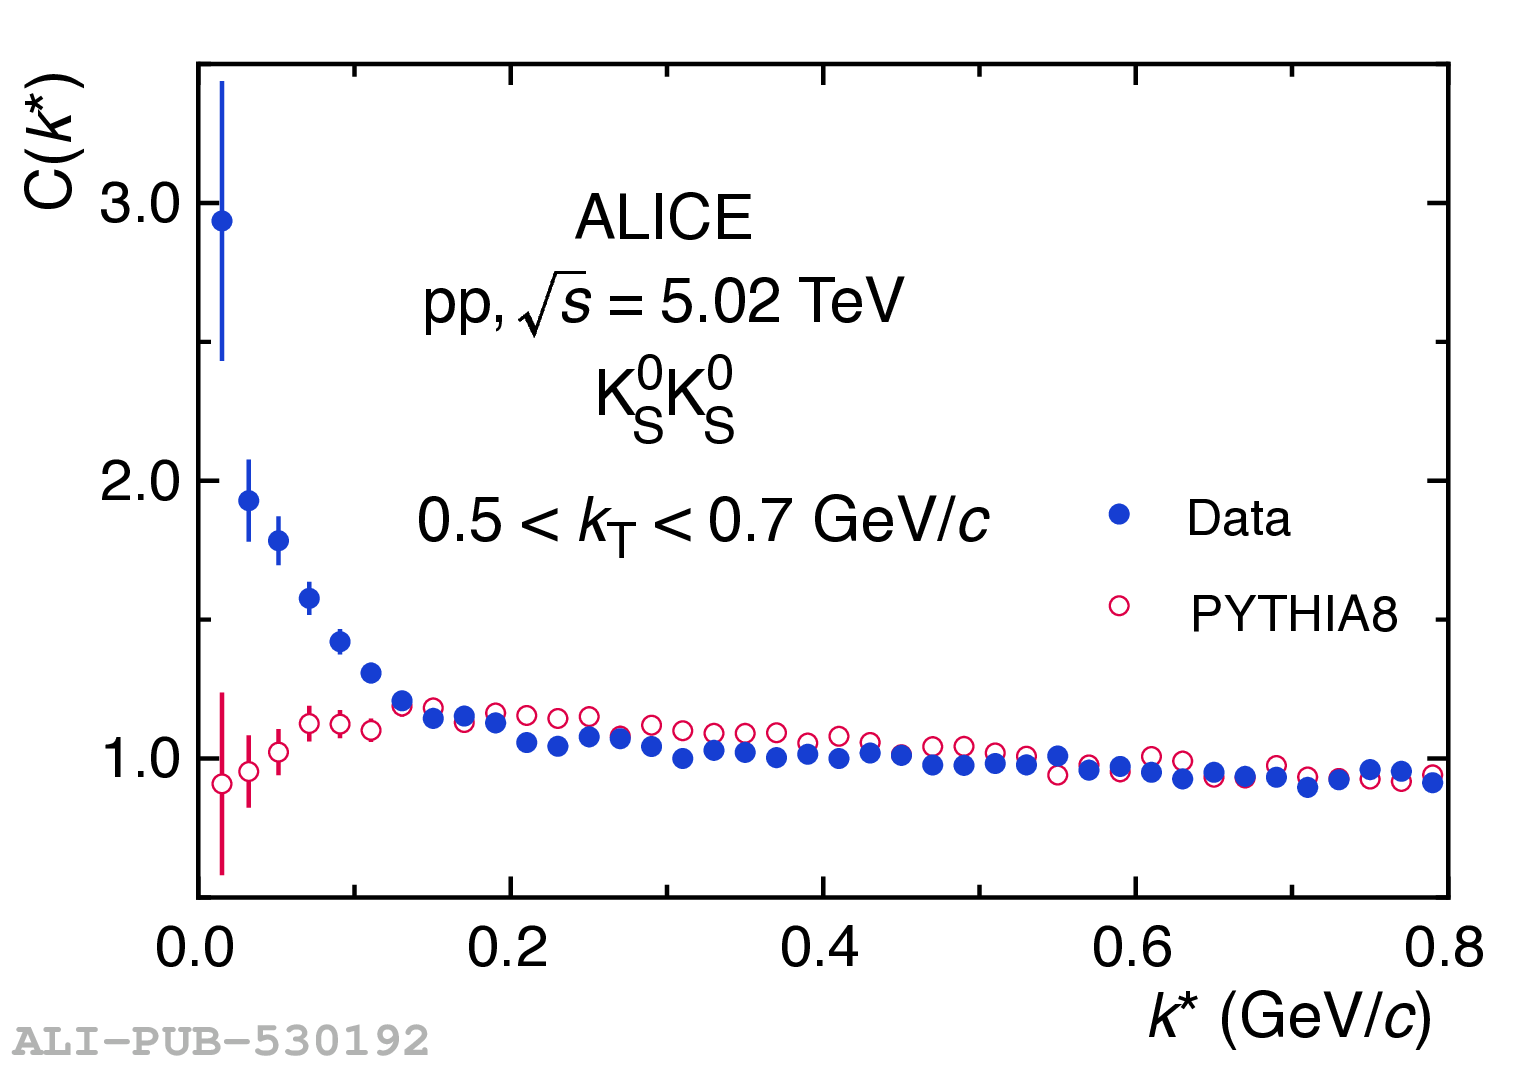
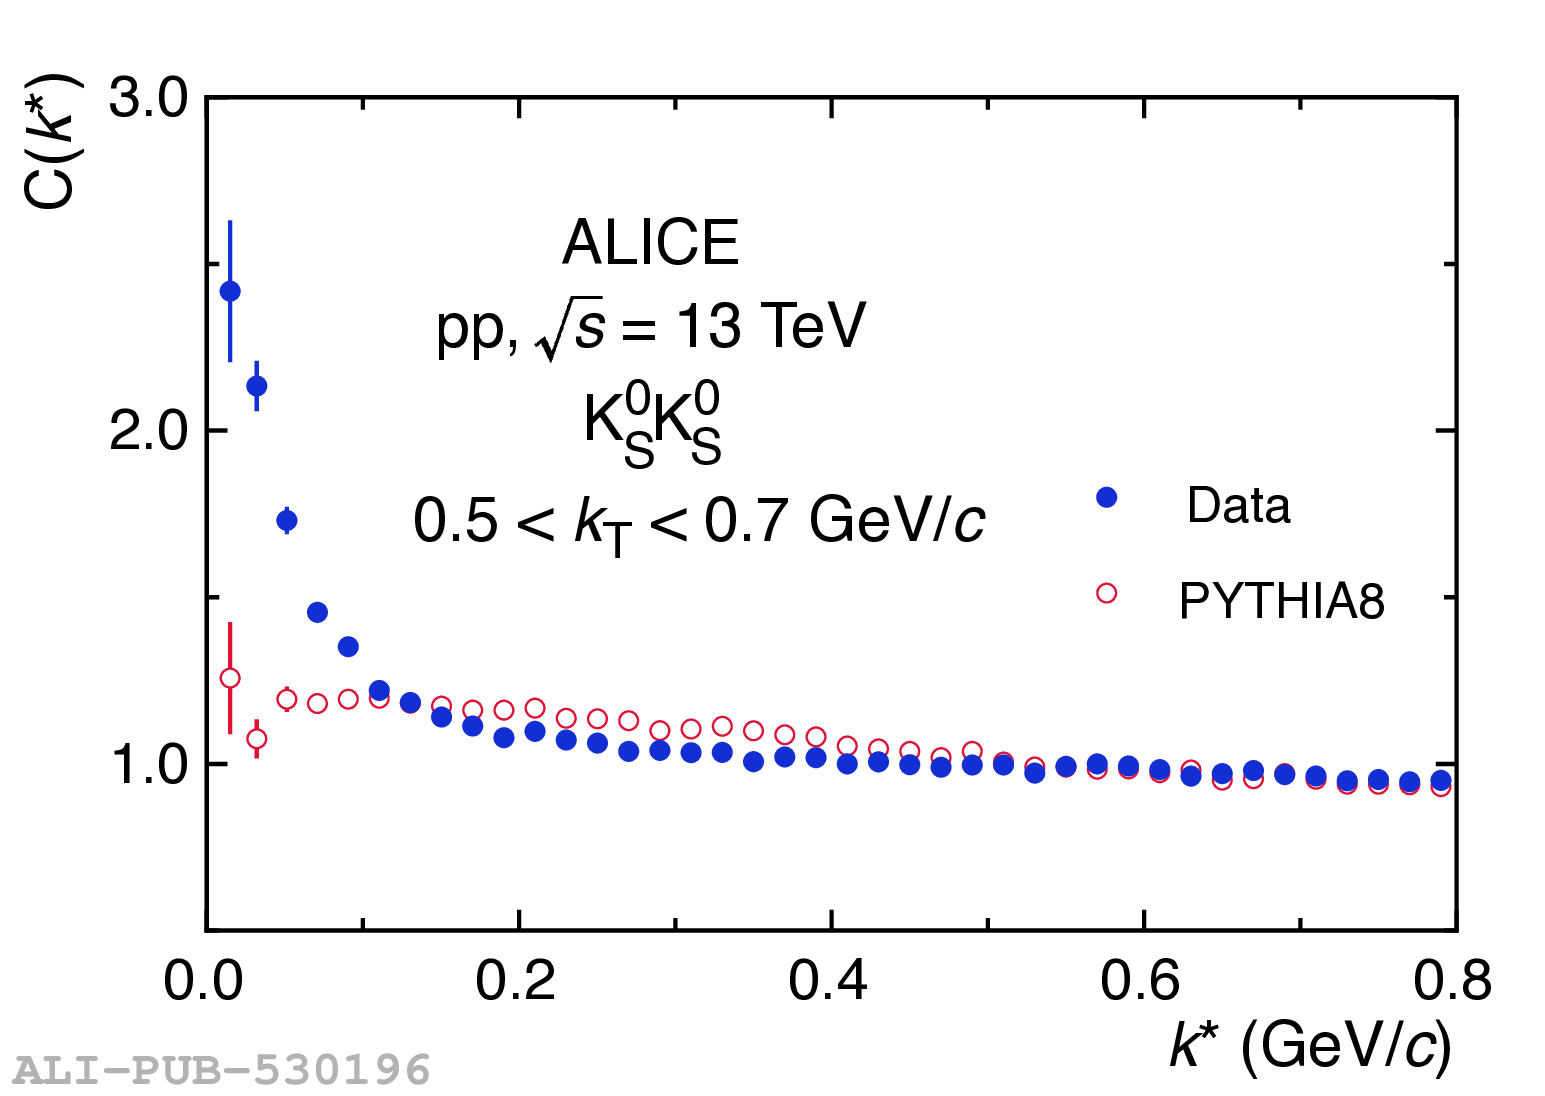
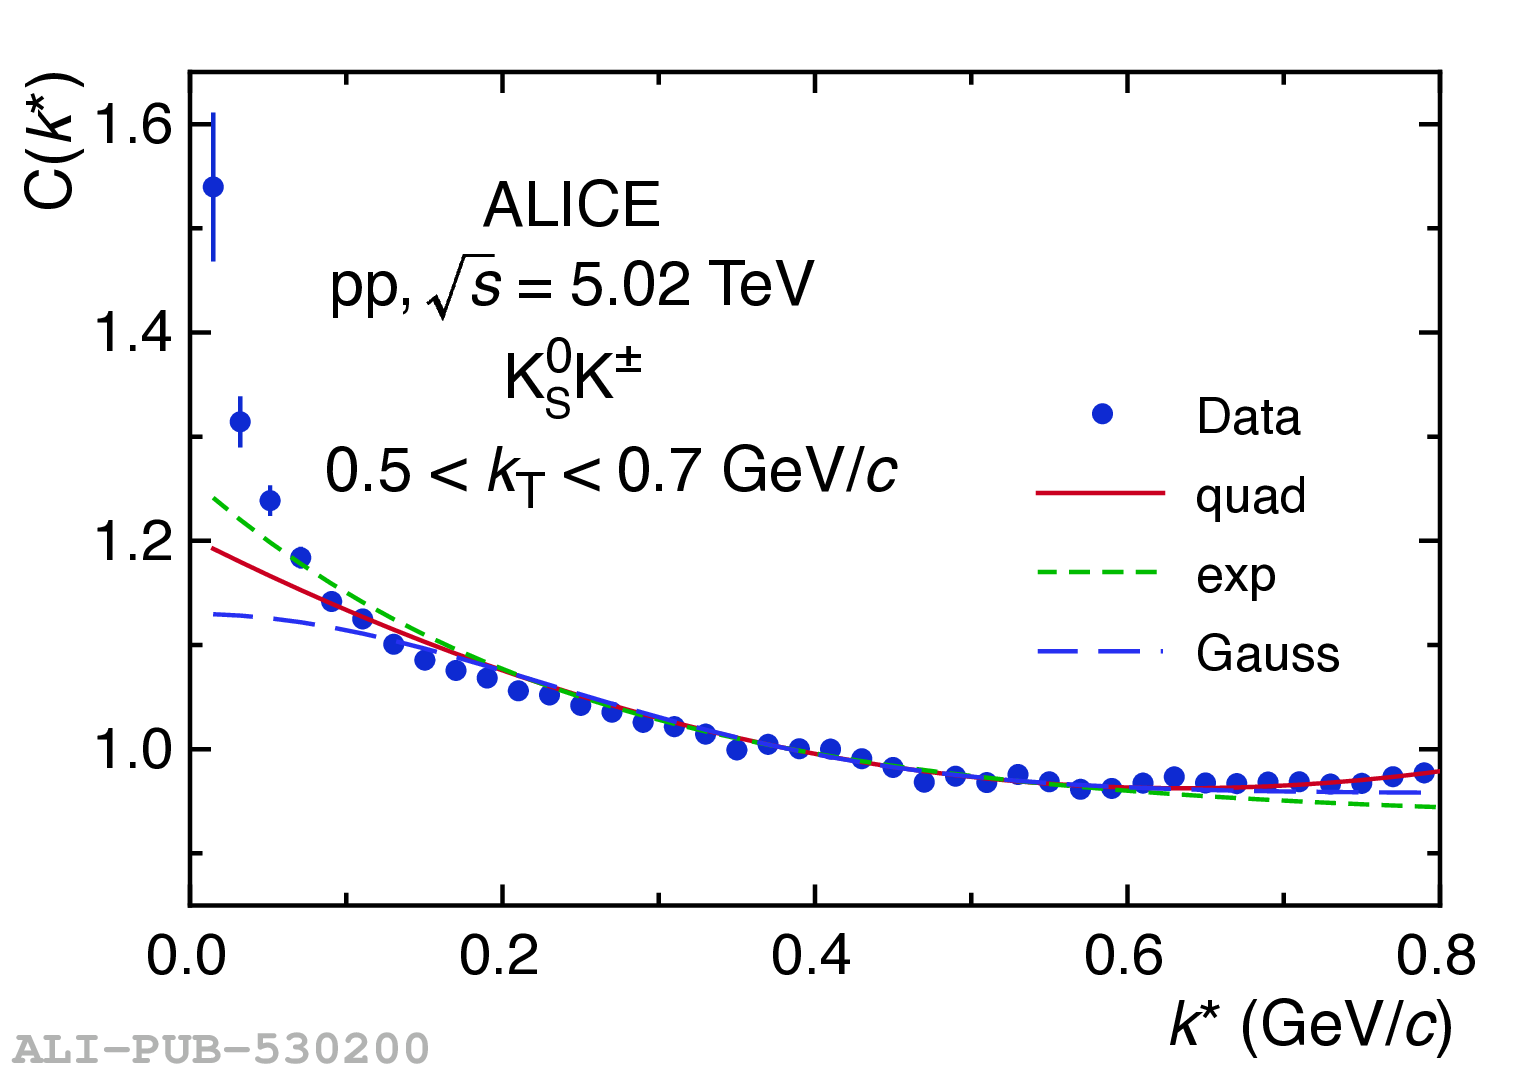
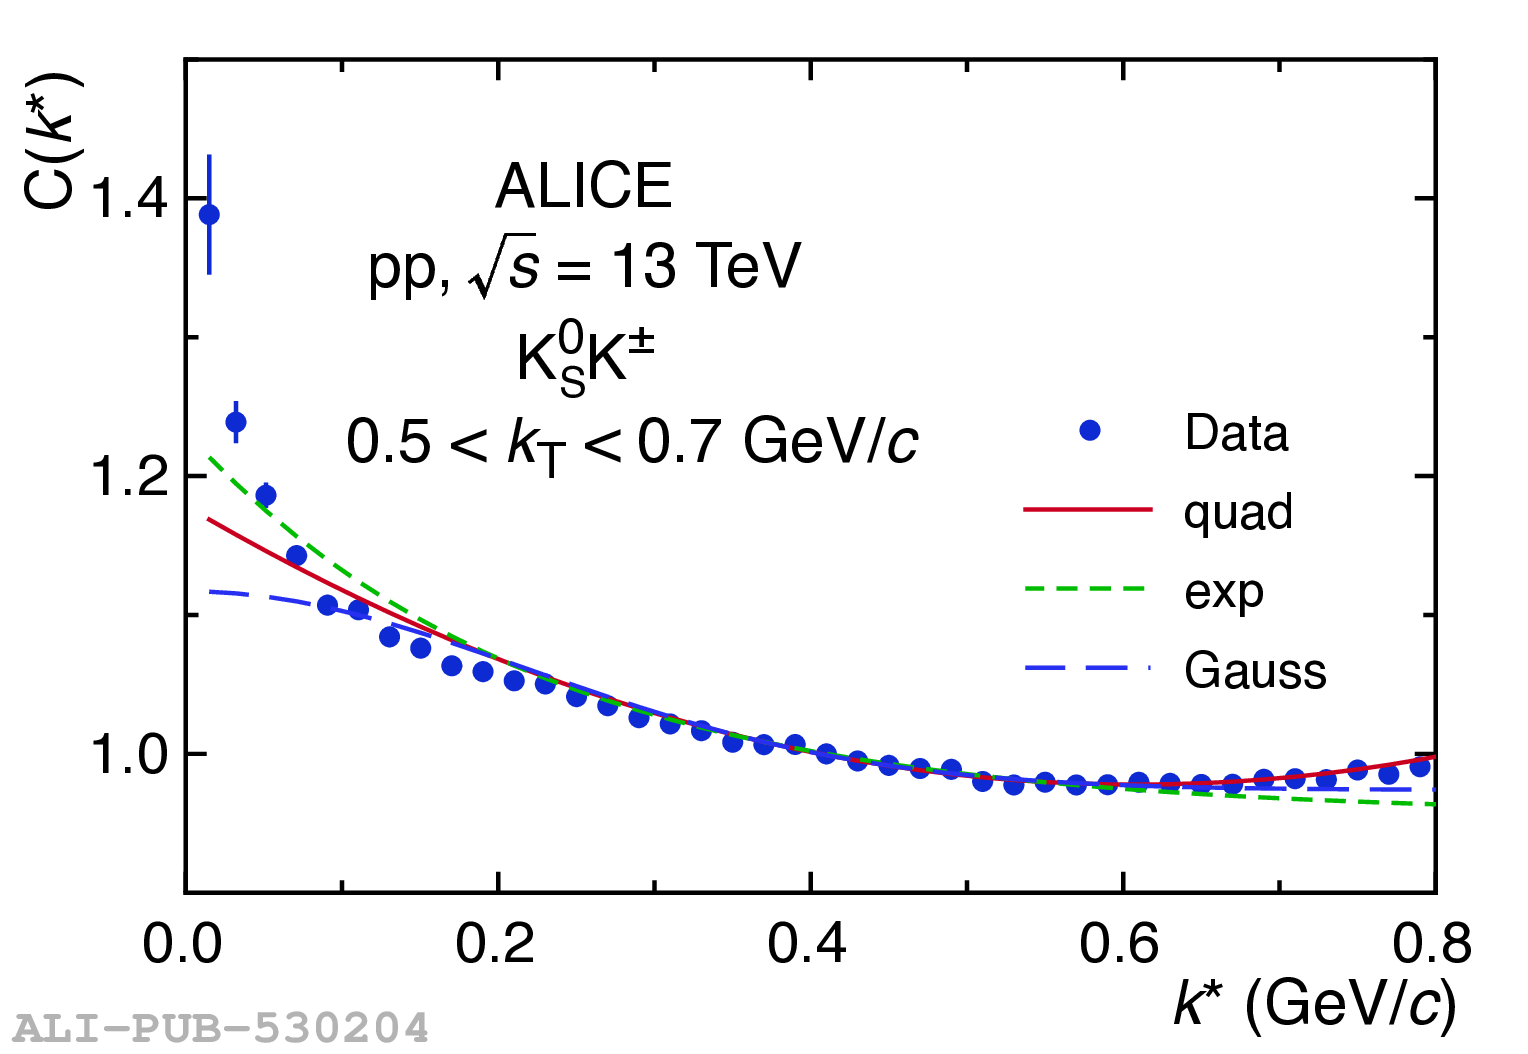
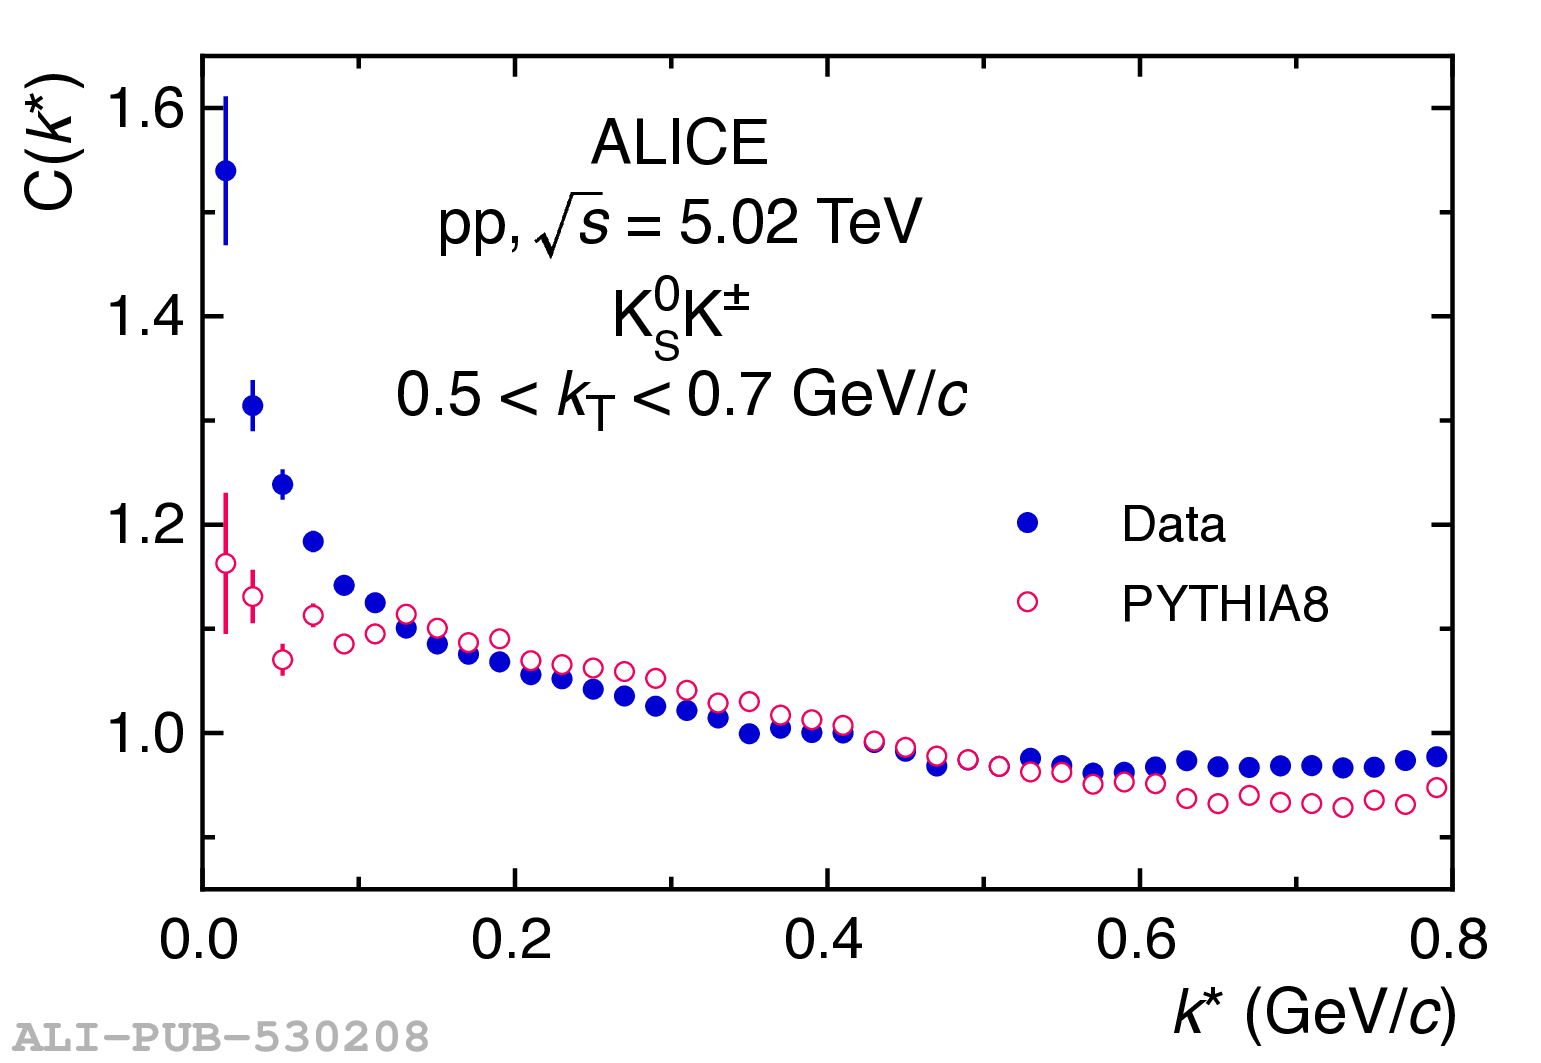
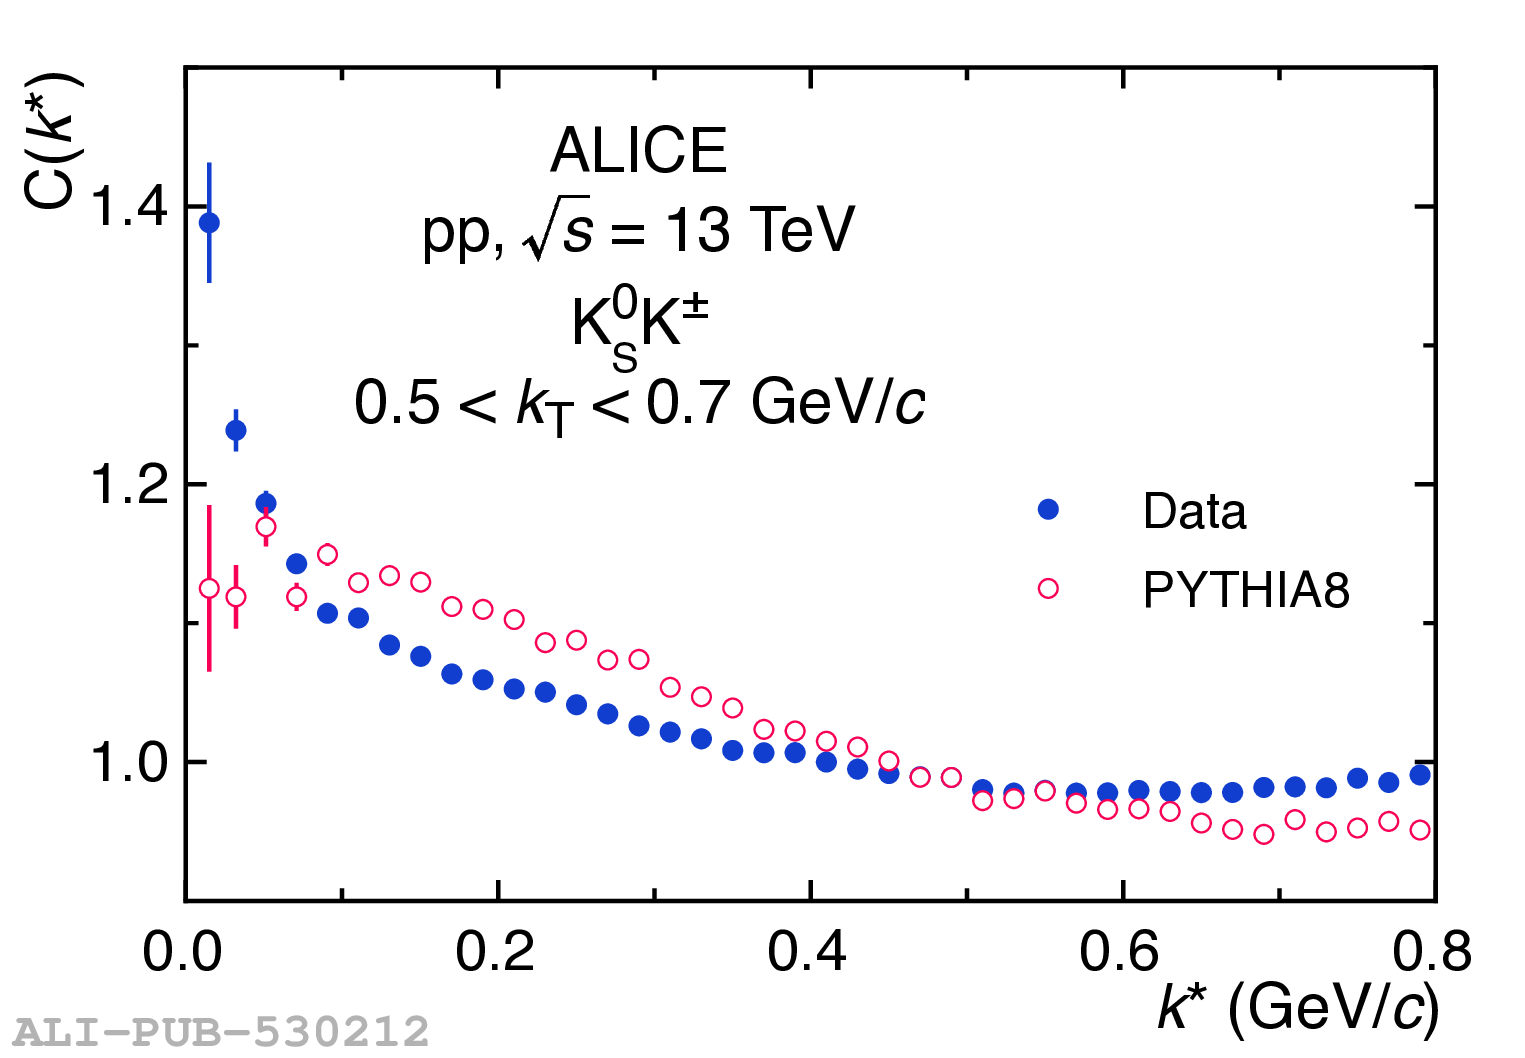
Figure 4
Example fits of Eq. 6 to the ratio of the data toPYTHIA8 correlation functions for K$^0_{\rm S}$K$^0_{\rm S}$ in pp collisions at $\sqrt{s}=$ 5.02 TeV (left) and 13 TeV (right). Statistical uncertainties are shown as error bars and systematic uncertainties are shown as boxes. | 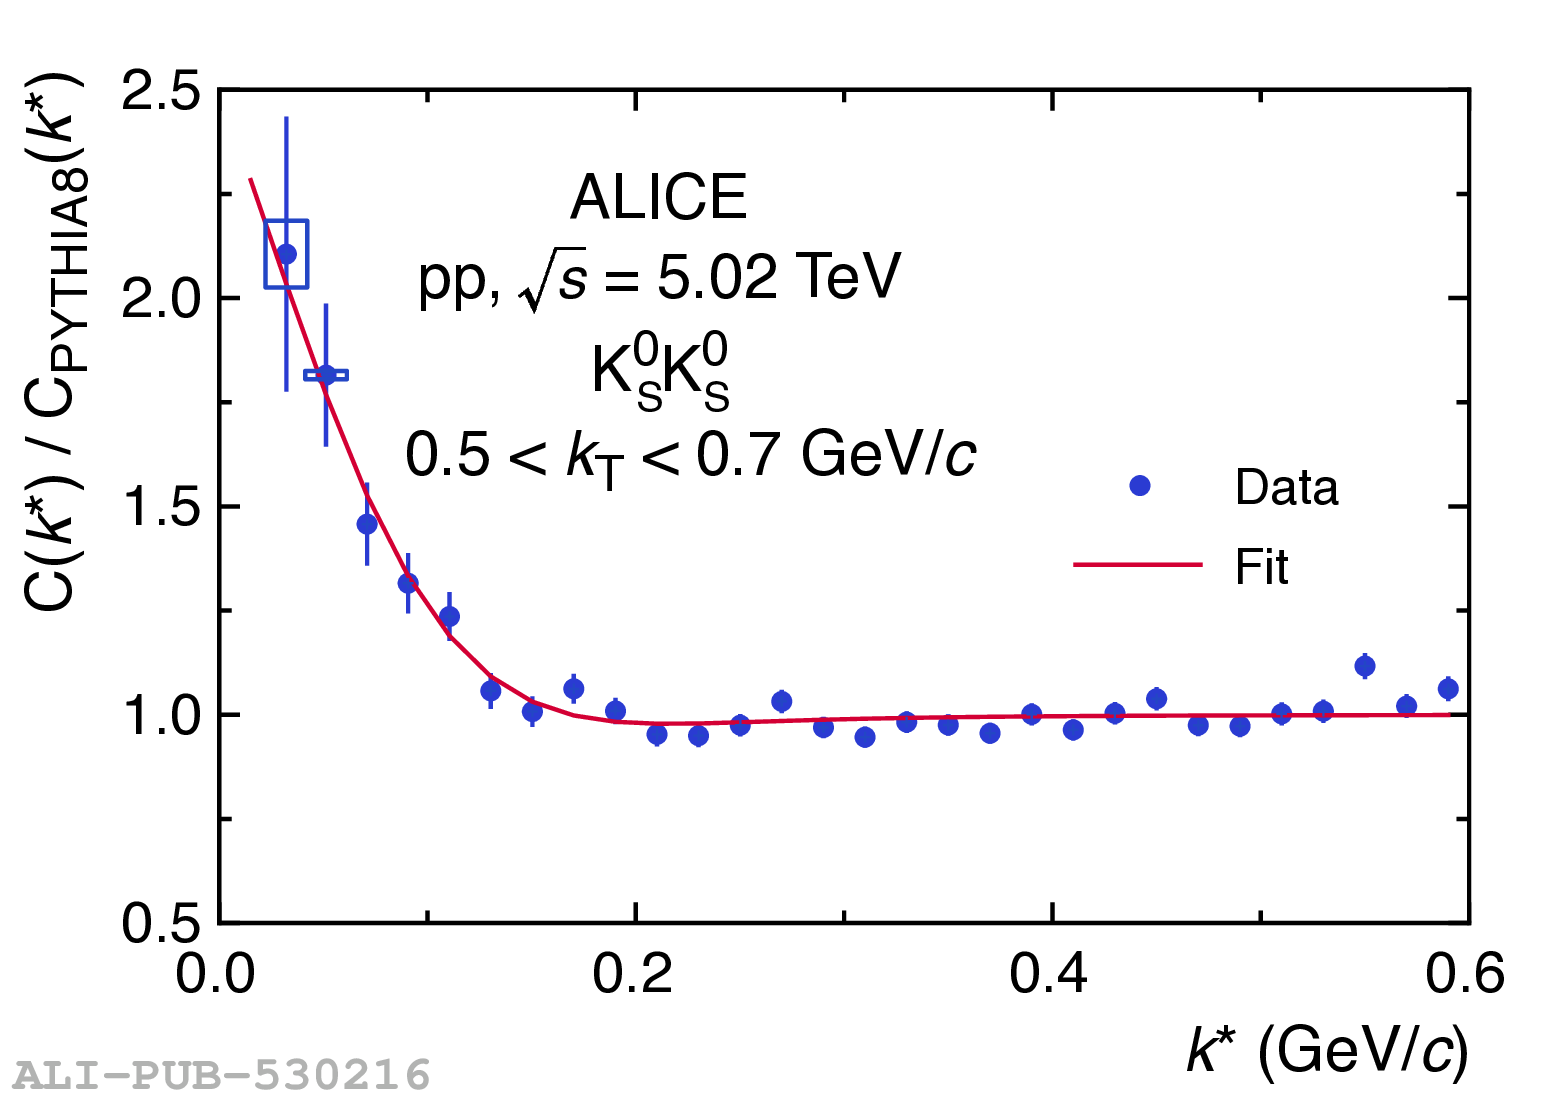  |

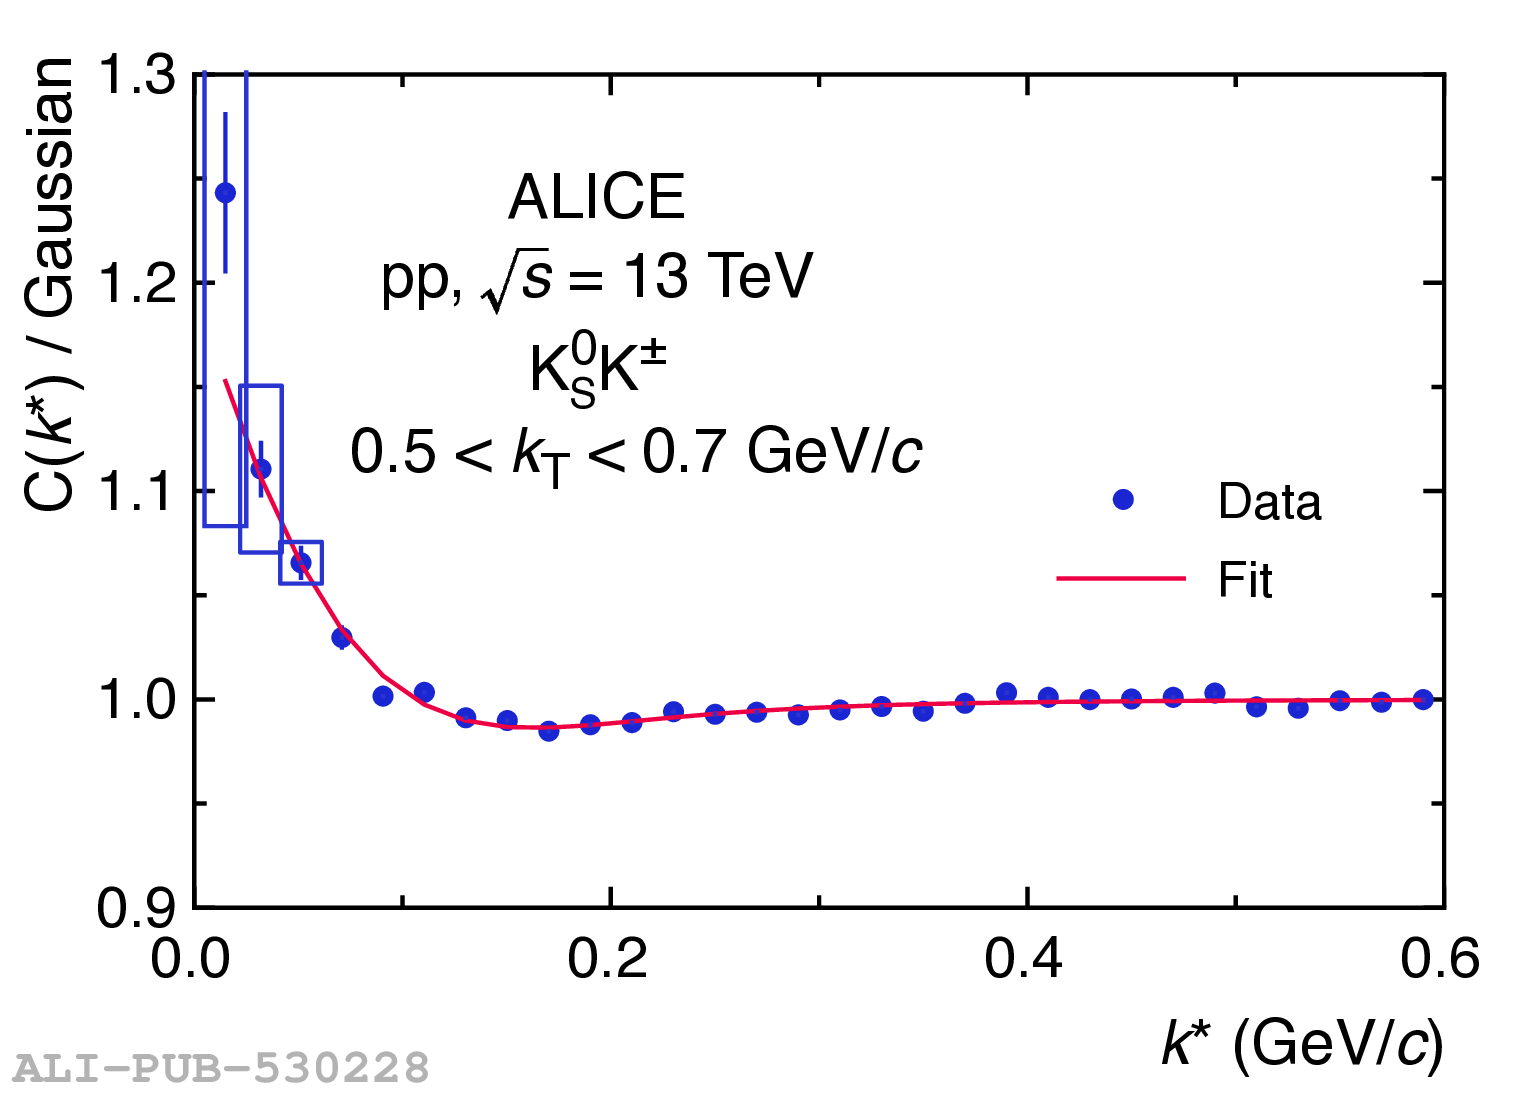
Figure 6
$R$ (left) and $\lambda$ (right) parameters extracted in the present analysis from Table 3 compared with published K$^0_{\rm S}$K$^0_{\rm S}$ and K$^0_{\rm S}$K$^{\rm \pm}$ results from ALICE 7 TeV pp collisions averaged over event multiplicity and evaluated at $\langle k_{\rm T} \rangle =0.6$ GeV/$c$. Statistical uncertaintiesare shown as error bars andthe systematic uncertainties are shown as boxes. | 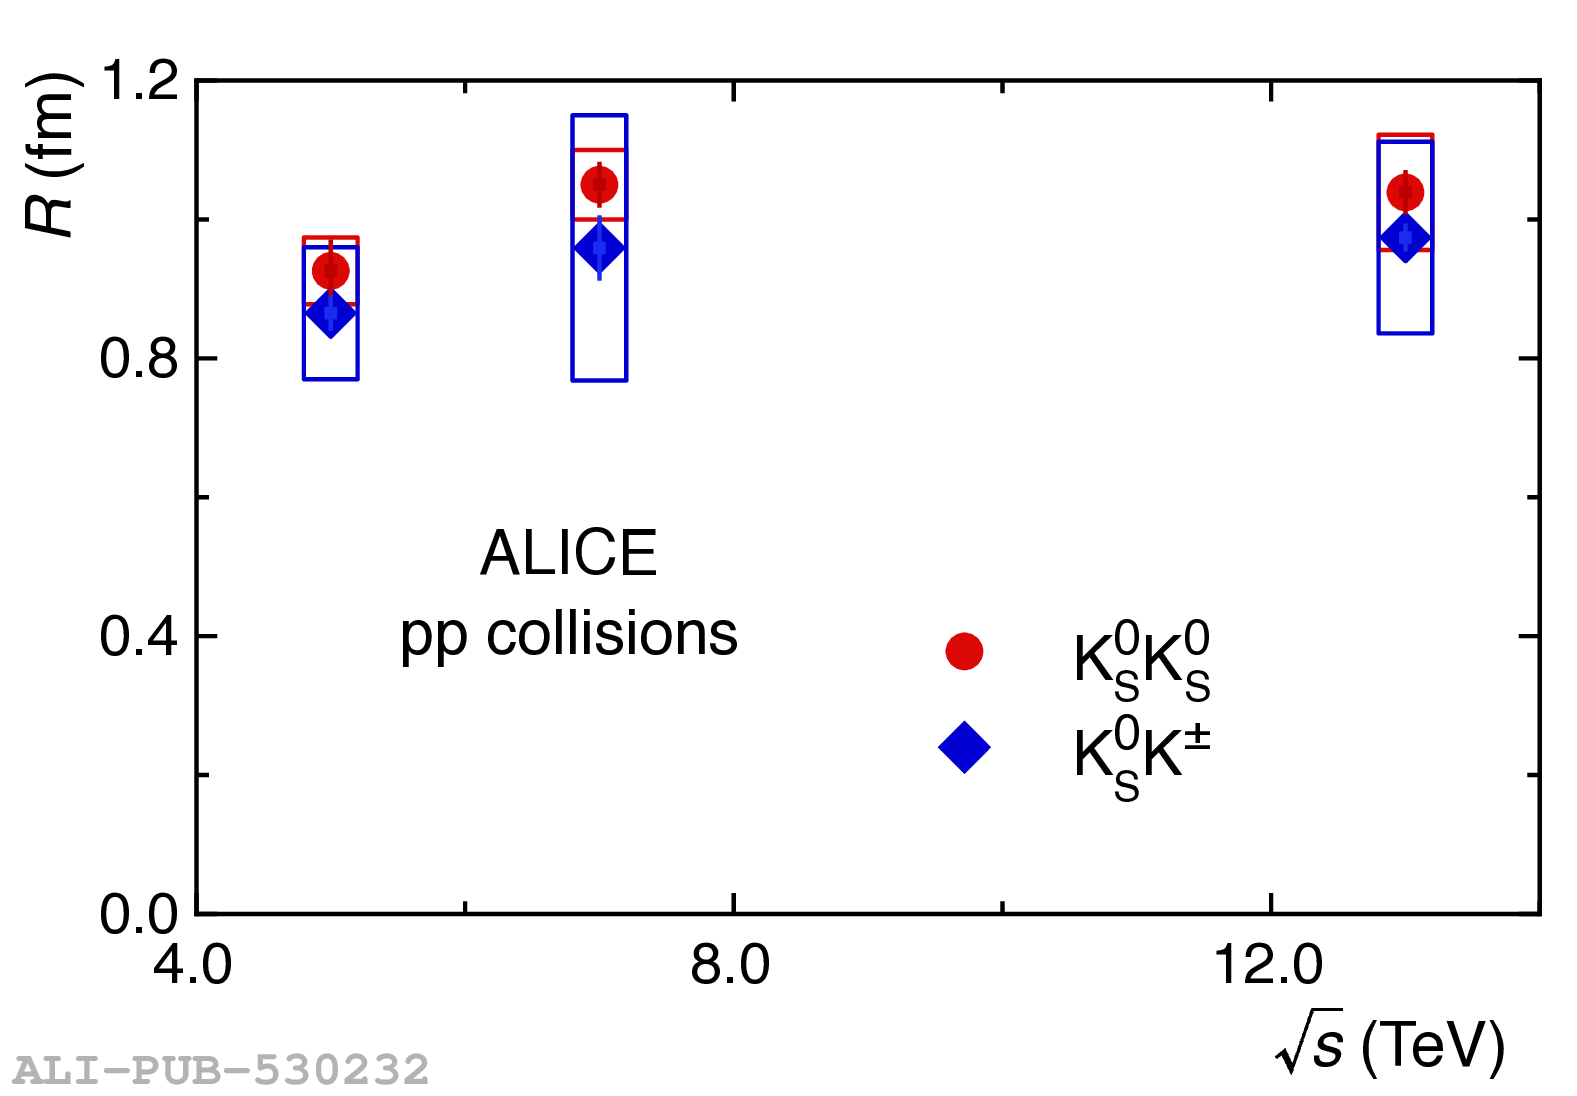 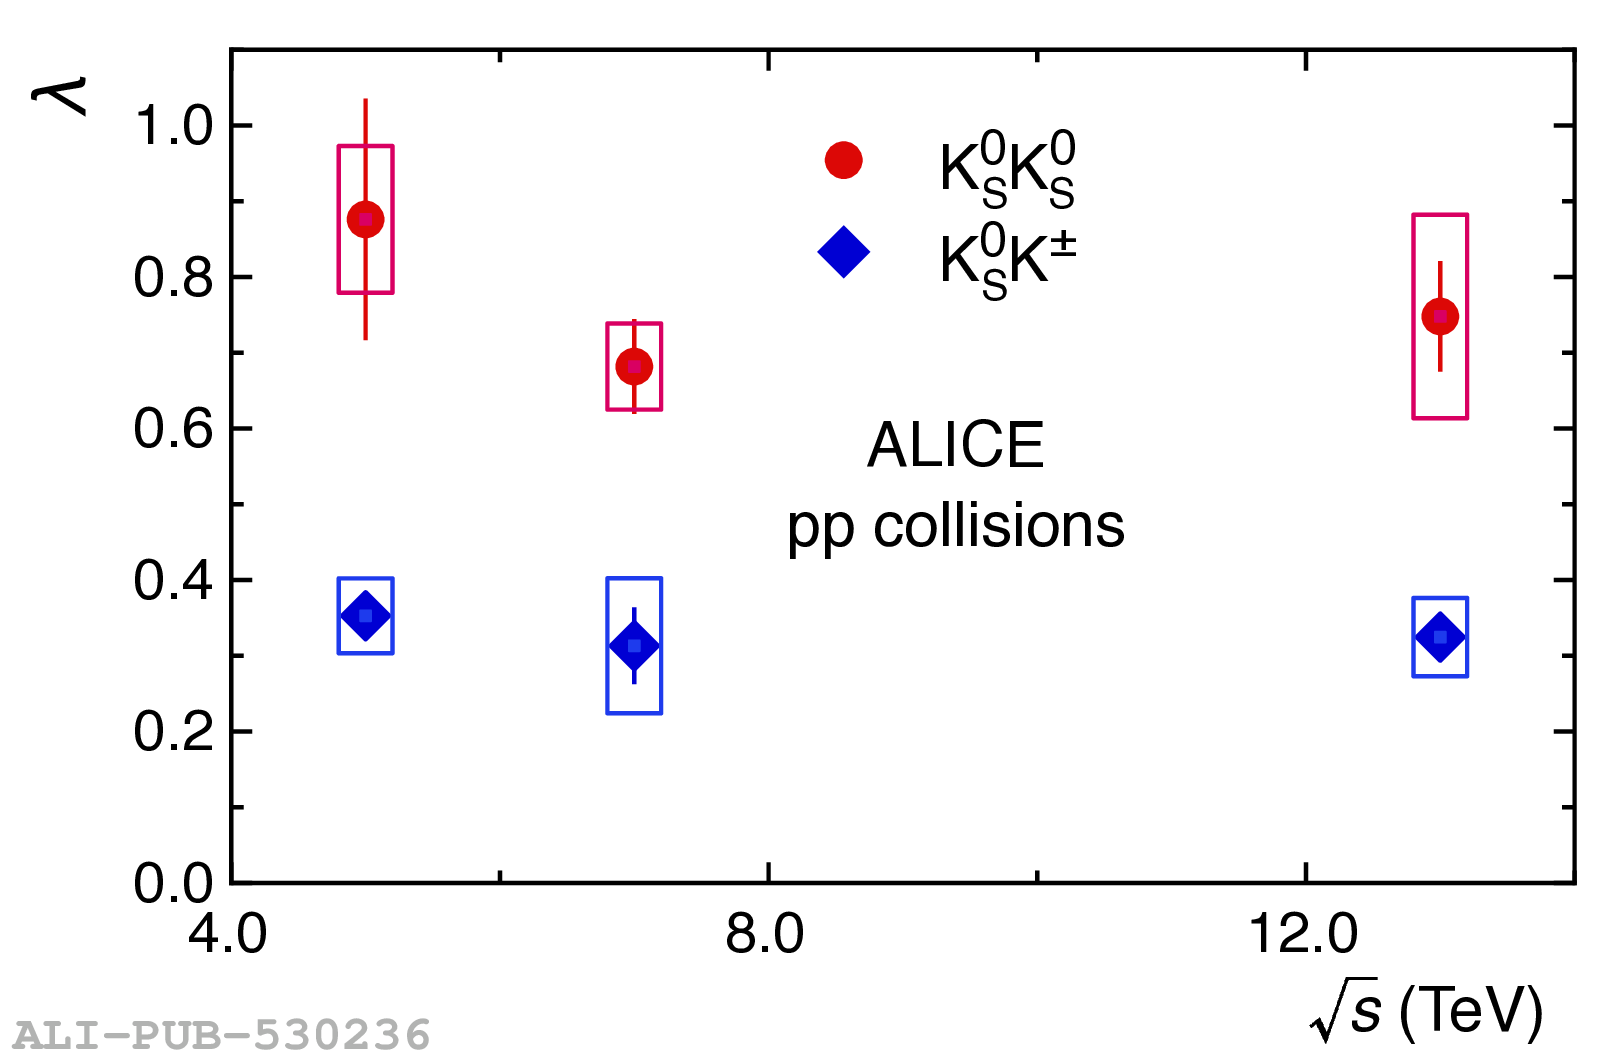 |
Figure 7
Differences in $\lambda$ parameters extracted in the present analysis from Table 3 compared with published identical and non-identical kaon results from ALICE 7 TeV pp collisions averaged over event multiplicity and evaluated at $\langle k_T \rangle =0.6$ GeV/$c$. Total uncertainties are shown. The weighted average of the differences is shown as a solid red line and the weighted uncertainty, $\pm\sigma$, shown as red dashed lines. | 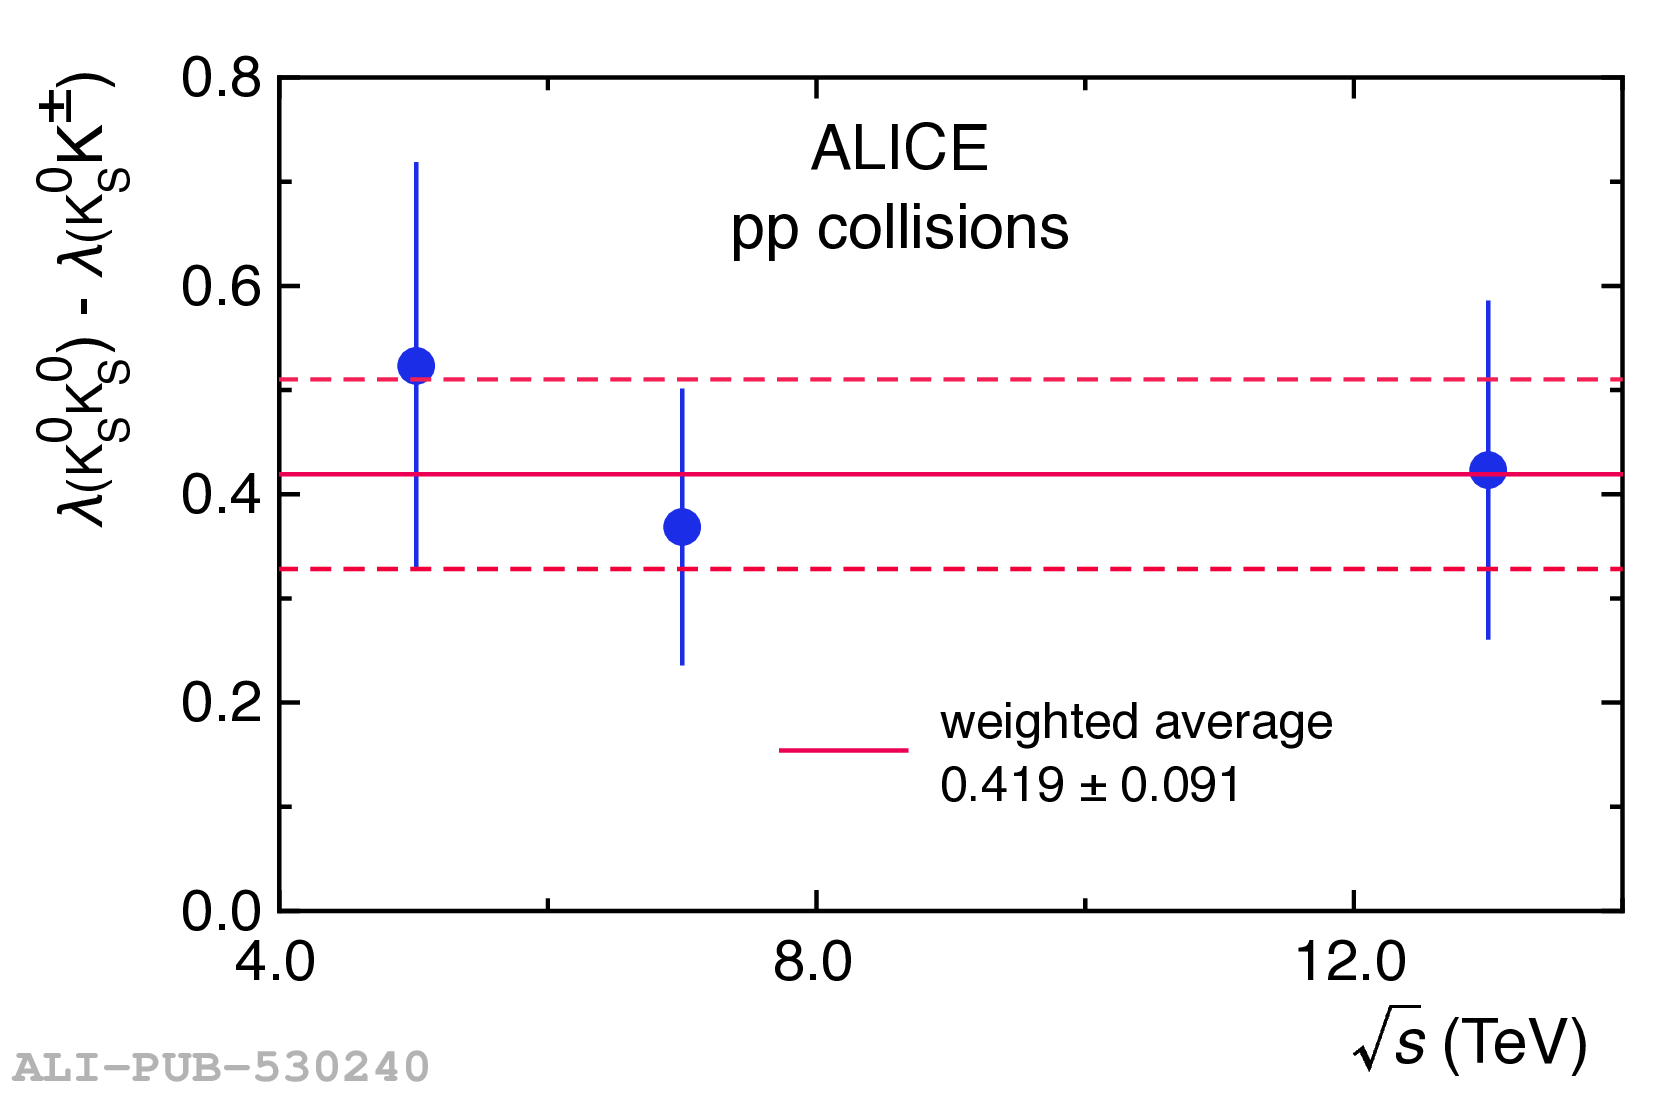 |