The interaction of $\rm{K}^{-}$ with protons is characterised by the presence of several coupled channels, systems like ${\rm \overline{K}^0}$n and $\pi\Sigma$ with a similar mass and the same quantum numbers as the $\rm{K}^{-}$p state. The strengths of these couplings to the $\rm{K}^{-}$p system are of crucial importance for the understanding of the nature of the $\Lambda(1405)$ resonance and of the attractive $\rm{K}^{-}$p strong interaction. In this article, we present measurements of the $\rm{K}^{-}$p correlation functions in relative momentum space obtained in pp collisions at $\sqrt{s}~=~13$ TeV, in p-Pb collisions at $\sqrt{s_{\mathrm{NN}}}~=~5.02$ TeV, and (semi)peripheral Pb-Pb collisions at $\sqrt{s_{\mathrm{NN}}}~=~5.02$ TeV. The emitting source size, composed of a core radius anchored to the $\rm{K}^{+}$p correlation and of a resonance halo specific to each particle pair, varies between 1 and 2 fm in these collision systems. The strength and the effects of the ${\rm \overline{K}^0}$n and $\pi\Sigma$ inelastic channels on the measured $\rm{K}^{-}$p correlation function are investigated in the different colliding systems by comparing the data with state-of-the-art models of chiral potentials. A novel approach to determine the conversion weights $\omega$, necessary to quantify the amount of produced inelastic channels in the correlation function, is presented. In this method, particle yields are estimated from thermal model predictions, and their kinematic distribution from blast-wave fits to measured data. The comparison of chiral potentials to the measured $\rm{K}^{-}$p interaction indicates that, while the $\pi\Sigma-\rm{K}^{-}$p dynamics is well reproduced by the model, the coupling to the ${\rm \overline{K}^0}$n channel in the model is currently underestimated.
Eur. Phys. J. C 83 (2023) 340
HEP Data
e-Print: arXiv:2205.15176 | PDF | inSPIRE
CERN-EP-2022-107
Figure group
Figure 1
$K^+p$ ($K^+p$ $\oplus$ $K^-\overline{p}$) correlation function obtained in pp collisions at $\sqrt{s}$ = 13 TeV. The measured data points are taken from Ref.[38] and are corrected for finite experimental momentum resolution and for residual correlations as described in Section 4.1. Measured data are shown by the black markers, the vertical error bars and the boxes represent the statistical and systematic uncertainties, respectively. The red band in the upper panel represents the model calculation and its systematic uncertainty as described in the text. The $r_\mathrm{core}$ and $r_{\rm eff}$ values of the source are reported with their statistical and systematical uncertainties, respectively. Bottom panels represent the data-to-model comparison.
| 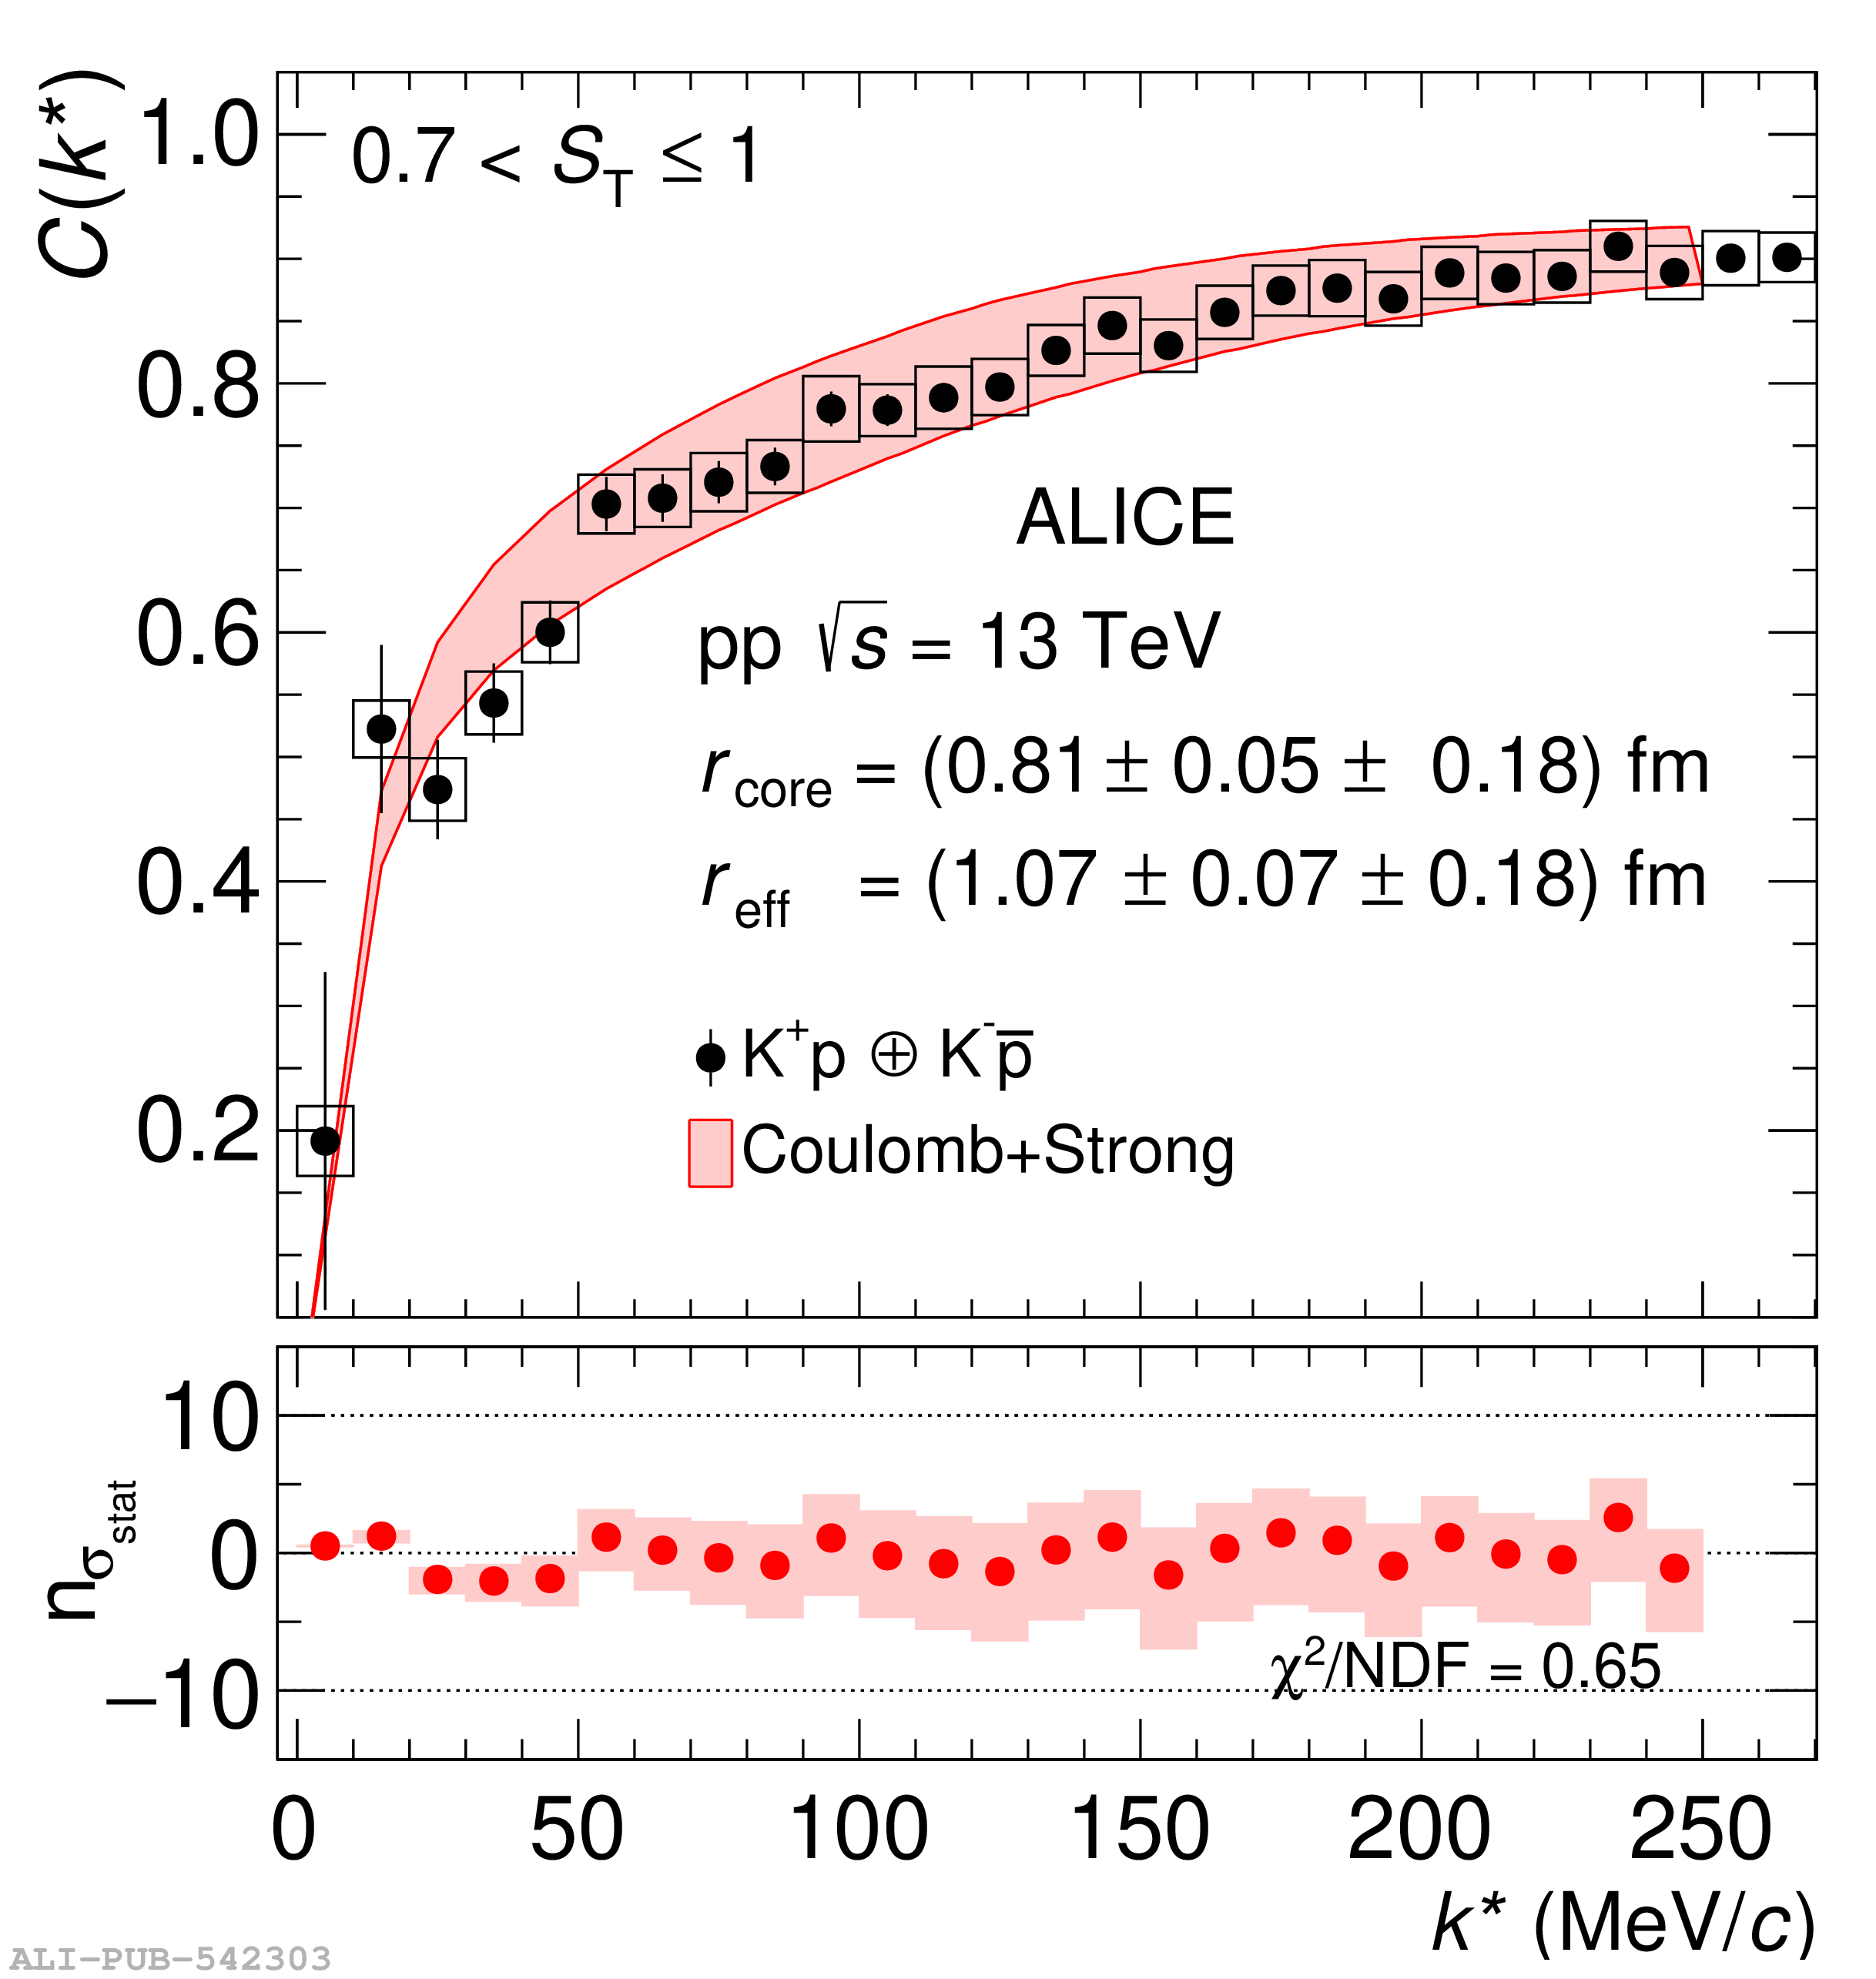 |
Figure 2
$K^+p$ ($K^+p$ $\oplus$ $K^-\overline{p}$) correlation functions obtained in p-Pb collisions at $\sqrt{s_{\mathrm{NN}}}$ in the 0-20% (left), 20-40% (middle) and 40-100% (right) centrality intervals. The measurement is shown by the black markers. The vertical error bars and the boxes represent the statistical and systematic uncertainties, respectively. The red band in the upper panels represents the model calculation and its systematic uncertainty as described in the text. The $r_\mathrm{core}$ and $r_{\rm eff}$ values of the source are reported with their statistical and systematical uncertainties, respectively. Bottom panels represent the data-to-model comparison. | 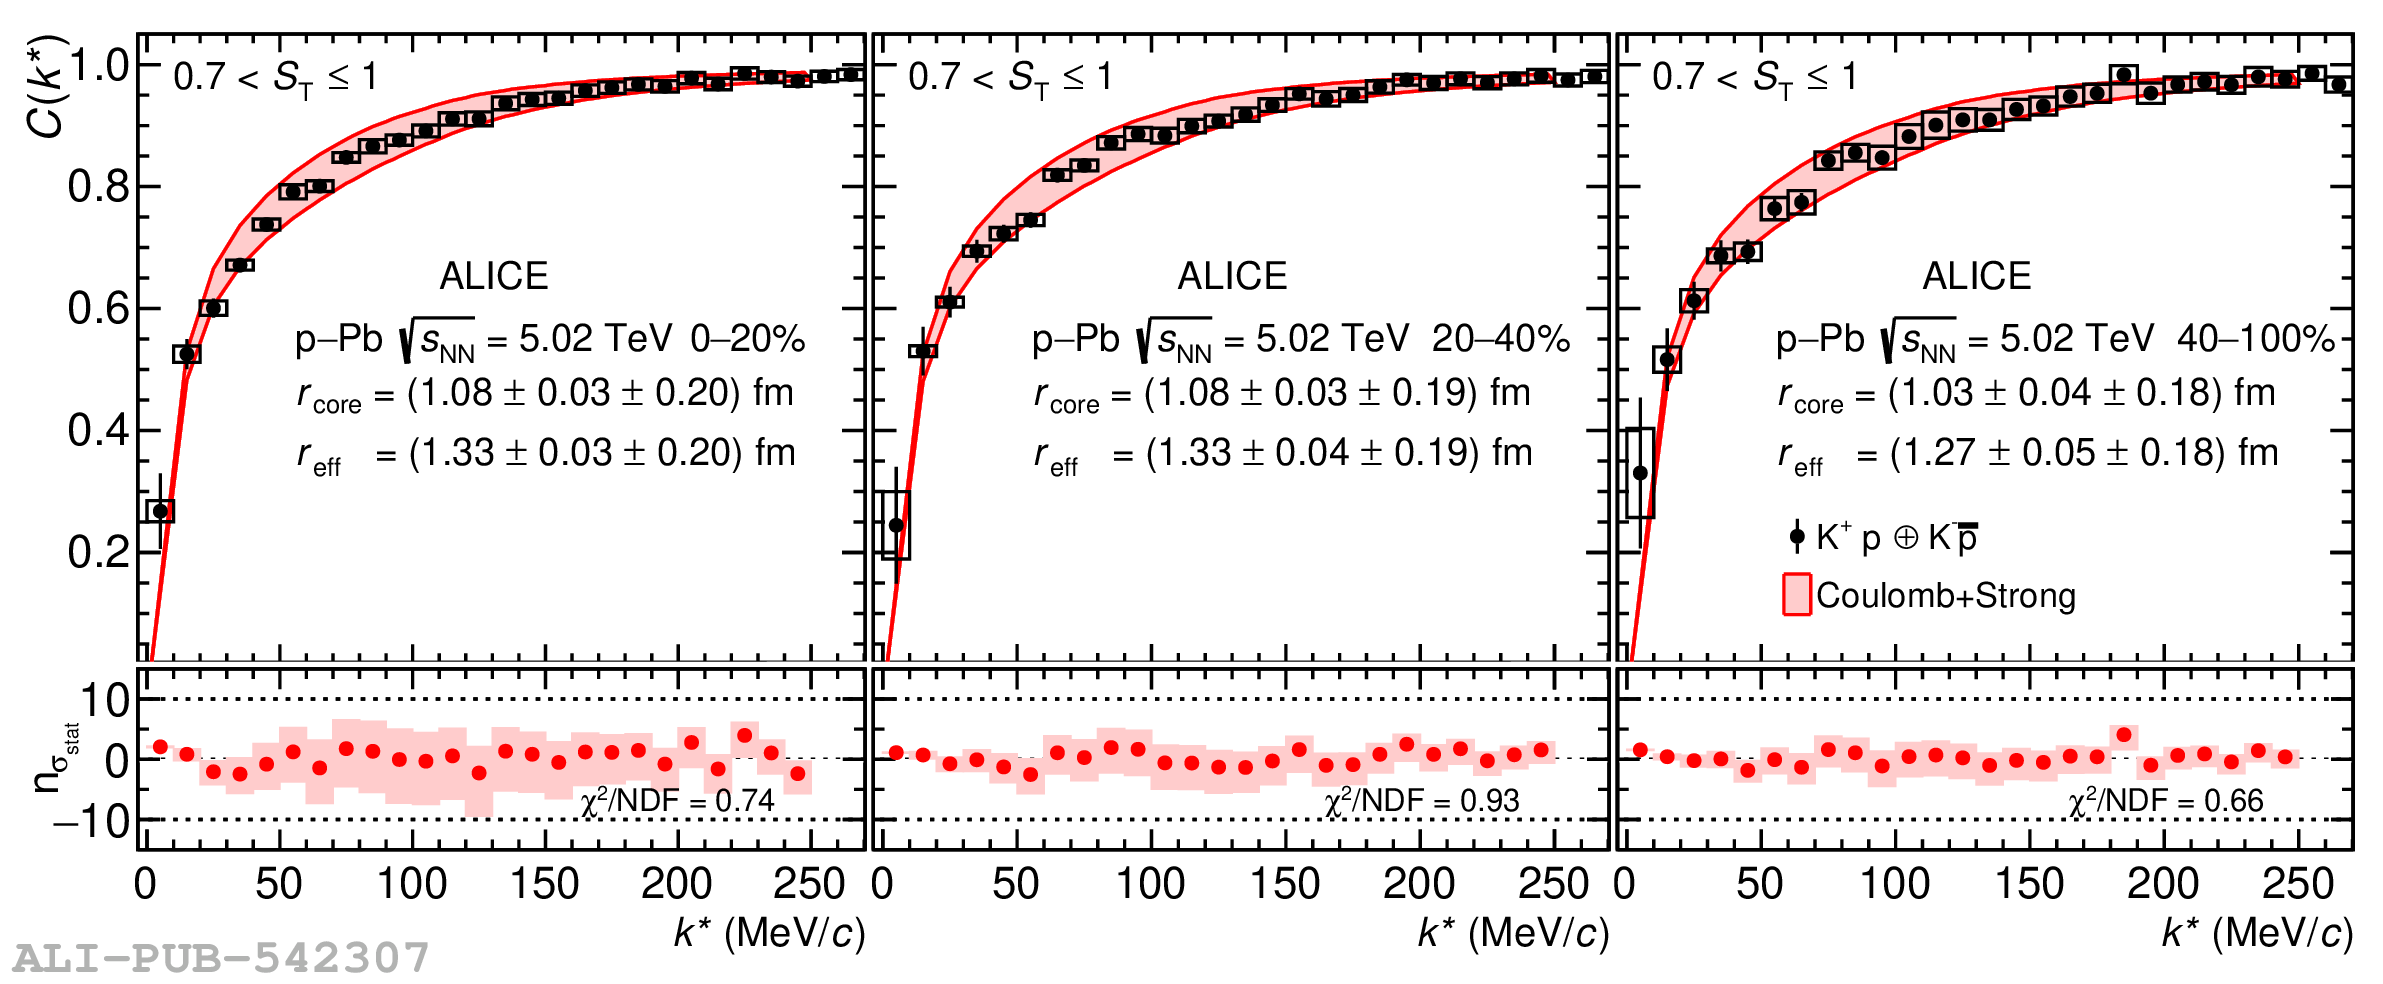 |
Figure 3
$K^+p$ ($K^+p$ $\oplus$ $K^-\overline{p}$) correlation functions obtained in Pb-Pb collisions at $\sqrt{s_{\mathrm{NN}}}$ = 5.02 TeV in the 60-70% (left), 70-80% (middle) and 80-90% (right) centrality intervals. The measurement is shown by the black markers. The vertical error bars and the boxes represent the statistical and systematic uncertainties, respectively. The red band in the upper panels represents the model calculation and its systematic uncertainty as described in the text. The $r_\mathrm{core}$ and $r_{\rm eff}$ values of the source are reported with their statistical and systematical uncertainties, respectively. Bottom panels represent the data-to-model comparison. | 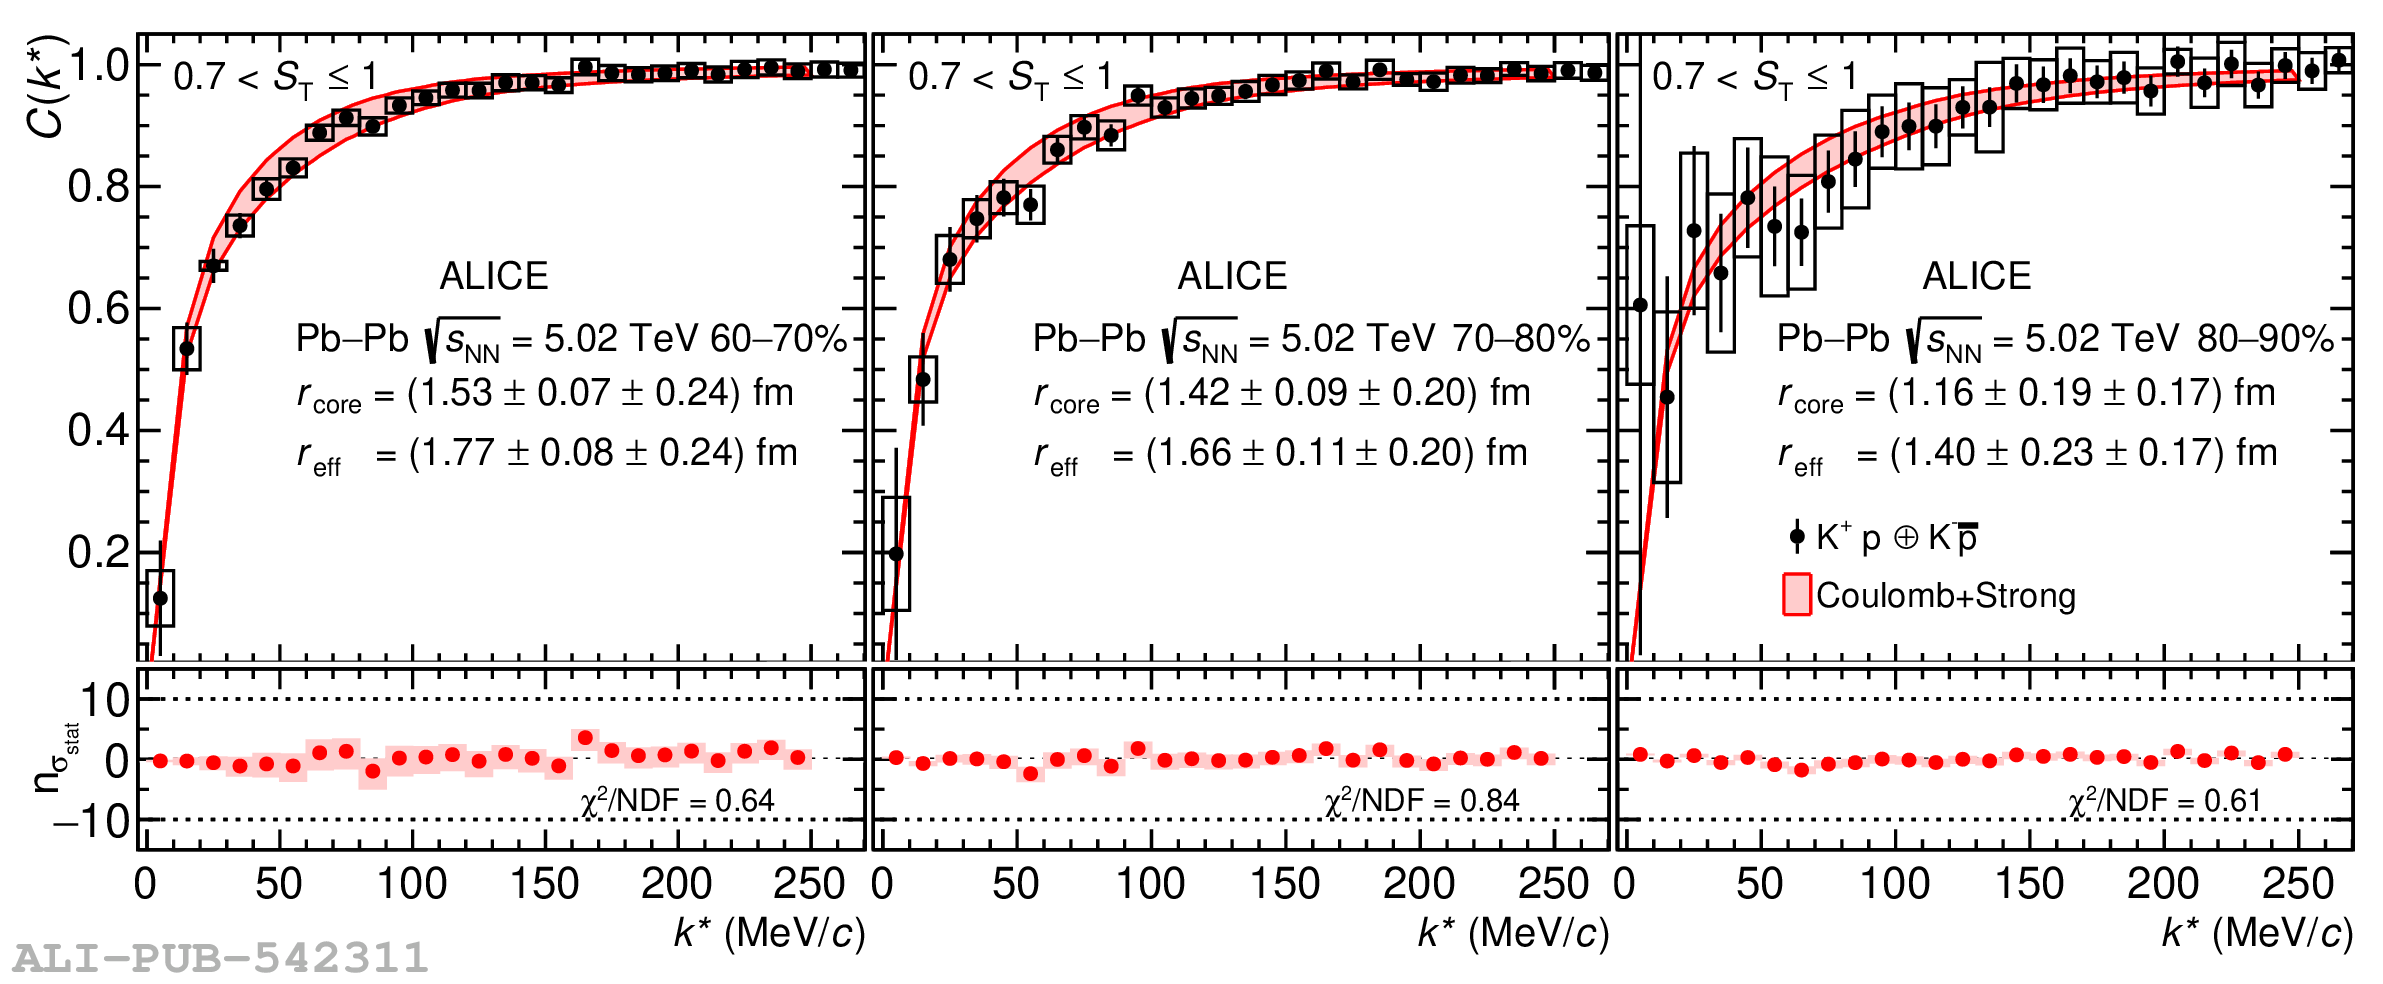 |
Figure 4
($K^-p$ $\oplus$ $K^+\overline{p}$) correlation functions obtained in pp collisions at $\sqrt{s}$ = 13 TeV. The measured data points are taken from [38] and have been corrected for finite experimental momentum resolution and for residual correlations as described in Section 4.1. Measured data are shown by the black markers, the vertical error bars and the boxes represent the statistical and systematic uncertainties, respectively. The red and blue bands in the upper panels represents the model calculations and its systematic uncertainty as described in the text. The $r_\mathrm{core}$ and $r_{\rm eff}$ values of the source are reported with their statistical and systematical uncertainties. Bottom panels represent the data-to-model comparison as described in the text. | 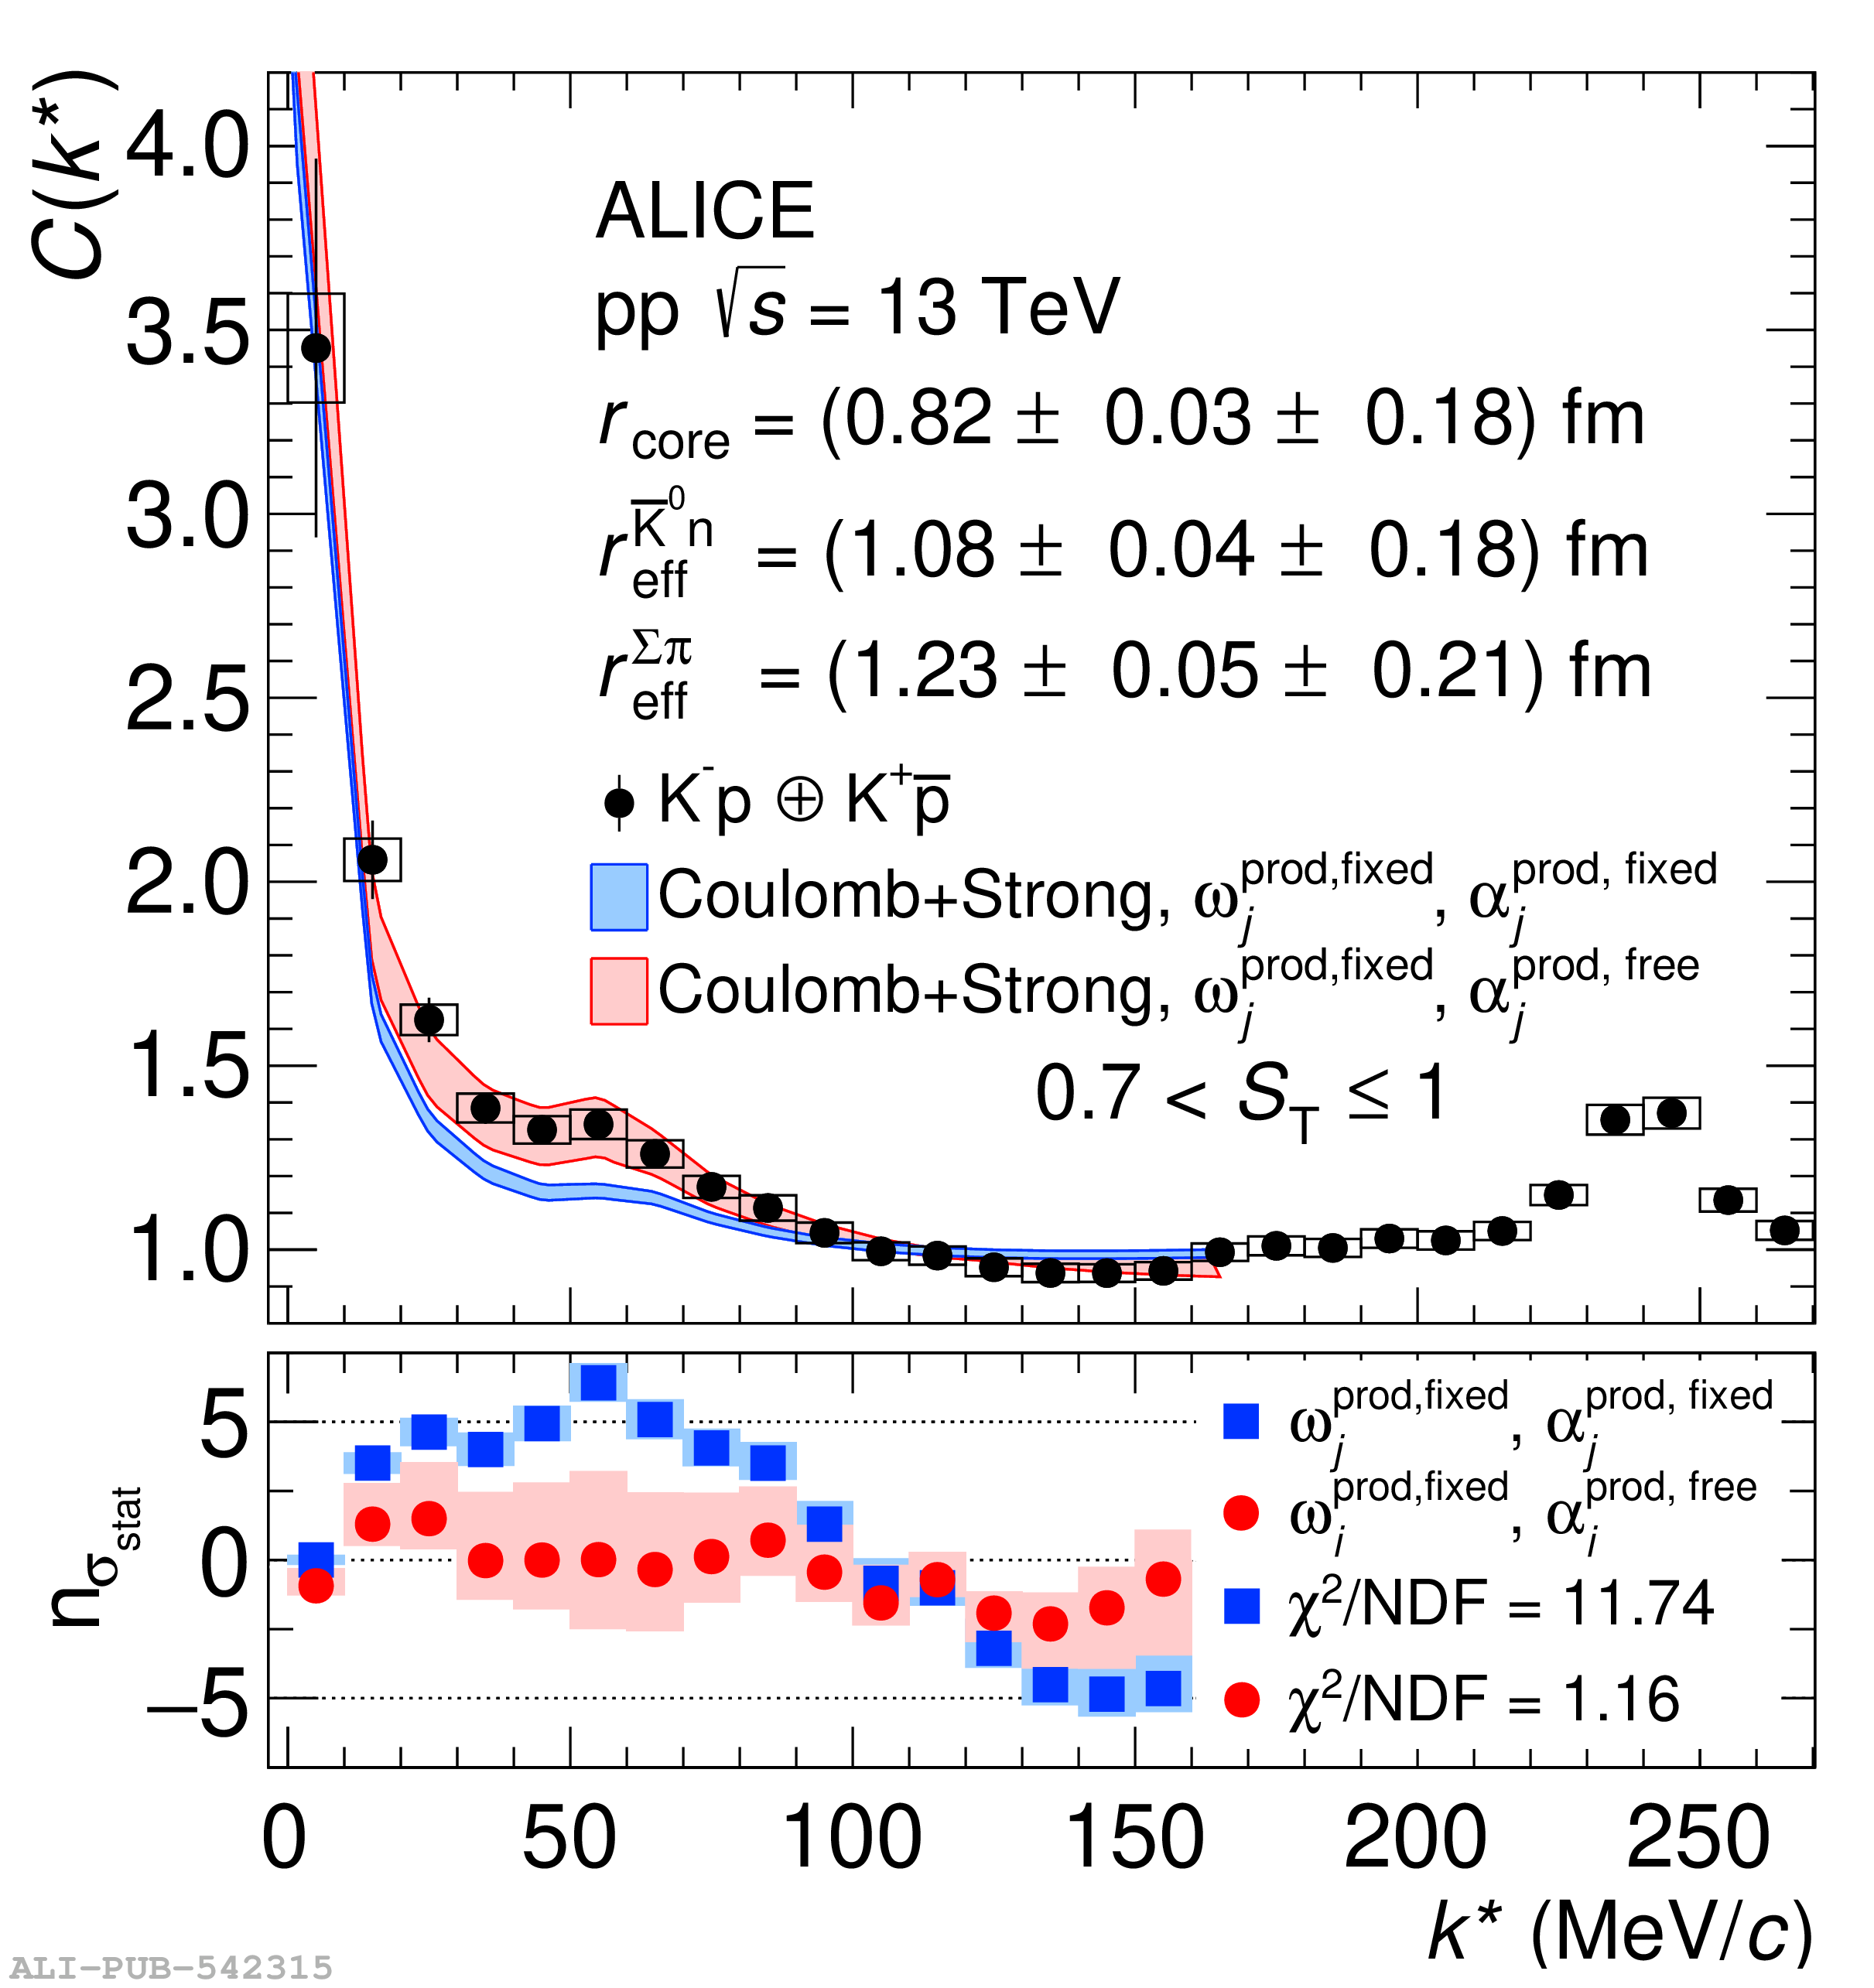 |
Figure 5
($K^-p$ $\oplus$ $K^+\overline{p}$) correlation functions obtained in p-Pb collisions at $\sqrt{s_{\mathrm{NN}}}$ in the 0-20% (left), 20-40% (middle) and 40-100% (right) centrality intervals. The measurement is shown by the black markers, the vertical error bars and the boxes represent the statistical and systematic uncertainties, respectively. The red and blue bands in the upper panels represent the model calculations and their systematic uncertainty as described in the text. The $r_\mathrm{core}$ and $r_{\rm eff}$ values of the source are reported with their statistical and systematical uncertainties, respectively. Bottom panels represent the data-to-model comparison as described in the text. | 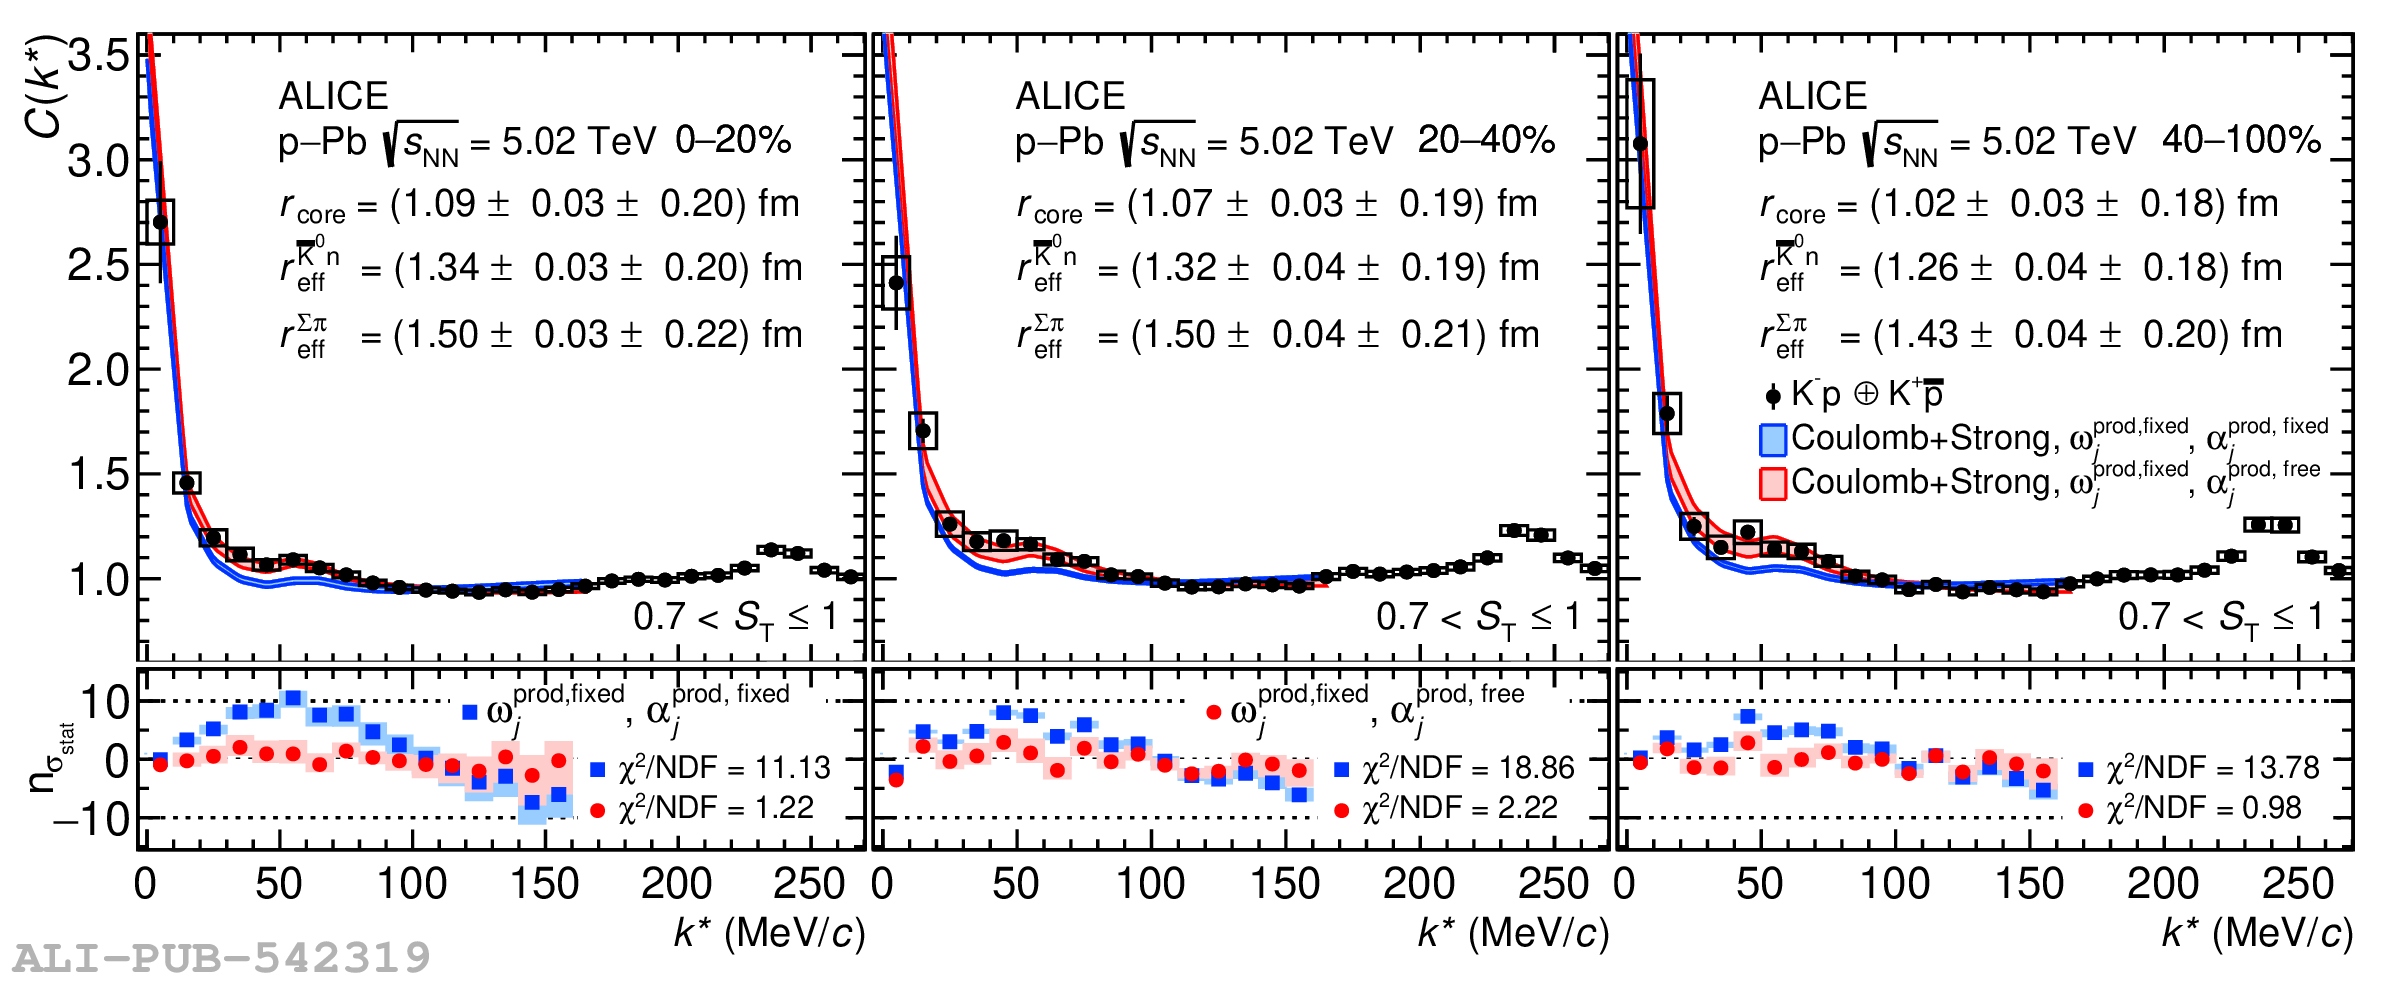 |
Figure 6
($K^-p$ $\oplus$ $K^+\overline{p}$) correlation functions obtained in Pb-Pb collisions at $\sqrt{s_{\mathrm{NN}}}$ in the 60-70% (left), 70-80% (middle) and 80-90% (right) centrality intervals. The measurement is shown by the black markers, the vertical error bars and the boxes represent the statistical and systematic uncertainties respectively. The red and blue bands in the upper panels represent the model calculations and their systematic uncertainty as described in the text. The $r_\mathrm{core}$ and $r_{\rm eff}$ values of the source are reported with their statistical and systematical uncertainties, respectively. Bottom panels represent the data-to-model comparison as described in the text. | 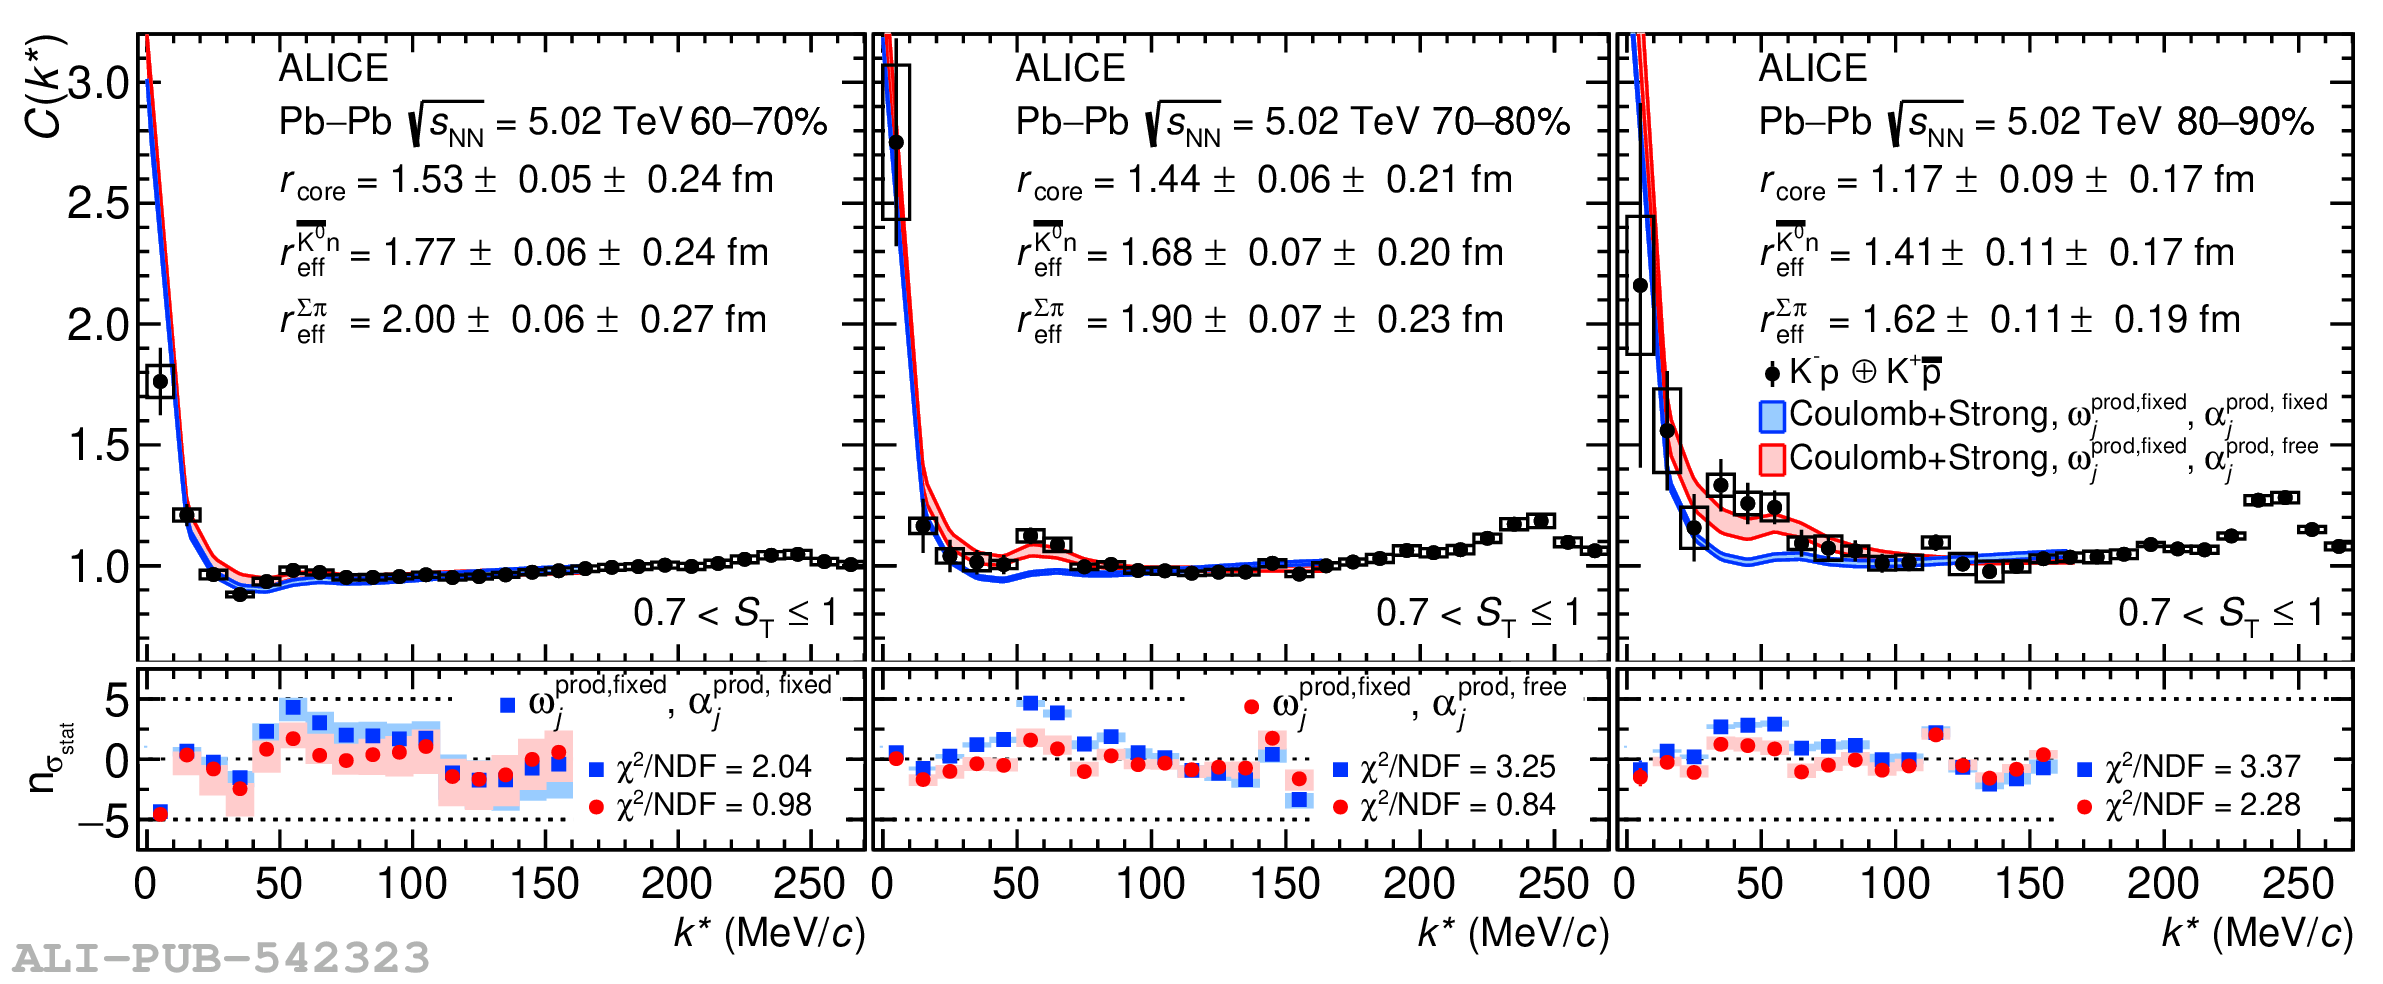 |
Figure 7
Scaling factor ($\alpha_j $) for $\overline{K^0}$ n (black circles) and $\Sigma \pi$ (red squares) extracted from the different fits of the K$^-$p correlation function as a function of the core radius $r_{\mathrm{core}}$ extracted for pp, p-Pb and Pb-Pb collisions. The vertical error bars and boxes represent the statistical and systematic uncertainties on the extracted parameters, respectively. The widths of the boxes represent the systematic uncertainty associated to each extracted $r_{\mathrm{core}}$. The black and red bands represent the uncertainty coming from the yield estimates in TF and the variations applied in the BW kinematics summed in quadrature as described in the text for $\overline{K^0}$ n and $\Sigma \pi$, respectively. | 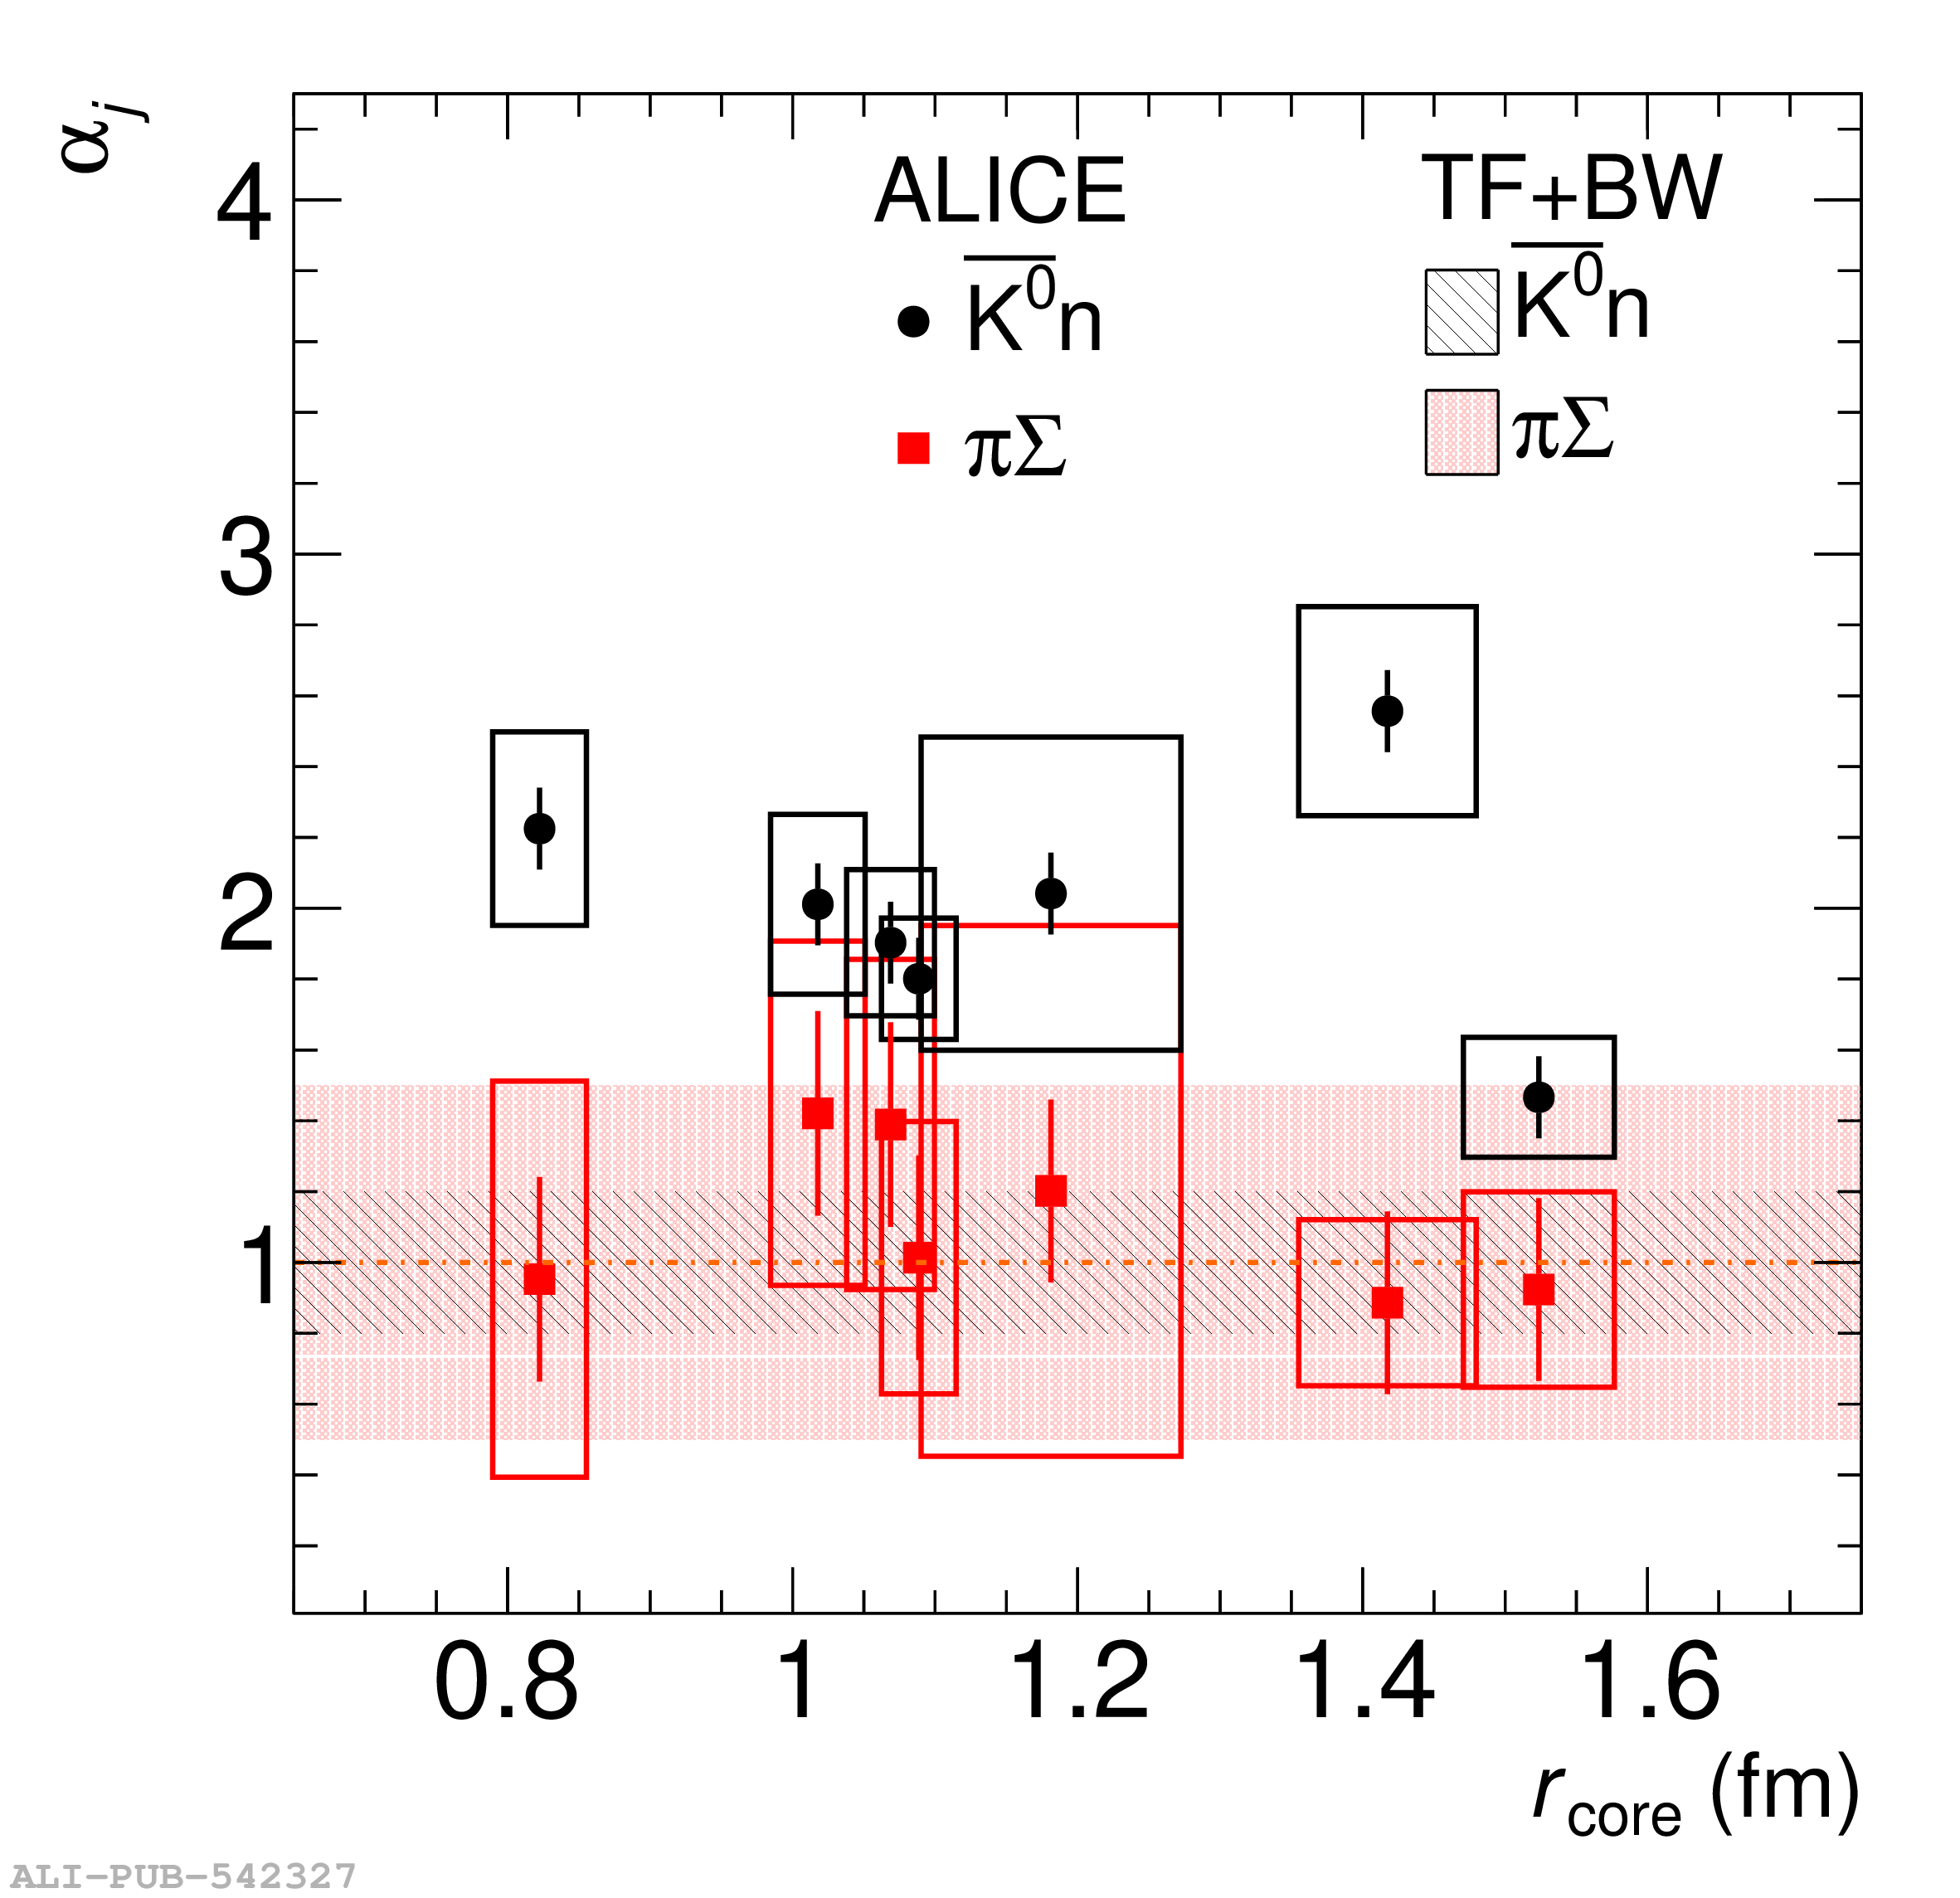 |