Upper panels: average transverse momenta of \pion, \kaon, and \pr as a function of charged-particle multiplicity density measured in pp collisions at \cme{\textrm{7 and 13}}. The red solid line represents $a-b(c-\mdNde)^{-1}$ fit to the 13 TeV data to guide the eye. Open (shaded) boxes represent total (multiplicity uncorrelated) systematic uncertainties. Black lines represent predictions from different MC generators for pp collisions at \cme{13}. Bottom panels: ratios of \mpT to the fits. Data at \cme{7} are from . | 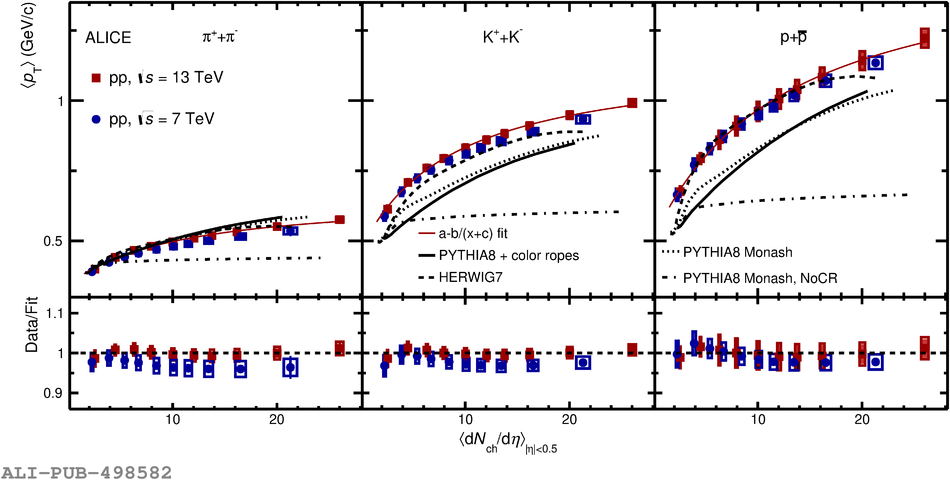 |