Correlation of kinetic freeze-out temperature \Tkin and average expansion velocity \mbeta, extracted from simultaneous Blast-Wave fits to \pion, \kaon, and \pr spectra measured in pp, p--Pb, and Pb--Pb collisions. Contours represent 1$\sigma$ uncertainty. The shaded ellipses represent the \Tkin-\mbeta correlation calculated from Blast-Wave fit to \kaon, \pr, and $\Lambda$ spectra measured in pp collisions at \cme{13}. The empty circles represent Blast-Wave fits with resonance decays . References from . | 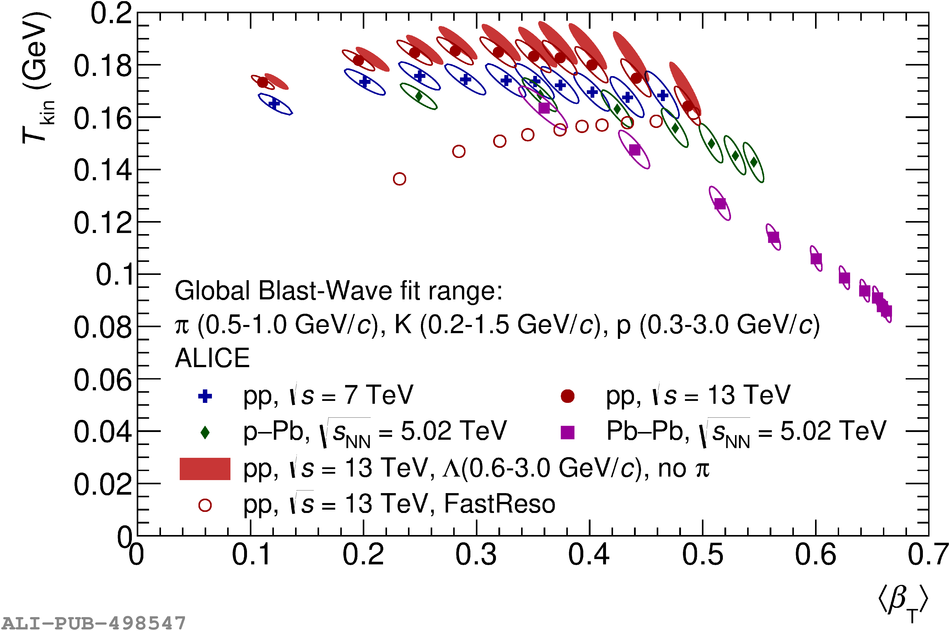 |